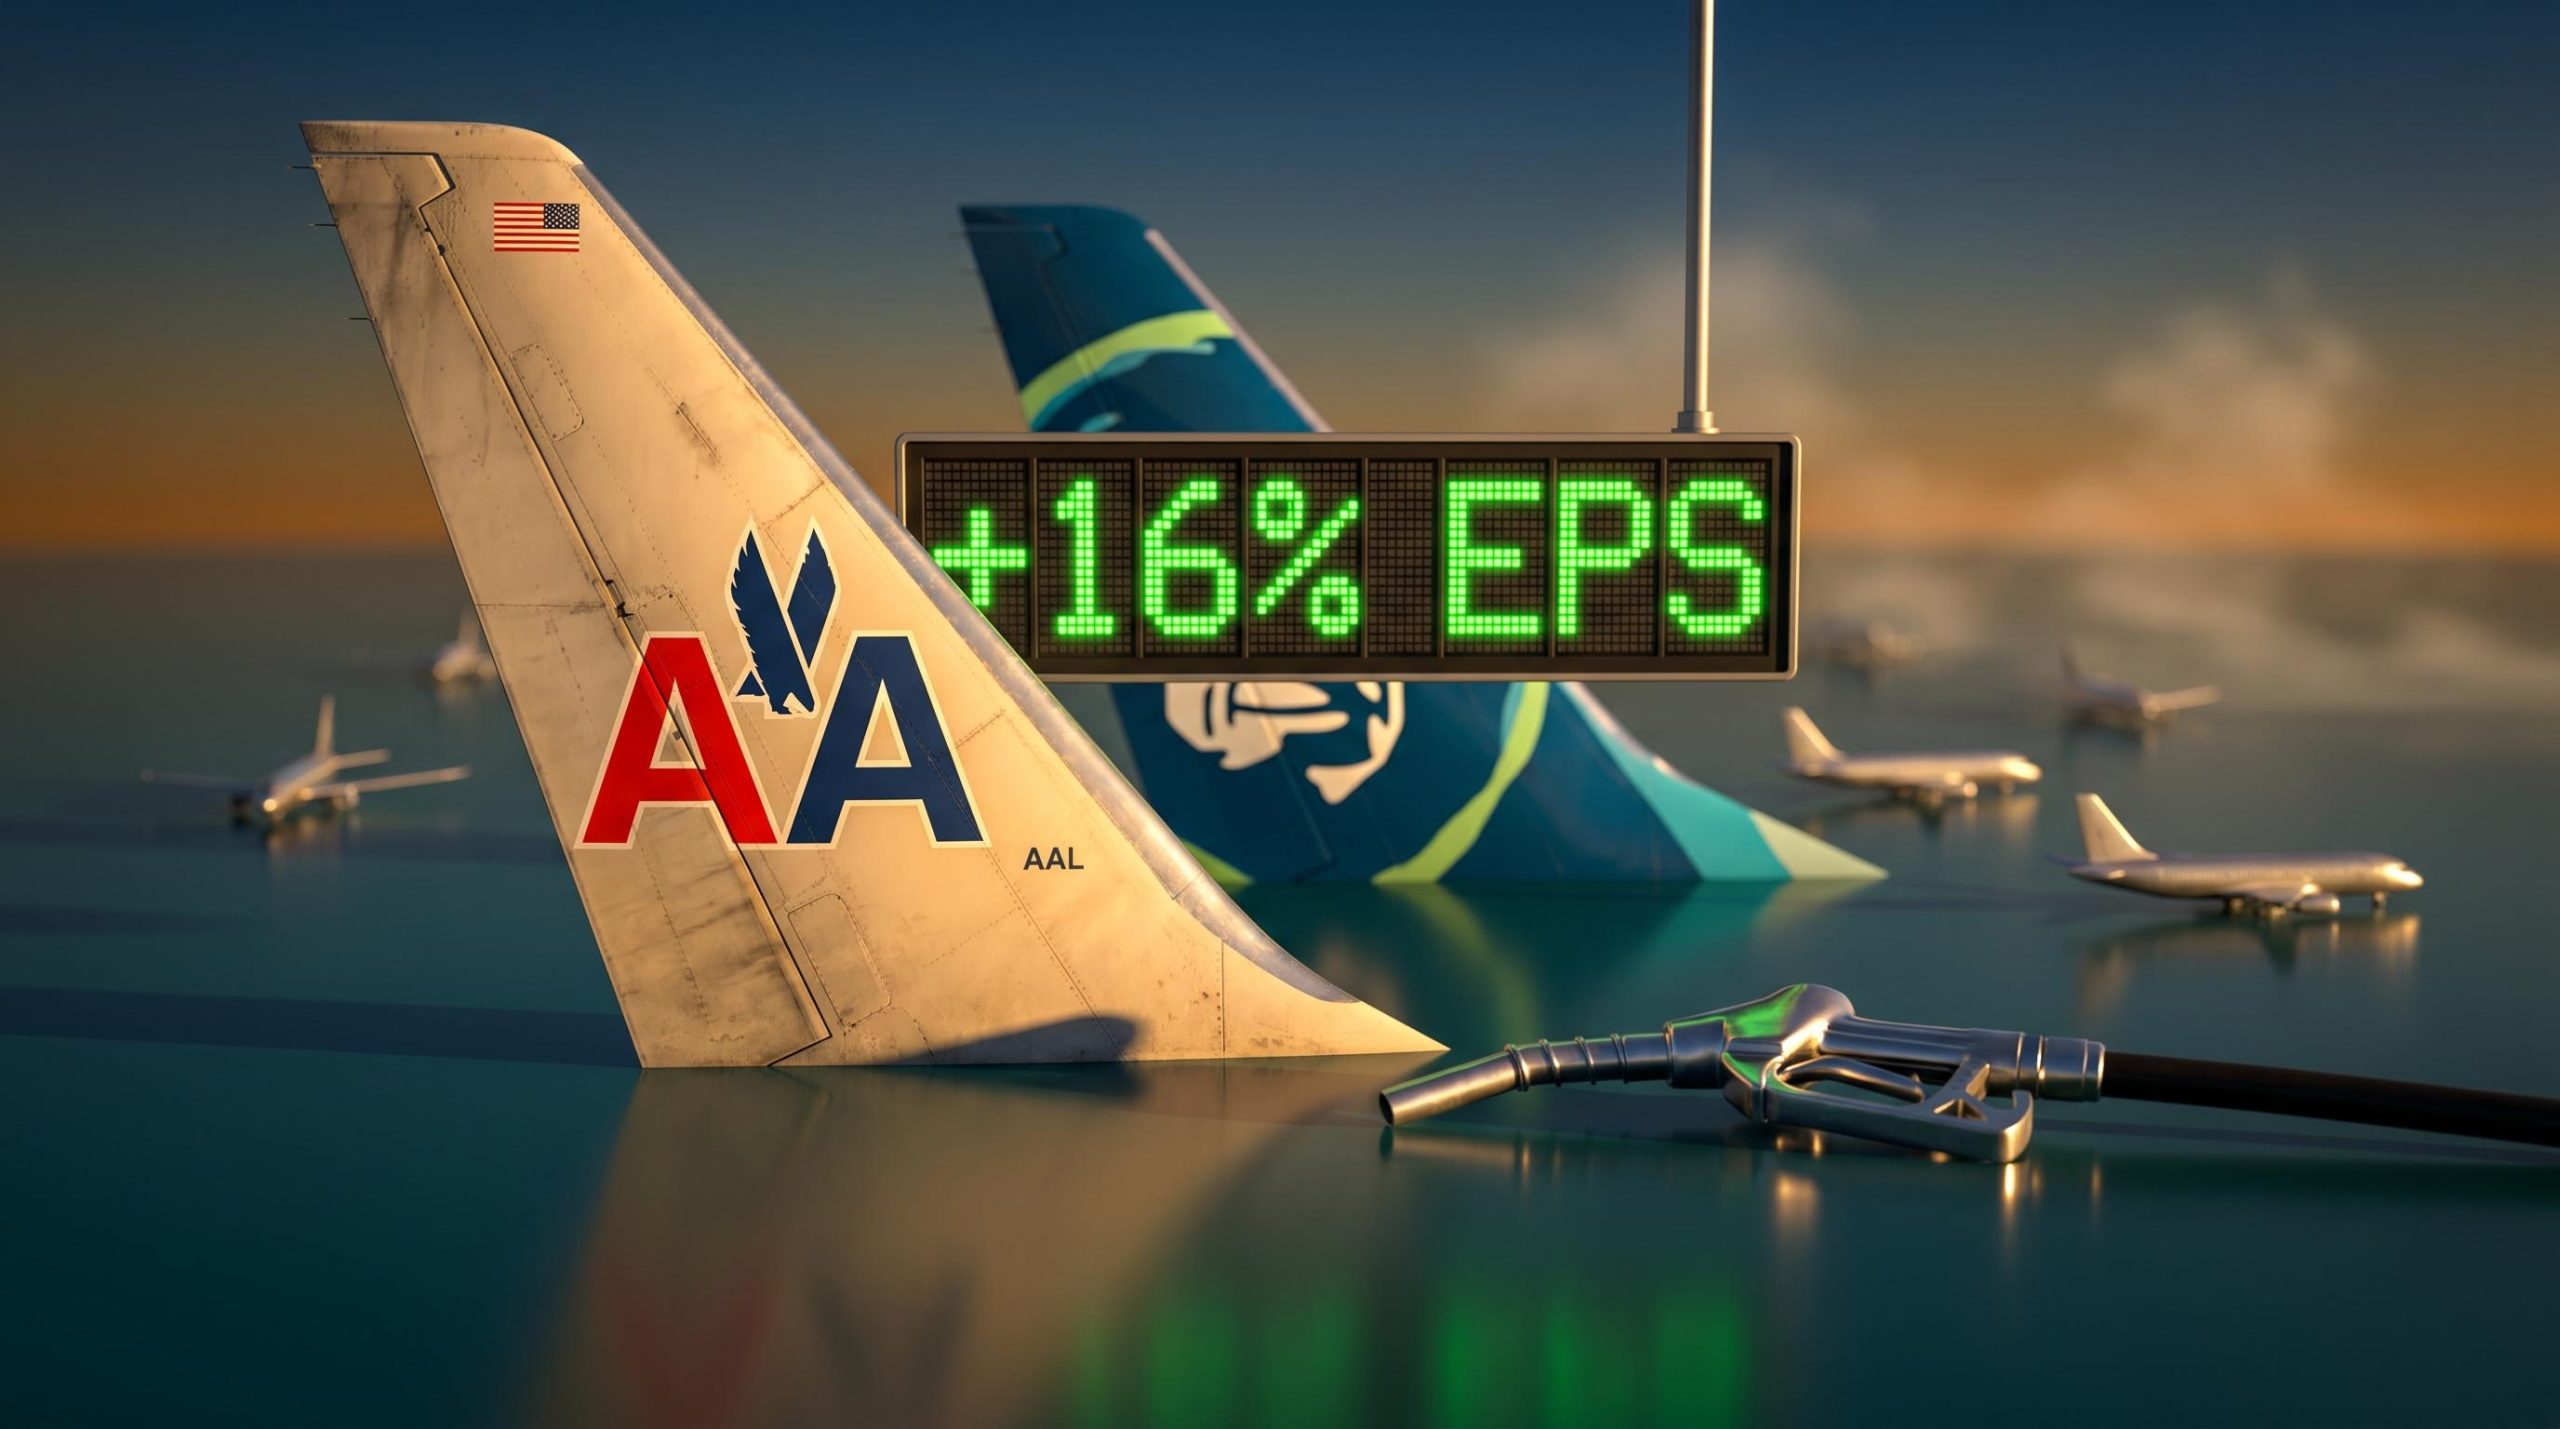
A $0.10 drop in jet fuel prices lifts American Airlines’ projected 2027 earnings per share by roughly 16%. The same move shifts Delta Air Lines’ by approximately 4.5%. For investors positioning around airline stocks and jet fuel prices, that gap between carriers is not a rounding error. It is the entire thesis.
Jet fuel has already fallen approximately 40% from its April 2026 peak, following the easing of Iran-related supply disruptions and the anticipated reopening of the Strait of Hormuz. A broad rally in U.S. airline equities followed, but the sector-level move obscures enormous variation in which carriers actually capture the most earnings leverage from cheaper energy. New data from UBS Global Research, published 21 June 2026 by analysts Atul Maheswari and Thomas Wadewitz, quantifies exactly how much each major U.S. carrier’s earnings respond to fuel price movements, why the sensitivity gap exists, and what it means for stock selection in this environment.
The jet fuel supply crisis that preceded this rally was more acute than headline crude prices suggested: jet fuel tanker loadings collapsed 50% week on week in early May 2026, and ConocoPhillips warned that import-dependent nations could face critical shortfalls as recently as June-July 2026, which explains why the 40% price decline from the April peak carried such significant earnings implications for carriers still rebuilding their forward cost assumptions.
The fuel sensitivity gap hiding inside the airline rally
The U.S. Global Jets ETF (JETS) climbed approximately 12% across a three-session window as the Strait of Hormuz headlines broke. From the outside, the move looked uniform: airlines up, fuel down, trade over.
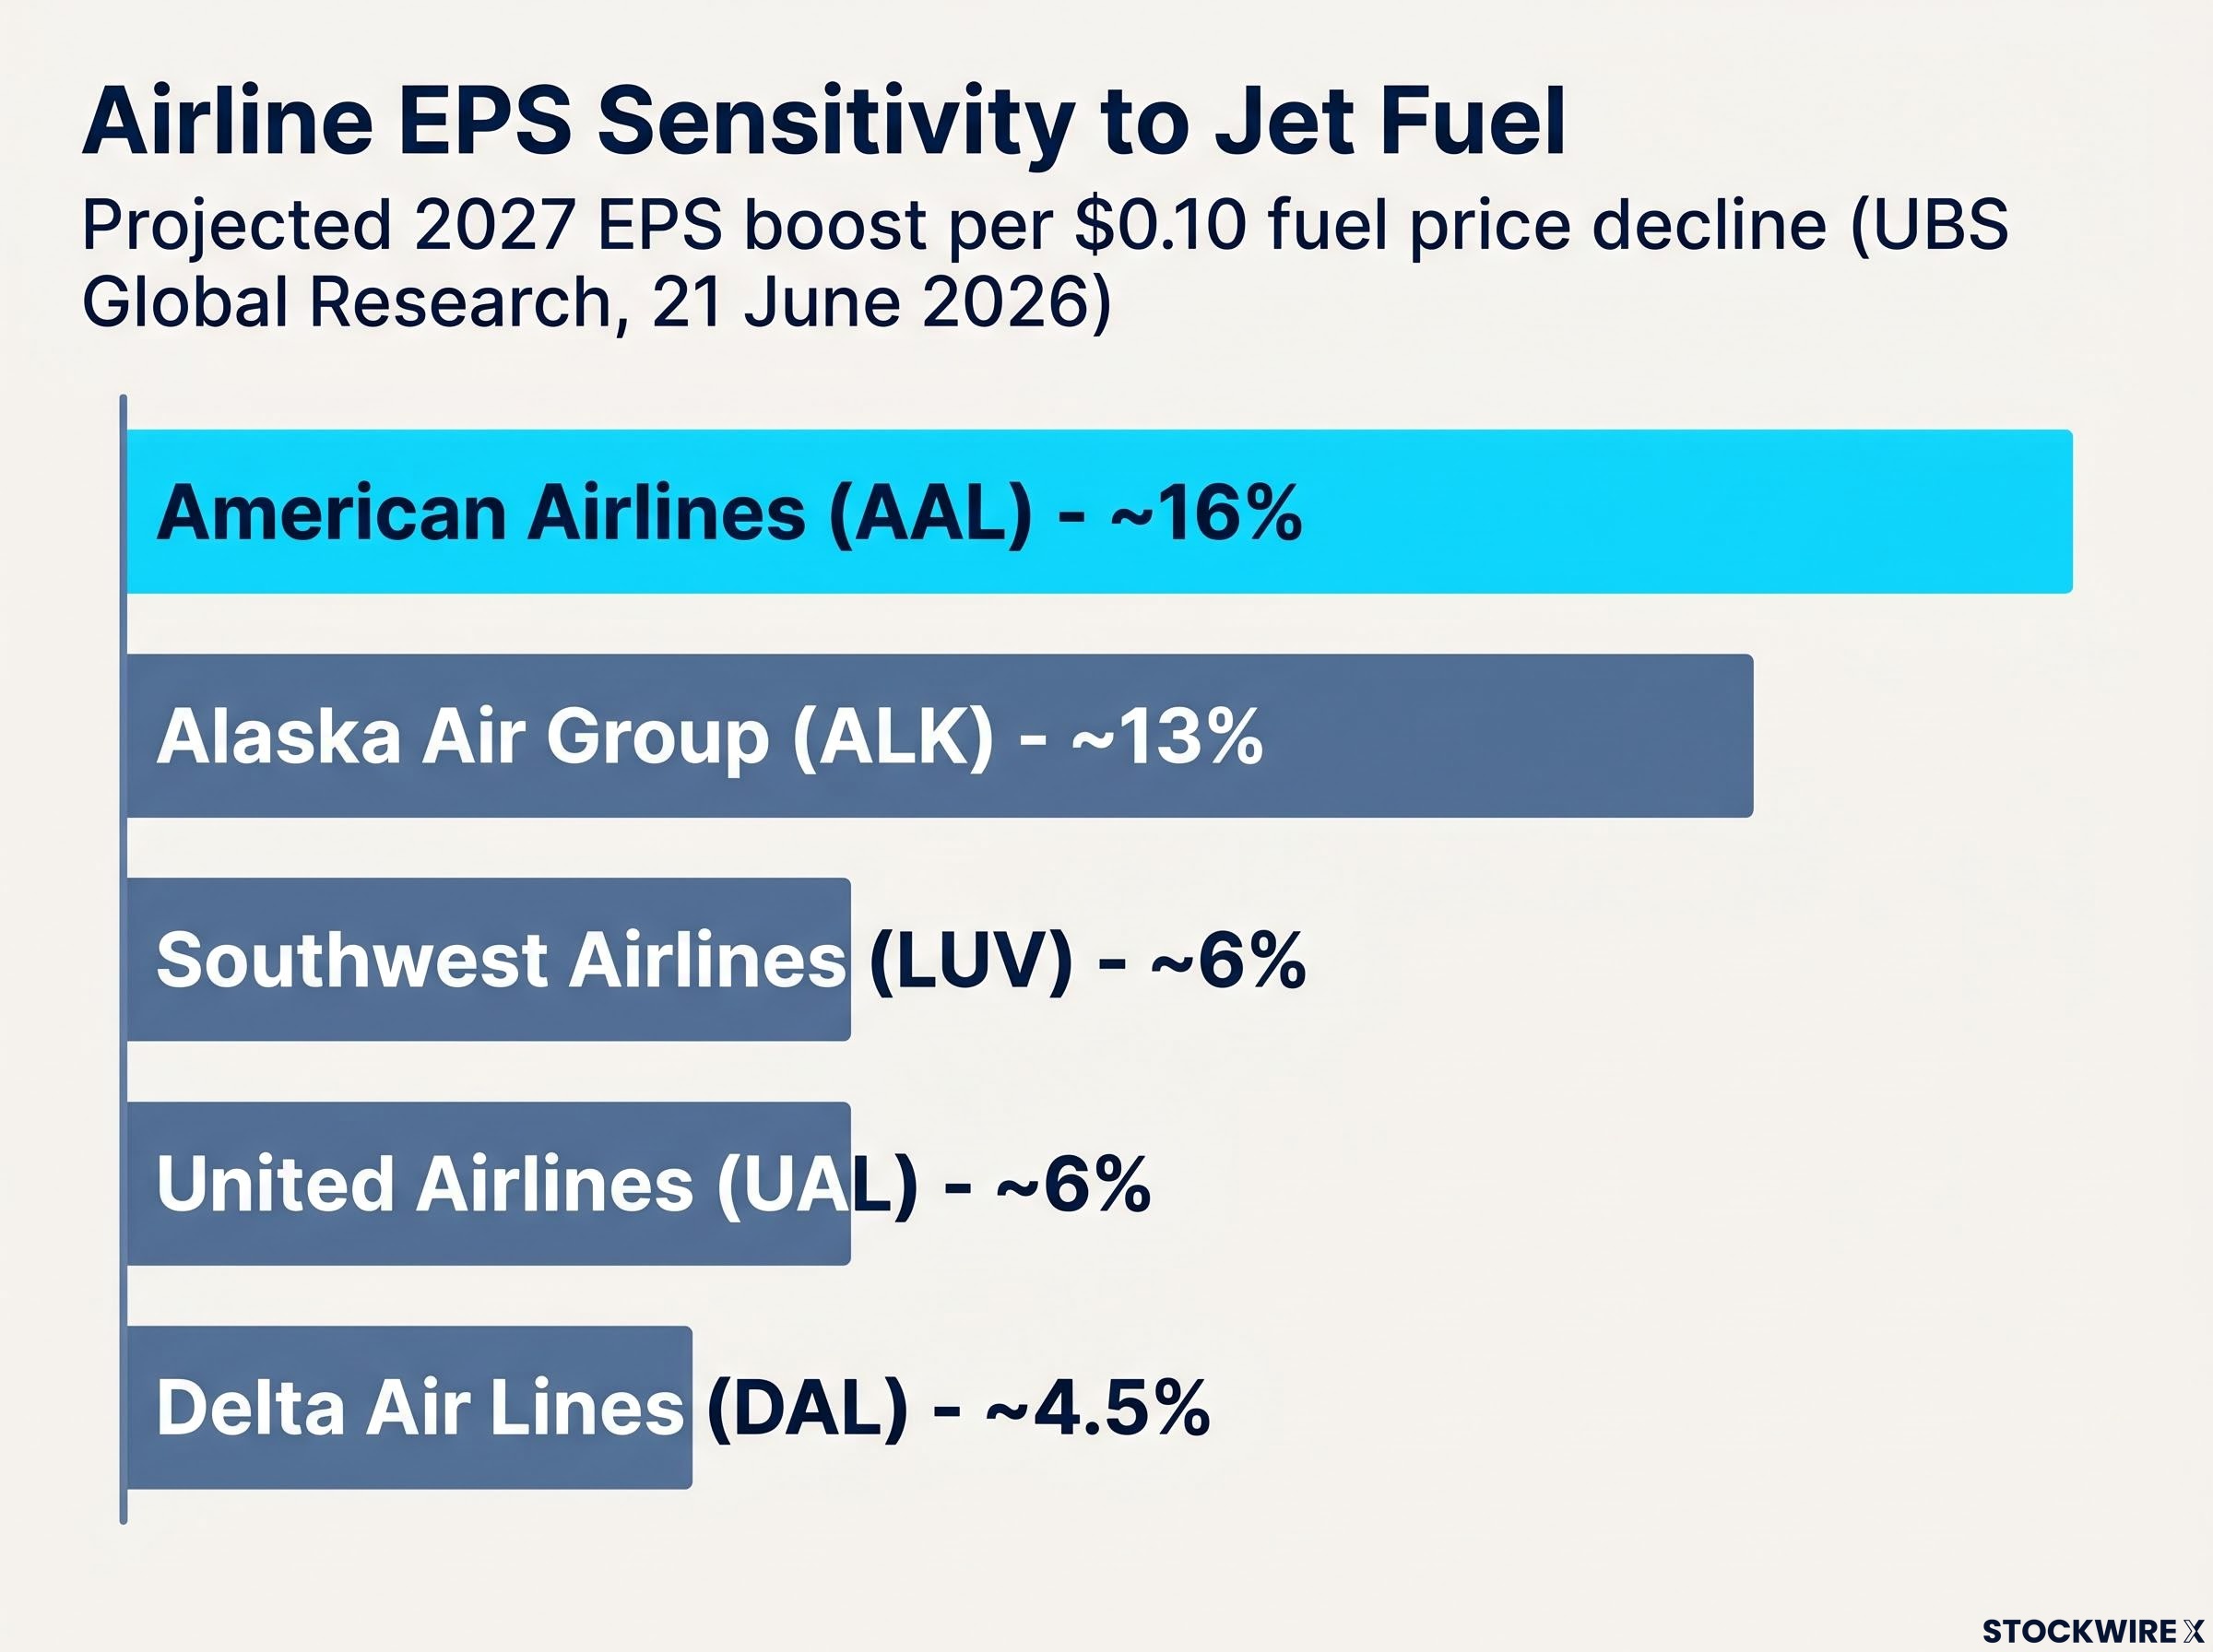
It was not that simple. UBS data published the same week revealed that a single $0.10 per unit decline in jet fuel prices produces wildly different earnings outcomes across the five largest U.S. carriers. At the top of the range, American Airlines (AAL) sees an estimated 16% boost to 2027 EPS. At the bottom, Delta Air Lines (DAL) registers approximately 4.5%.
A $0.10 fuel price decline lifts AAL’s projected 2027 EPS by approximately 16%, compared to roughly 4.5% for DAL. The same macro tailwind produces more than 3x the earnings leverage at one carrier versus another.
That is a threefold spread in earnings sensitivity across names that rallied together. Share prices closed below intraday highs during the same window, a signal that the macro-driven momentum was already plateauing. For investors who bought the broad sector move, the question is no longer whether airlines benefit from cheaper fuel. It is which airlines benefit enough to justify the position.
When big ASX news breaks, our subscribers know first
How much each carrier’s earnings move when fuel prices shift
The full UBS ranking, based on 2027 earnings projections, puts the five major carriers into a clear hierarchy. The numbers reflect estimated EPS percentage change per $0.10 decline in jet fuel prices.
| Carrier | Ticker | EPS Boost per $0.10 Fuel Decline | UBS Classification | Best Suited For |
|---|---|---|---|---|
| American Airlines | AAL | ~16% | High torque | Strong directional fuel view |
| Alaska Air Group | ALK | ~13% | High torque | Fuel thesis + integration upside |
| Southwest Airlines | LUV | ~6% | Moderate | Balanced sector exposure |
| United Airlines | UAL | ~6% | Moderate | Balanced sector exposure |
| Delta Air Lines | DAL | ~4.5% | Lower torque | Earnings stability priority |
Two bracket observations stand out from the data:
- The high-torque pair (AAL and ALK) sit meaningfully above the rest of the group, offering more than double the EPS leverage of the next closest carrier. These are the names that convert a fuel thesis into concentrated earnings movement.
- The lower-torque group (DAL, UAL, LUV) clusters between 4.5% and 6%, offering more muted, more stable exposure. The earnings impact from cheaper fuel is real but diluted across a wider earnings base.
All figures are 2027 projections based on UBS modelling, published 21 June 2026. They represent forward-looking estimates, not realised outcomes.
Why do fuel price drops hit some airlines so much harder?
The ranking above is not arbitrary. Four structural factors drive the variation, and understanding them turns a static table into a dynamic monitoring tool.
Cost structure and hedging
- Fuel as a percentage of total operating costs. Airlines where fuel represents a larger share of expenses experience a bigger earnings swing when prices move. Leaner non-fuel cost structures make fuel a larger lever on the profit and loss statement.
- Hedging strategy. Carriers that actively hedge fuel purchases lock in prices ahead of time, which limits their exposure to spot market moves in both directions. Delta has historically maintained a more active hedge book, contributing directly to its lower 4.5% near-term sensitivity figure. When spot prices fall, hedged carriers capture less of that benefit because their locked-in contracts override the lower market rate.
Fuel’s share of airline operating costs averaged approximately 25.5% of total operational expenses for North American carriers in 2024, a proportion large enough that even modest per-unit price movements translate into material earnings swings at carriers where non-fuel costs are relatively lean.
Margin structure and fleet efficiency
- Operating leverage and margins. This is where the gap between AAL and DAL becomes structural rather than incidental. A lower-margin, more financially leveraged carrier like American Airlines sees a larger percentage EPS change from the same dollar amount of cost savings, because those savings are spread across a smaller earnings base. Higher-margin carriers absorb the same dollar benefit into a bigger denominator, reducing the percentage impact.
- Fleet age and fuel efficiency. Older, less fuel-efficient fleets burn more fuel per available seat mile, magnifying the earnings impact of price changes in either direction. Alaska Air’s focused network and its ongoing Hawaiian Airlines integration could layer additional cost synergies on top of any fuel tailwind, further amplifying the earnings response.
These mechanics mean the sensitivity ranking is not fixed. If a carrier restructures its hedge book, improves its margins, or modernises its fleet, the numbers shift. Investors tracking the fuel thesis should monitor these inputs, not just the fuel price itself.
Fuel costs are already sorting airline stocks by revenue quality at the carrier level, with Delta’s Monroe Energy refinery delivering an estimated $300 million in Q2 2026 cost offsets while ultra-low-cost carriers face the same price moves with no structural buffer to absorb them.
ETF exposure versus single-name targeting: which is the cleaner fuel trade?
The choice between JETS and individual airline stocks is a genuine trade-off, not a quality judgement.
JETS ETF: when to consider it
- Captures broad airline sector exposure without requiring a view on individual carrier fundamentals
- Appropriate for investors who believe airlines broadly benefit from cheaper fuel but lack conviction on which names benefit most
- Simpler to manage as a single position
Single-name picks: when to consider them
- Avoids diluting high-torque exposure with lower-sensitivity holdings within the same vehicle
- Allows precise alignment between a fuel price thesis and the carrier most leveraged to it
- Permits layering of additional catalysts (such as ALK’s Hawaiian Airlines integration) on top of the fuel story
UBS identified AAL and ALK as the preferred names for investors seeking direct exposure to falling jet fuel prices, given their meaningfully higher EPS sensitivity relative to the rest of the group.
The underlying issue is structural: owning JETS captures AAL and ALK but simultaneously blends that exposure with DAL, UAL, and LUV. For investors with a strong directional fuel view, the ETF effectively averages out the thesis they are trying to express.
For investors who want to work through the broader trade-off before applying it to the airline sector, our comprehensive walkthrough of stocks versus ETFs covers concentration risk, expense ratio compounding, tax treatment, and the core-and-satellite framework that many investors use to balance targeted single-name exposure with diversified index holdings.
The risk hiding in high sensitivity: what happens if fuel prices reverse?
Fuel sensitivity is symmetric. The same structural attributes that generate AAL’s approximately 16% EPS boost from a $0.10 fuel price decline produce an approximately equivalent 16% EPS headwind if fuel prices rise by the same amount.
The same leverage that creates the 16% upside also creates the 16% downside. High fuel sensitivity is a magnifier, not a directional guarantee.
The geopolitical shock across US equities from the Hormuz closure was not uniform even within the aviation sector: JetBlue reported a Q1 net loss as high fuel costs compressed margins, while discount retailers benefited from consumer trading-down behaviour, revealing that the same energy price event created fundamentally different outcomes depending on a company’s cost structure and demand sensitivity.
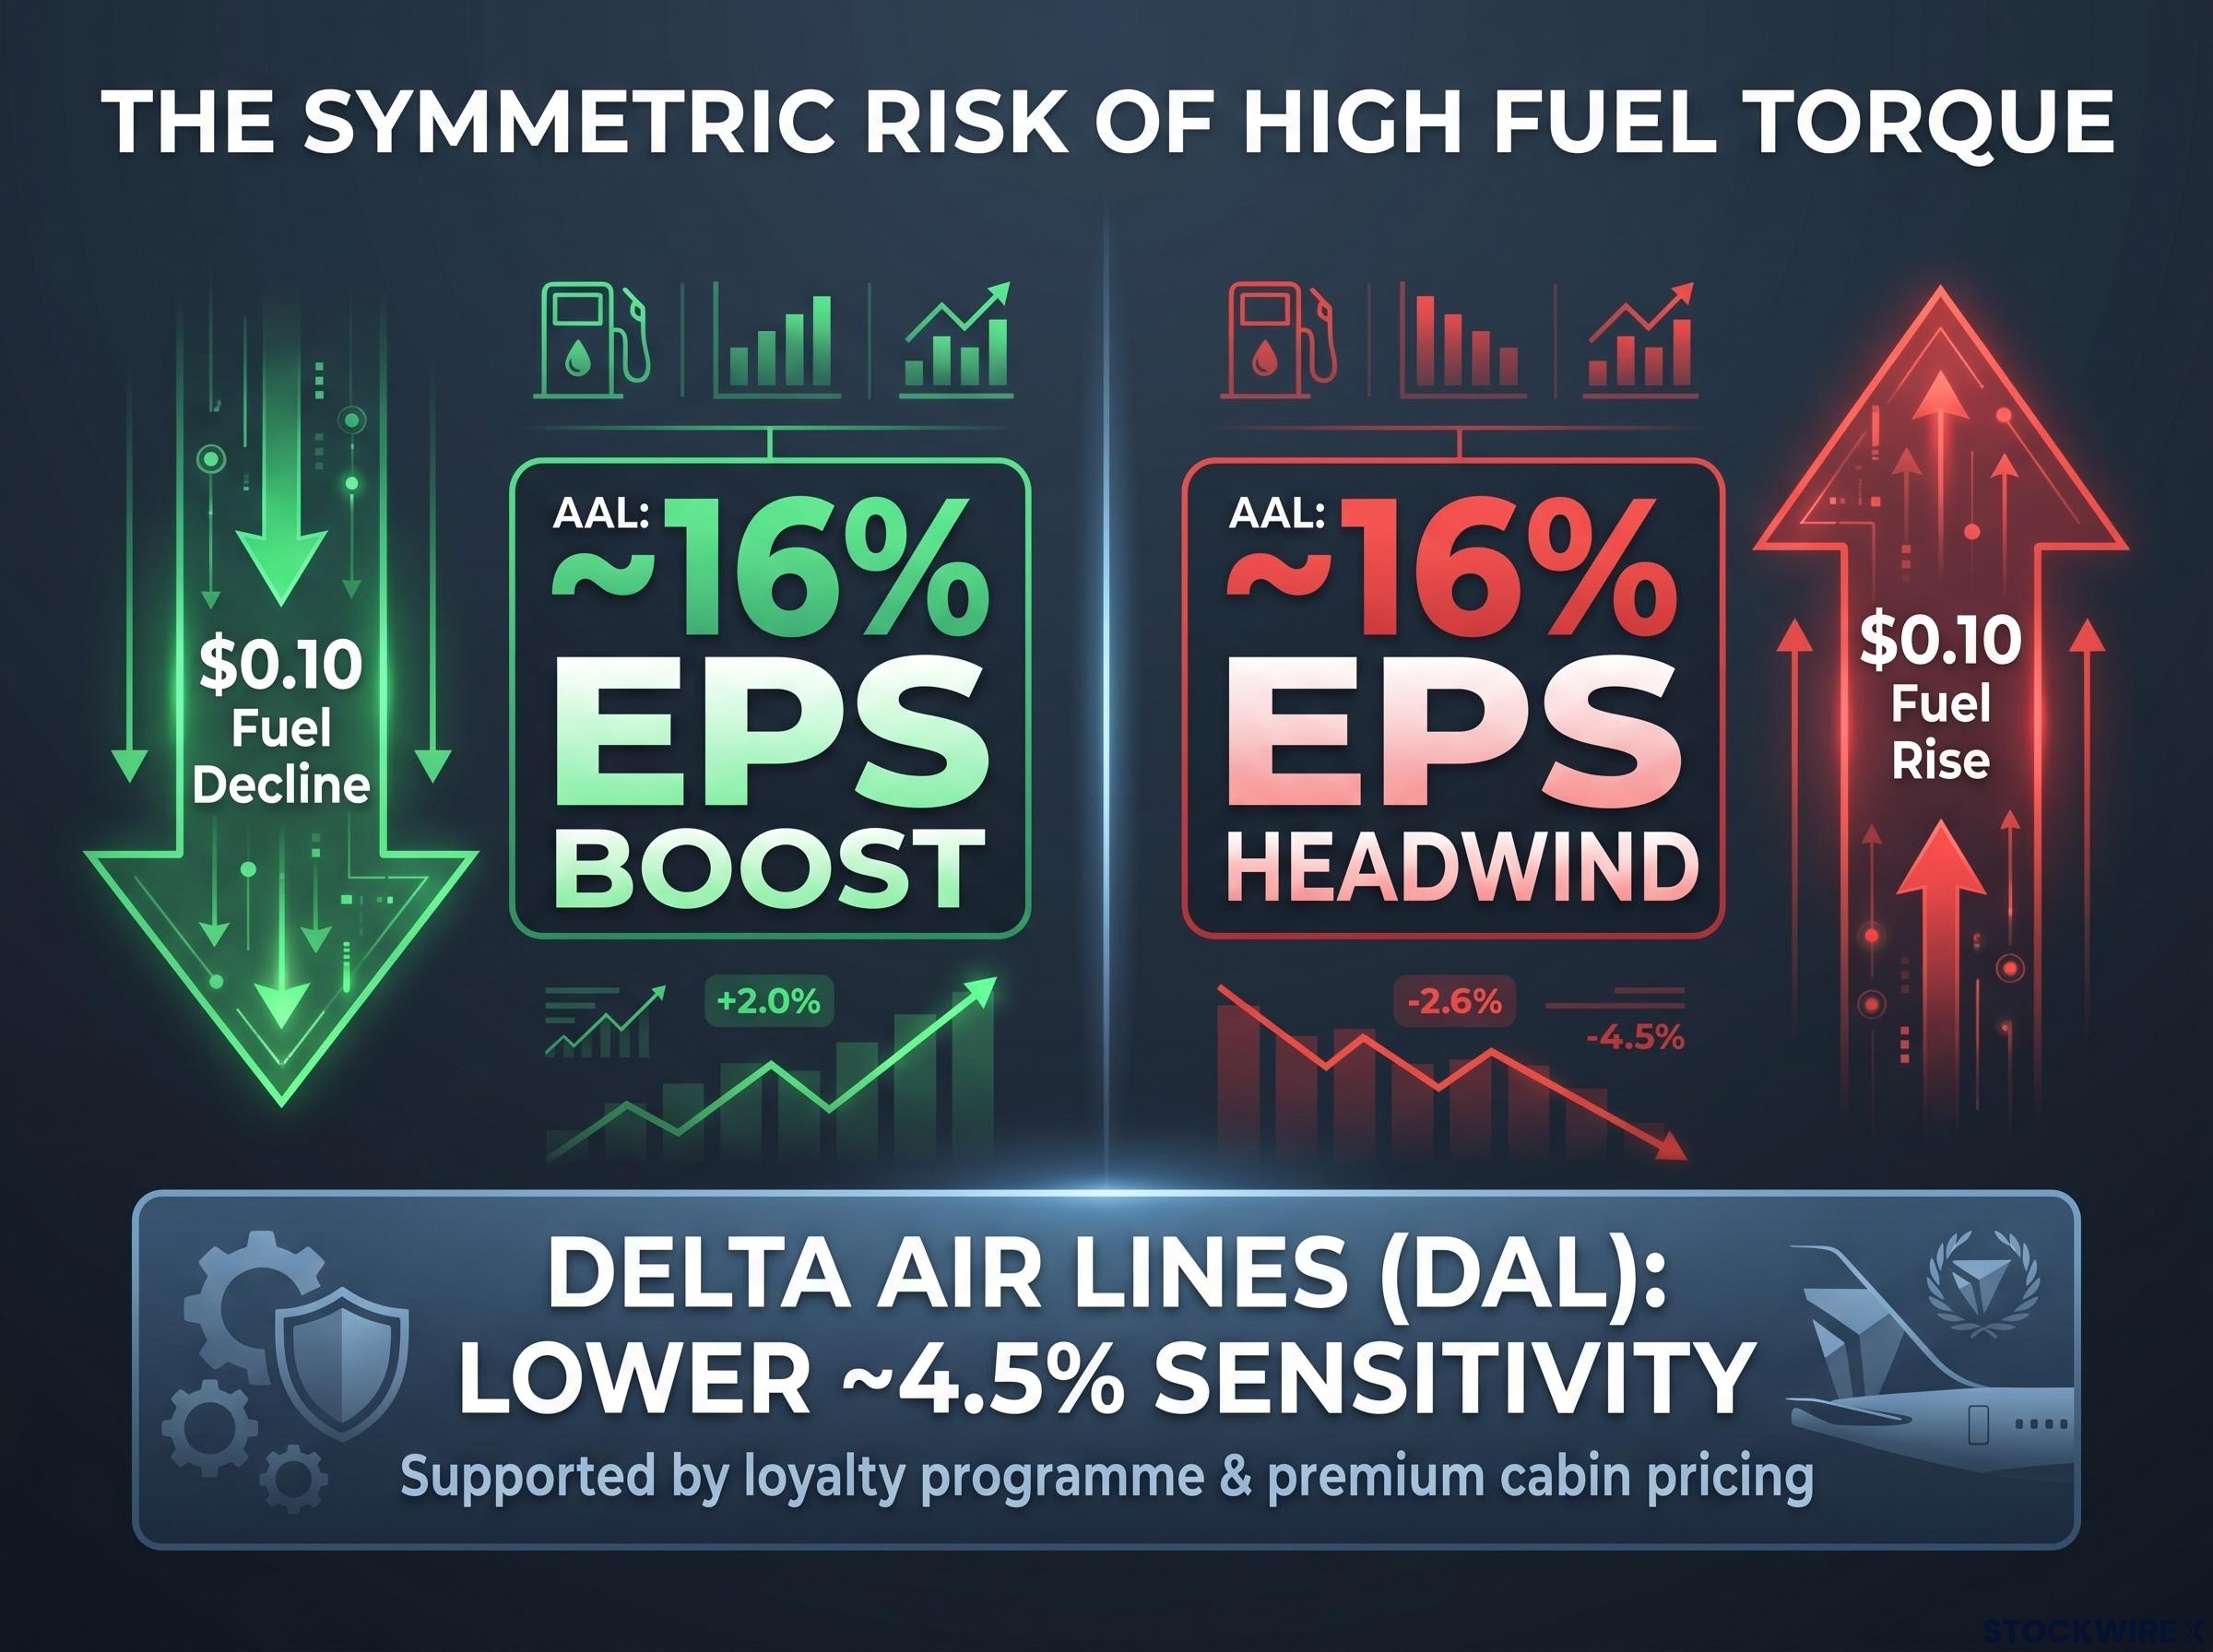
Delta’s lower sensitivity, by contrast, reflects a more diversified earnings profile. Its loyalty programme contribution and premium cabin pricing mix provide revenue streams that are less correlated with fuel costs, creating a more stable earnings floor regardless of where energy prices move.
The fuel story also does not exist in isolation. UBS noted that upward EPS revisions across the sector require not just lower fuel costs but stable passenger demand and controlled labour cost trajectories. Labour cost pressures and potential macroeconomic deceleration remain live risks underneath the fuel thesis, and cheaper energy alone does not resolve them.
Investors entering high-sensitivity names purely on the fuel trade should size positions with the symmetric downside in view. The same structural leverage that makes AAL the most attractive carrier in a falling fuel environment makes it the most exposed if that environment reverses.
Past performance does not guarantee future results. Financial projections are subject to market conditions and various risk factors.
What to watch before the next airline re-rating
The fuel sensitivity ranking provides a framework for stock selection, but the next meaningful move in airline equities depends on three forward catalysts.
- Q2 2026 earnings reports and hedge disclosures. Fuel line items and forward commentary on 2026-2027 hedge books will update these sensitivity figures in real time. A carrier shifting toward heavier hedging would reduce its forward sensitivity ranking, altering the investment case.
- Demand trend indicators. Passenger load factors, revenue per available seat mile, and forward booking data will signal whether the demand side of the earnings equation is holding or softening.
- Labour cost trajectory. Airline labour contracts and cost inflation remain a variable that cheaper fuel cannot offset. UBS identified manageable labour costs as one of three conditions required for the next round of upward EPS revisions.
Macro-driven rally momentum has already plateaued, as evidenced by share prices closing below intraday highs. The sector is now in a fundamentals-driven phase where the next leg of appreciation requires actual earnings revision, not another headline catalyst.
Positioning with the fuel trade in a consolidating sector
AAL and ALK offer the highest earnings torque to falling jet fuel prices among major U.S. carriers, but that leverage is a double-edged input. It rewards a correct directional fuel view and penalises an incorrect one by the same magnitude.
The positioning framework that emerges from the UBS data is straightforward: align fuel conviction with carrier selection, treat JETS as a blended alternative for lower-conviction positions, and use Q2 2026 earnings as the next calibration point. The sector has moved past the macro-driven phase. What separates the carriers from here is structural fuel sensitivity, earnings quality, and the specific fundamentals that each name reports in the coming quarter.
This article is for informational purposes only and should not be considered financial advice. Investors should conduct their own research and consult with financial professionals before making investment decisions.