
Three ASX companies sit at the top of the Week 29 rising shorts table with short interest between 4.66% and 10.21%. One of them just rallied 34%. Another fell 38% before bouncing 9.1%. A third is being used as a proxy bet on the Australian weather cycle.
In each case, the story the short sellers are telling is different from the one visible in the price chart.
Rising short interest data from ASIC-aligned reports is published weekly and largely ignored by retail investors who treat it as noise or as a simple bearish signal. That misreading leaves useful information on the table. The Week 29 data, covering 29 June to 6 July 2026, illustrates the range of theses that can drive short positioning simultaneously: valuation scepticism, macro climate risk, and operational disappointment. Each demands a different analytical response.
Here is a practical lens for reading ASX short selling data across three contrasting real-world cases, so you can identify what question the bears are actually asking, and decide whether you find the answer convincing.
What rising short interest actually tells you (and what it does not)
Short interest measures the percentage of a company’s shares outstanding that have been borrowed and sold by traders who expect to buy them back later at a lower price. When short interest rises, it means bearish exposure is accumulating: more investors are actively positioning for a decline.
The underlying figures cited throughout this analysis rely on the integrity of the reporting framework itself, and ASIC short reporting rules require all on-market short sales to be disclosed regardless of size, making Australia’s regime more transaction-granular than equivalent US or UK systems.
That accumulation does not guarantee a decline will follow. Short sellers carry three limitations worth remembering:
- They can be wrong about the thesis entirely
- They can be right but early, absorbing losses while waiting for the thesis to play out
- Some short positions are hedges attached to other trades, not directional bets at all
The underlying figures cited throughout this analysis are drawn from Kerry Sun’s Market Index Short Seller Series for Week 29, which aligns with ASIC short position reporting. The dataset spans two comparison windows: week-on-week (29 June to 6 July 2026) and month-on-month (5 June to 6 July 2026).
The monthly trend is the signal that matters most. Weekly moves can be driven by short-term flows, index rebalancing, or temporary borrowing. When short interest builds meaningfully over a full month, and particularly when that build diverges from the price action, it almost always reflects a deliberate thesis worth examining.
When big ASX news breaks, our subscribers know first
Cochlear’s record short interest stacks up against a 34% rally
Short interest in Cochlear has climbed to 9.76% of shares outstanding, the highest level on record. The monthly build reached +4.86 percentage points, with the most recent week contributing an additional +0.80 pp.
The share price advanced 34% across the period from 3 June to 6 July 2026.
Cochlear’s earnings downgrade cycle, which included a 35-37% FY26 profit guidance cut and sent the share price down roughly 62.7% from its 2025 peak, provides the backdrop against which the current 34% rally and record short interest become much easier to interpret.
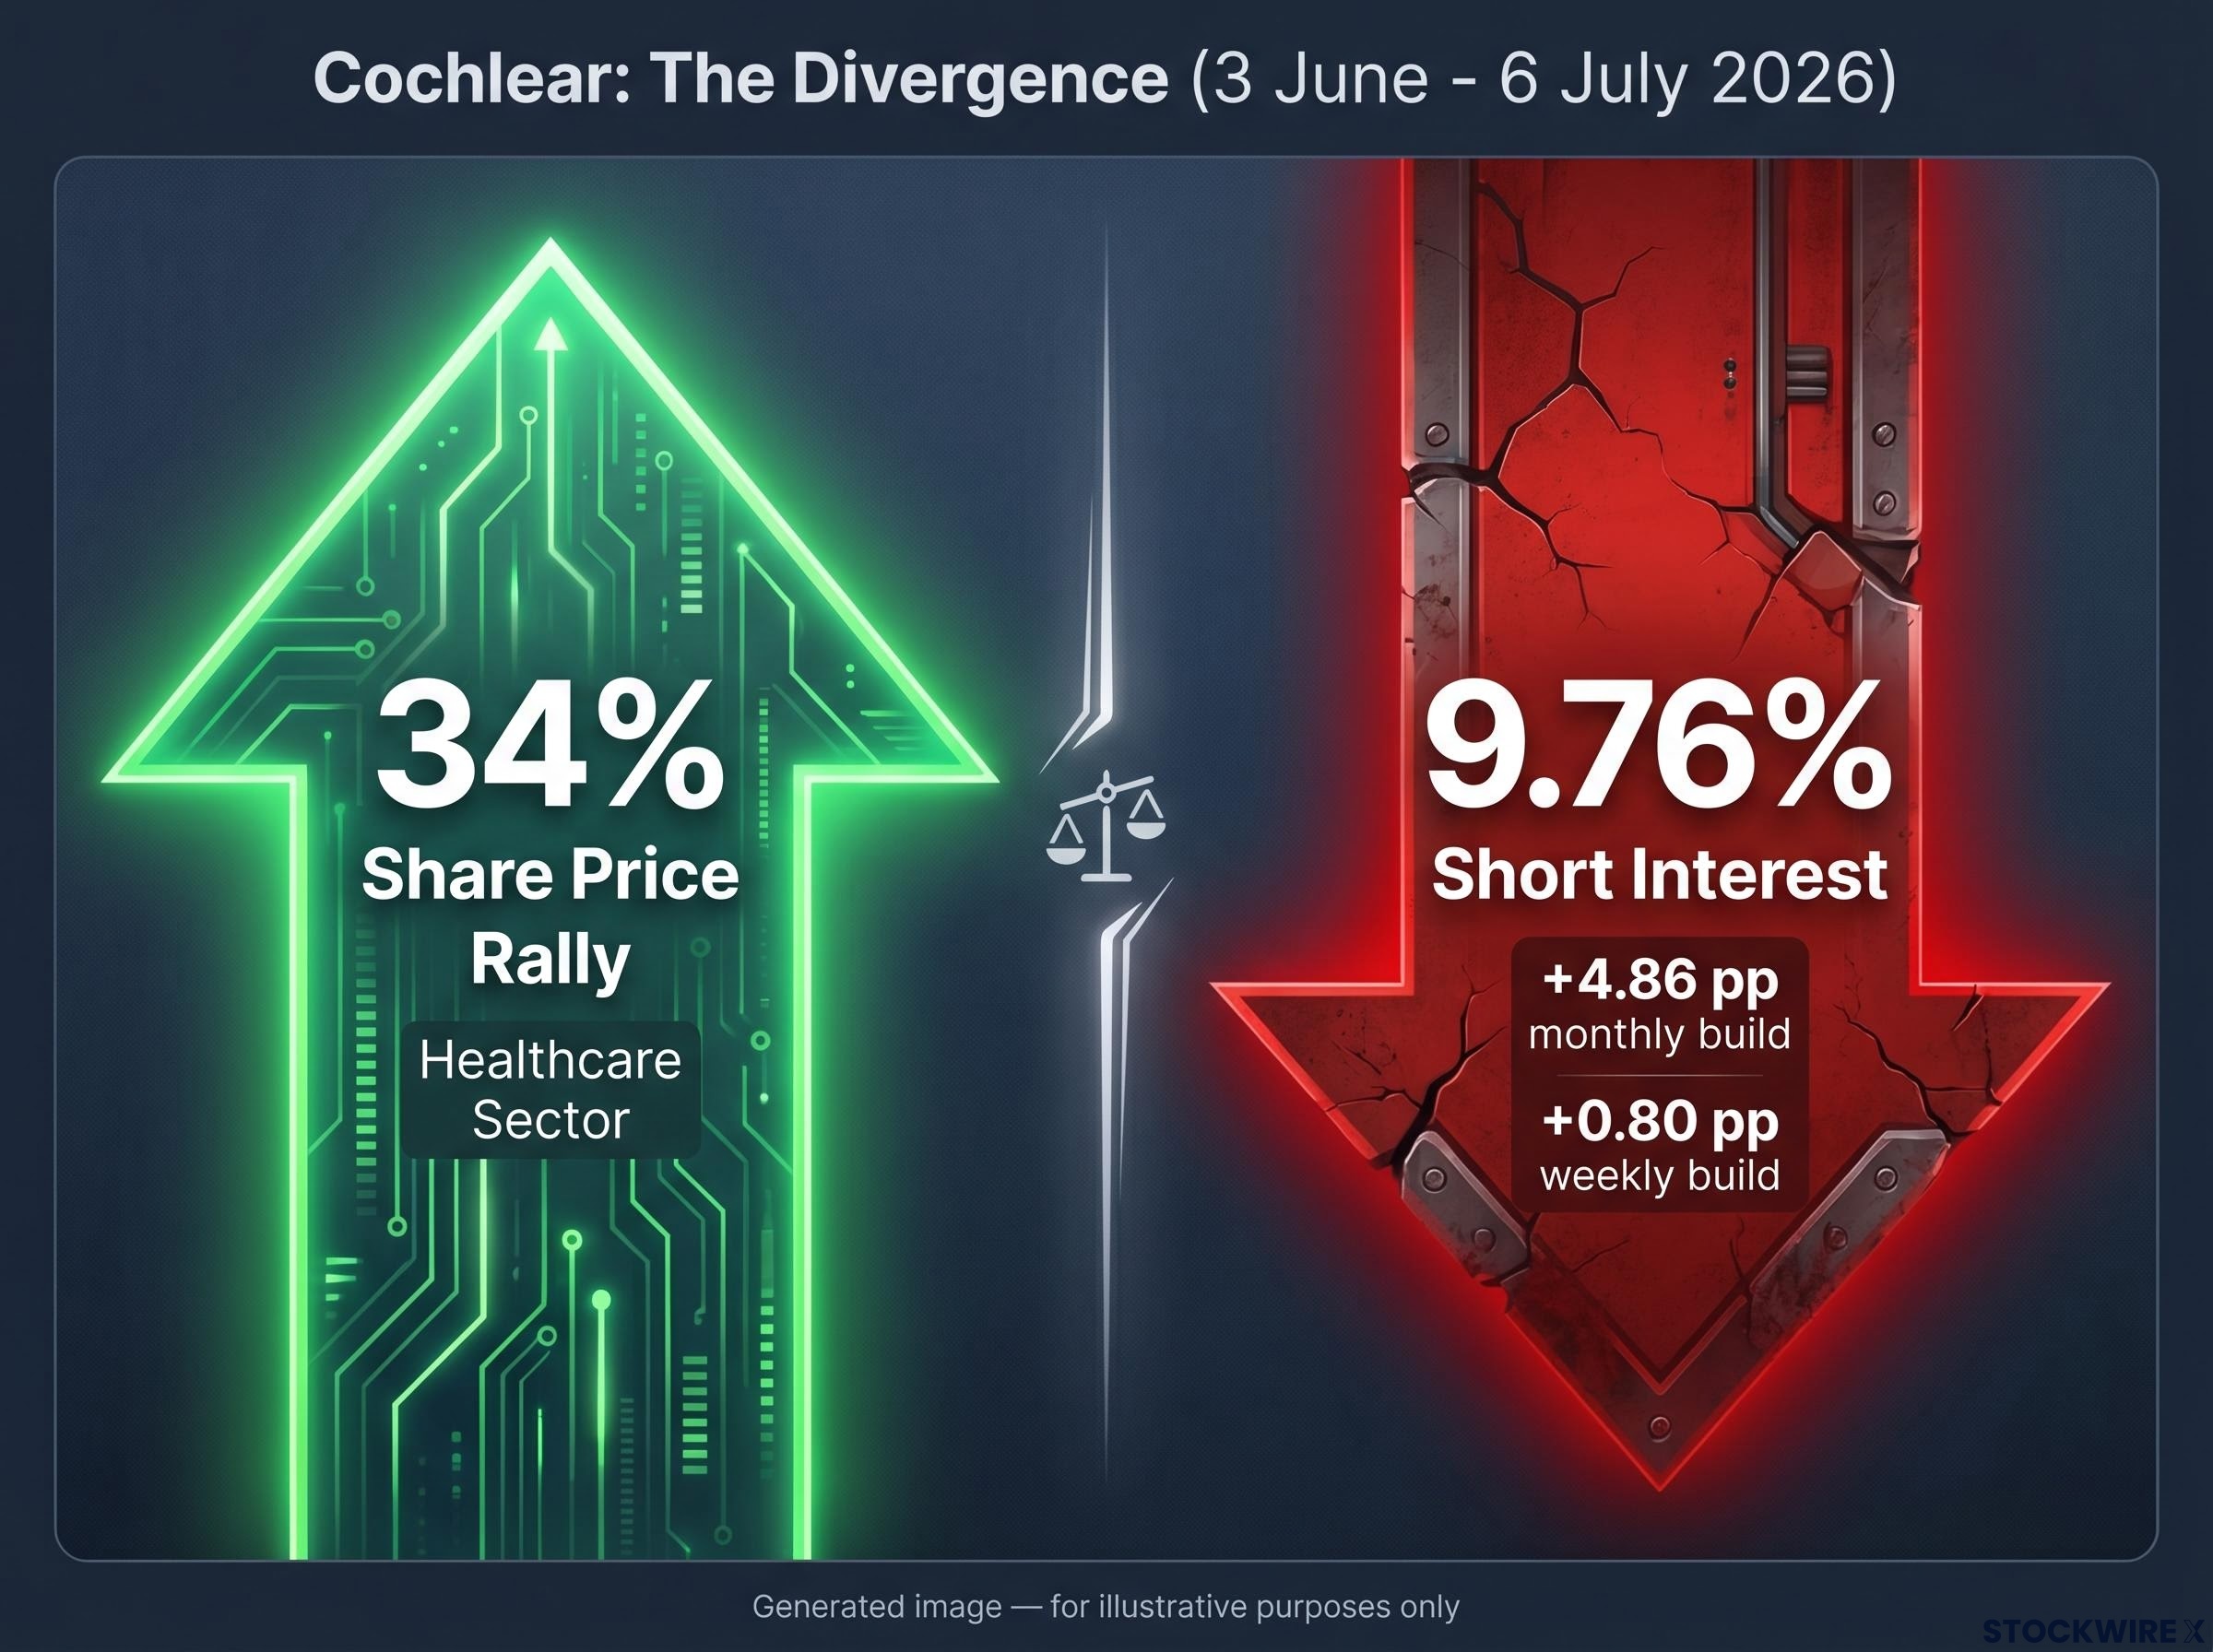
That combination is a genuine puzzle. Bulls and bears are not mildly disagreeing; they are taking large, opposing positions at the same time. Three explanations carry the most analytical weight:
- Valuation mean reversion: A 34% move in under five weeks is extraordinary for a large-cap healthcare stock. If it has pushed the valuation significantly above historical norms, value-driven shorts may be betting on reversion rather than an immediate collapse.
- Sector momentum overshoot: Healthcare equities broadly recovered ground during this period. Sceptical short sellers who doubt the durability of that trade may be using Cochlear as their vehicle because it is liquid and can support meaningful position size.
- Squeeze risk from elevated absolute short interest: At 9.76%, nearly one in ten shares is held by investors who must eventually repurchase, creating a potential forced-buying reservoir if a positive catalyst arrives.
At 9.76% short interest, nearly one in ten Cochlear shares must be repurchased at some point. If the bullish narrative continues to be validated, that creates a meaningful reservoir of forced buying that could accelerate further gains.
The +4.86 pp monthly build is the figure to focus on. That pace of accumulation signals deliberate, staged position-building, not tactical noise. For anyone holding Cochlear long, this is not simply a bearish counter-signal. It is confirmation that well-resourced investors have built a high-conviction case that the stock has overshot, and that case deserves explicit examination before adding to or holding the position.
Elders and the El Nino weather trade in agricultural services
Elders carries the highest short interest on the rising shorts table at 10.21% of shares outstanding. Its weekly increase of +1.01 pp was the largest single-week jump in the entire dataset. The monthly build was more gradual at +0.69 pp.
The bears here are not primarily questioning company execution. Their positioning reflects concern about the prospect of a severe “super” El Nino event. El Nino typically brings drier-than-average conditions to eastern and southern Australia, the regions where Elders generates most of its revenue across four weather-sensitive business lines:
- Farm inputs and supplies
- Livestock and agency services
- Rural real estate
- Financial and advisory products
Dry conditions reduce planting and lower input demand. Smaller herds reduce livestock turnover. Tougher conditions suppress property transactions. The compression can hit revenue and margins across multiple years in a severe event.
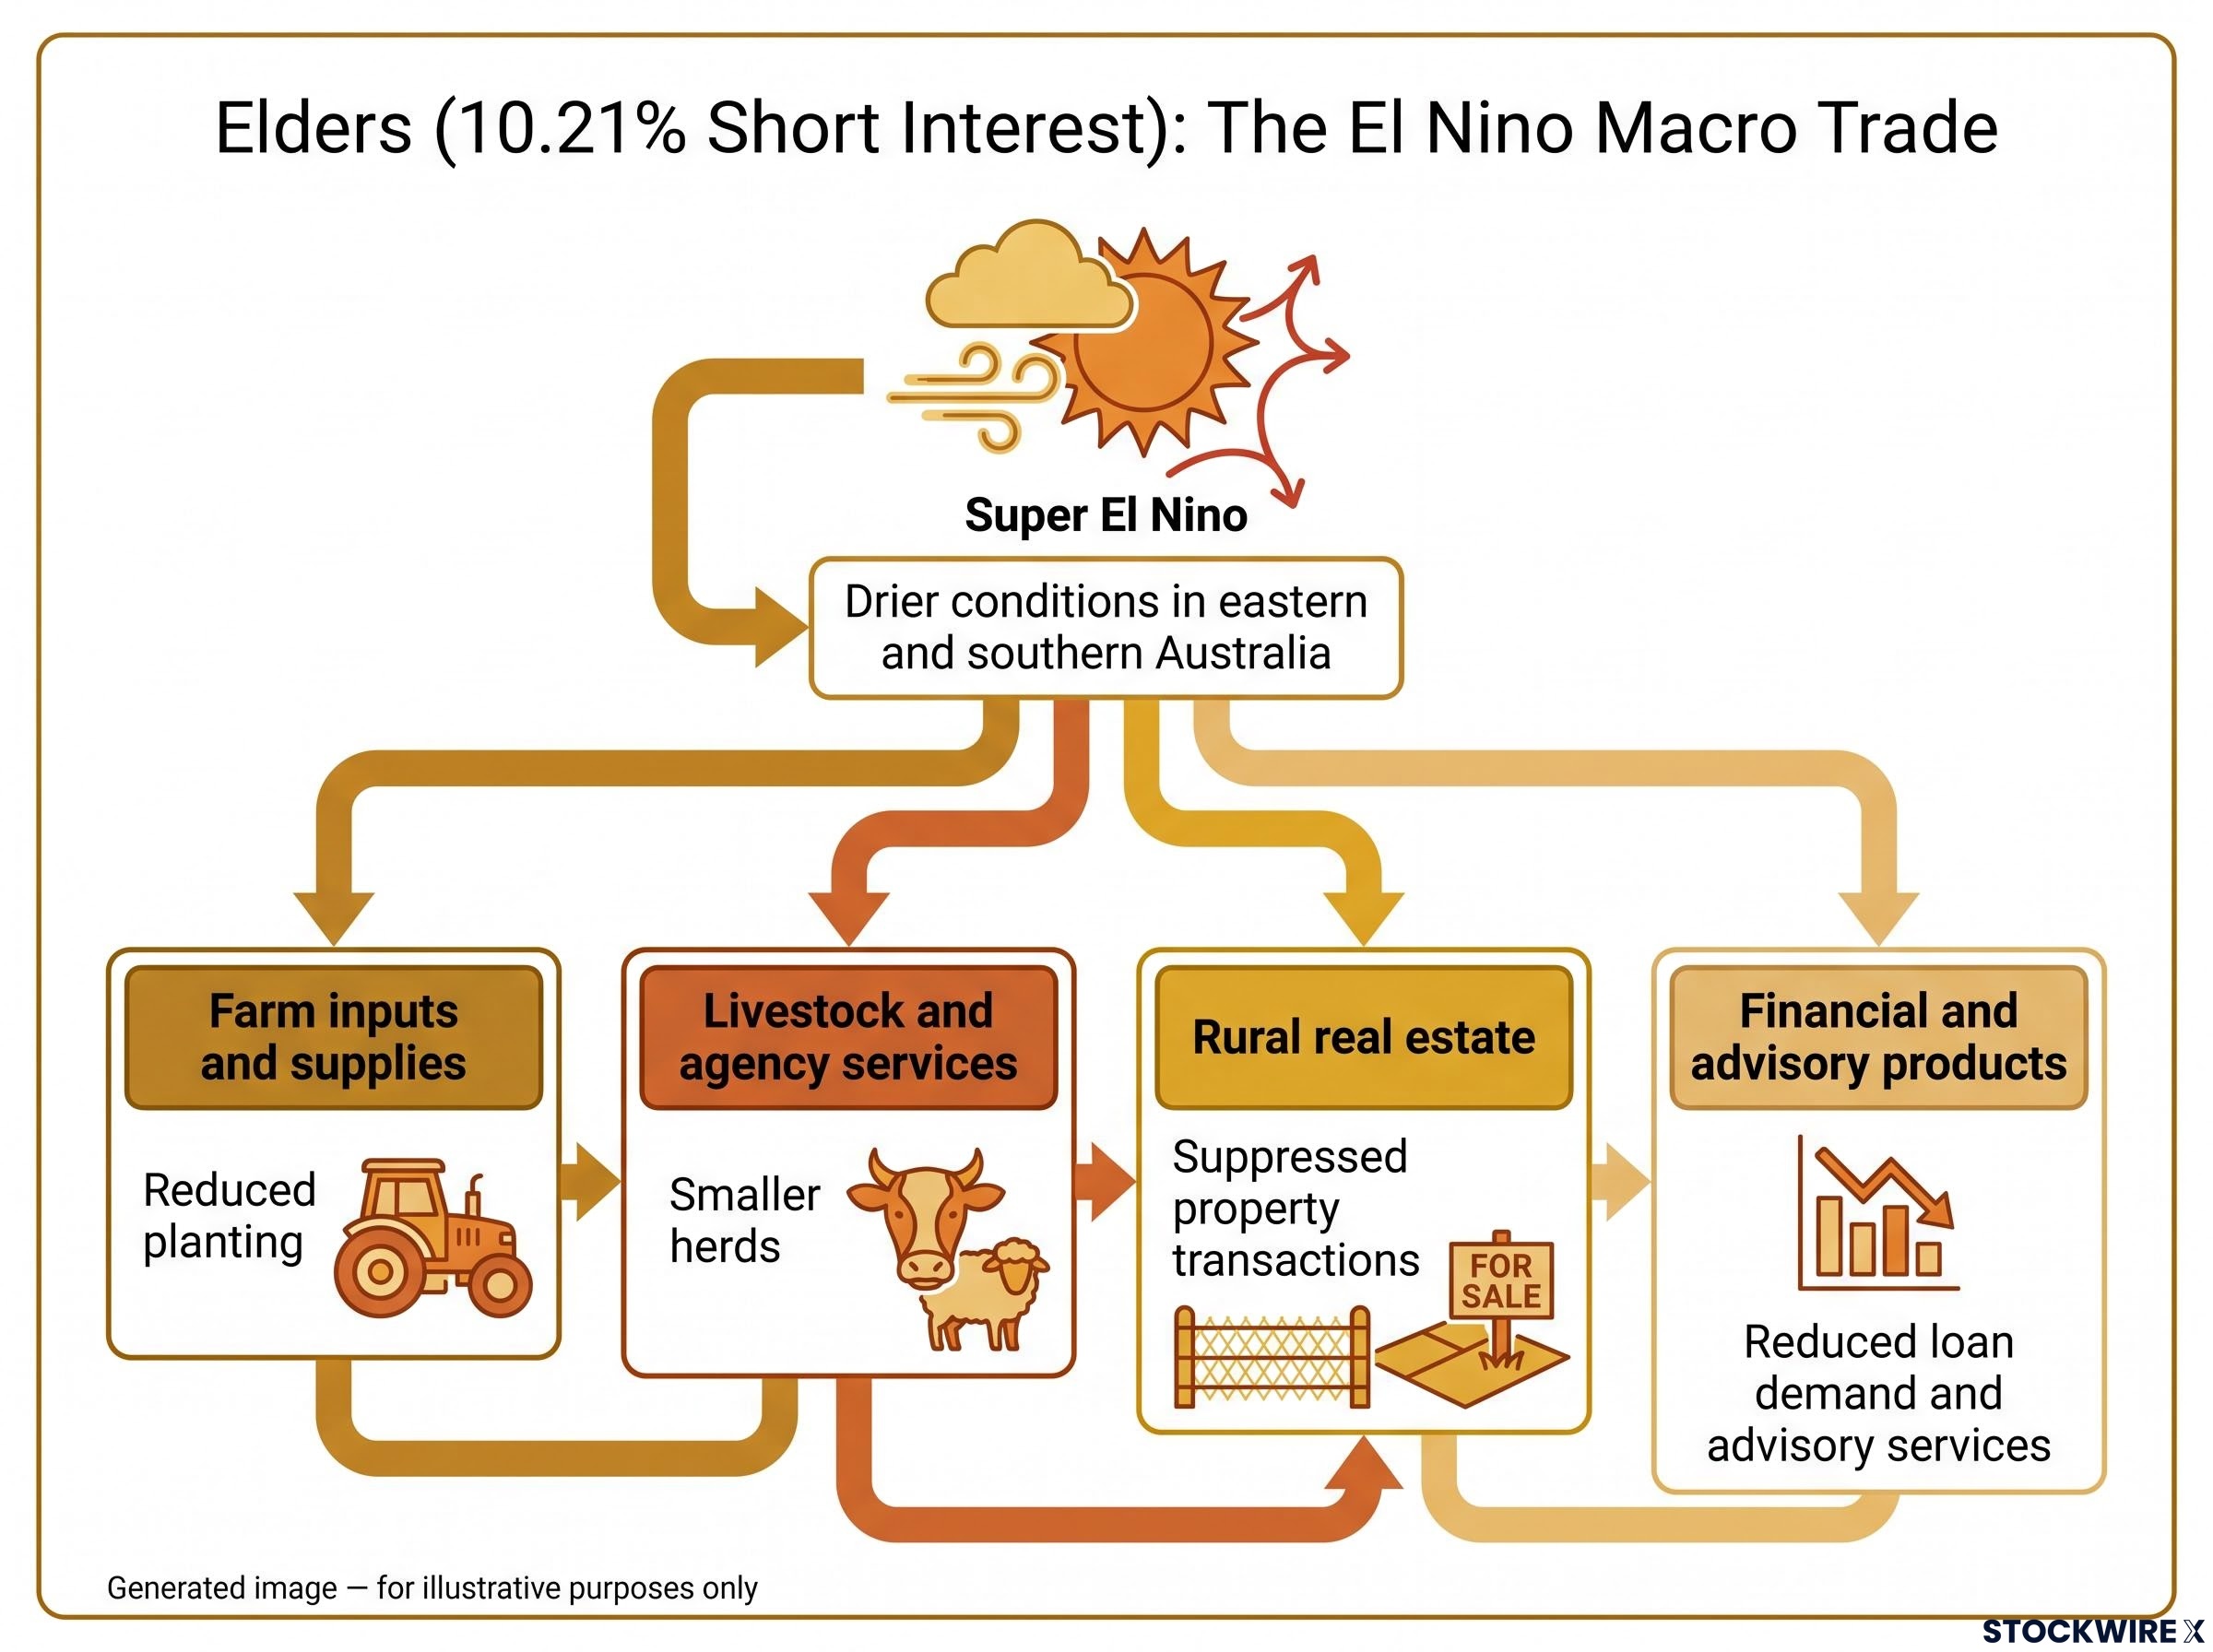
Elders functions as a clean proxy for Australian agricultural conditions. Its diversified but weather-dependent model lets traders gain macro weather exposure without single-commodity risk, which is precisely why short sellers are using it as a vehicle.
Agricultural earnings sensitivity to seasonal conditions extends beyond Elders: GrainCorp’s FY26 EBITDA guidance fell from A$308 million to A$200-240 million as global grain oversupply compounded the same regional weather pressures that short sellers are pricing into Elders positions.
| Company | Short Interest | WoW Change | MoM Change |
|---|---|---|---|
| Elders (ELD) | 10.21% | +1.01 pp | +0.69 pp |
| Cochlear (COH) | 9.76% | +0.80 pp | +4.86 pp |
| Karoon Energy (KAR) | 4.66% | +0.88 pp | +1.57 pp |
The sequencing of the weekly spike against the more gradual monthly build suggests the thesis had been forming through June, and that something in late June, likely updated El Nino forecasts or intensified coverage, accelerated conviction. What the short seller community is telling anyone with exposure to Elders is that the market may not yet be fully pricing a challenging seasonal outlook. Whether or not El Nino materialises at the severity implied, the probability distribution around near-term earnings has shifted toward the downside.
Karoon Energy and the question of when a bear thesis has been fully priced
Karoon Energy offers the most technically sequenced case. The timeline matters:
- The share price dropped 38% over the fortnight from 12 to 26 June 2026, driven by a significant cut to production guidance at the company’s Who Dat asset in the Gulf of Mexico.
- Fresh short interest accumulated into and after that fall, with the monthly build reaching +1.57 pp and the weekly move at +0.88 pp.
- A 9.1% rebound followed on 29 June 2026, after operations at the SPS-92 well at Bauna in Brazil resumed when a faulty electrical submersible pump (a downhole device that lifts oil to the surface) was replaced and the well successfully restarted.
The central question is direct: are shorts arriving after a 38% collapse making a good trade, or chasing a move that has already happened?
Whether the Who Dat downgrade is a temporary operational issue or a structural concern about reservoir performance and long-term project economics is the question on which the entire short thesis turns.
If it is temporary, much of the damage may already be priced in. If it signals deeper problems with decline rates or project economics, shorts can still justify positions on the view that the market is underestimating the long-term earnings impact.
The most informative data point here is what happened after the 9.1% bounce. Short interest held. It did not contract in response to the Bauna restart. That persistence tells you the bearish thesis is durable, centred on the Who Dat downgrade itself, and has not been dislodged by a single positive operational update from a different asset. Investors in Karoon need a specific view on Who Dat’s long-term performance to evaluate their position. The short sellers clearly have one.
What the broader Week 29 table reveals about sector-level bearish themes
The three case studies are not isolated. The broader Week 29 data reveals bearish pressure distributed across resources, energy, agriculture, and consumer sectors simultaneously.
| Company (Ticker) | Short Interest | WoW Change | MoM Change |
|---|---|---|---|
| Elders (ELD) | 10.21% | +1.01 pp | +0.69 pp |
| Cochlear (COH) | 9.76% | +0.80 pp | +4.86 pp |
| Pilbara Minerals (PLS) | 9.29% | +0.58 pp | -1.01 pp |
| Temple & Webster (TPW) | 7.09% | +0.63 pp | -1.45 pp |
| Genesis Minerals (GMD) | 6.49% | +0.65 pp | +0.47 pp |
| Firefly Metals (FFM) | 6.06% | +0.74 pp | +1.04 pp |
| ARB Corp (ARB) | 5.15% | +0.52 pp | +1.59 pp |
| AGL Energy (AGL) | 4.87% | +0.87 pp | +0.79 pp |
| Karoon Energy (KAR) | 4.66% | +0.88 pp | +1.57 pp |
| James Hardie (JHX) | 3.63% | +0.97 pp | +0.93 pp |
| Predictive Discovery (PDI) | 3.53% | +0.54 pp | +2.45 pp |
| Judo Capital (JDO) | 3.25% | +0.57 pp | +0.79 pp |
| Ampol (ALD) | 2.95% | +0.64 pp | +1.38 pp |
| Emerald Resources (EMR) | 2.94% | +0.51 pp | +0.95 pp |
| Peninsula Energy (PEN) | 2.27% | +0.56 pp | +1.57 pp |
Three sector-level themes stand out. Within the resources space, copper and gold-focused names including Firefly Metals, Genesis Minerals, and Emerald Resources are drawing bearish interest from investors who doubt whether current equity valuations remain justified by the underlying commodity picture. In energy, AGL Energy and Ampol are seeing sustained monthly builds (+0.79 pp and +1.38 pp respectively), reflecting medium-term scepticism around energy transition and price volatility.
The contested signals are equally instructive. Pilbara Minerals shows a weekly rise (+0.58 pp) alongside a monthly decline (-1.01 pp), suggesting short covering through June followed by renewed bearish positioning in early July, a pattern consistent with range-bound, two-way positioning rather than consensus pessimism. Temple & Webster mirrors that pattern with its -1.45 pp monthly decline. By contrast, the directional monthly builds in ARB Corp (+1.59 pp) and Ampol (+1.38 pp) signal more sustained thesis-building.
What the sector patterns tell you is that bearish pressure is not concentrated in a single market theme. Any portfolio with meaningful ASX equity exposure is likely carrying at least one stock where a substantive short thesis is building.
Three theses, one table, and a framework for reading the next short report
The Cochlear, Elders, and Karoon cases distil into a four-step framework you can apply to any short interest data you encounter:
- Start with the thesis, not the price chart. Cochlear’s shorts are making a valuation case against strong momentum. Elders’ shorts are expressing a weather bet. Karoon’s shorts are focused on a specific asset’s operational trajectory. Each demands a different analytical response.
- Separate the initial catalyst from the ongoing thesis. In Karoon, the Who Dat downgrade was the obvious catalyst. Short interest holding through a 9.1% bounce tells you the thesis is durable, not just reactive.
- Treat price-to-short-interest divergence as information, not noise. Cochlear’s 34% rally alongside record short interest represents genuine disagreement between well-resourced market participants. The underlying argument deserves examination regardless of whether you ultimately agree.
- Weight the monthly trend over the weekly figure. The +4.86 pp monthly build in Cochlear is far more indicative of deliberate position-building than the +0.80 pp weekly move. Similarly, Ampol’s +1.38 pp monthly move and ARB Corp’s +1.59 pp signal more than their weekly figures alone would suggest.
The framework works because each step directs you toward a specific question rather than a directional conclusion. Short interest data is not a trading signal to follow mechanically. It is a source of alternative hypotheses about risk, valuation, and cyclicality, generated by investors with significant capital behind their conviction. The questions they pose are exactly the questions long investors should be thinking through.
For investors wanting to apply this framework to additional sectors and time periods, our dedicated guide to reading ASX short tables covers the uranium, lithium, and funds management shorts from May 2026, including the Lotus Resources 5.41 percentage point monthly surge and the IDP Education short cover that followed.
This article is for informational purposes only and should not be considered financial advice. Investors should conduct their own research and consult with financial professionals before making investment decisions. Past performance does not guarantee future results.