
Approximately 6,500 Westpac shares stand between you and $10,000 a year in dividend income. That is the straightforward maths. The complication: nine of the fourteen analysts covering the stock currently rate it a sell.
The timing matters here. Westpac is past the three-quarter mark of its FY26 financial year, the interim dividend of 77 cents per share was paid on 26 June 2026, and the final dividend is approaching. If you are making an income-focused portfolio decision right now, you are working with live forward projections, not hypotheticals.
This piece gives you the exact share counts for FY26 and FY27, explains how franking credits change the effective requirement, and lays out the risk picture honestly, including the analyst consensus, the competitive pressure driving it, and the questions you should be asking before committing capital. The goal is a complete framework, not a recommendation.
What the numbers actually say: shares needed for $10,000 a year
The formula is simple: take your target annual income and divide it by the projected dividend per share. Using CommSec consensus projections, here is what the calculation produces for both forecast years.
Target annual income ÷ projected dividend per share = shares required
| Financial Year | Projected Dividend Per Share | Shares Required for $10,000 | Dividend Yield (excl. franking) |
|---|---|---|---|
| FY26 | $1.54 | ~6,494 | ~4.3% |
| FY27 | $1.55 | ~6,452 | — |
The FY27 projected dividend of $1.55 represents a 0.6% increase over FY26. That is not a rounding error; it is the actual forecast trajectory. The near-identical share counts across both years tell you something important: Westpac’s dividend growth is essentially flat. If you are assessing this as a multi-year income vehicle, that flatness matters, particularly when inflation is eating into the purchasing power of every dollar your dividends deliver.
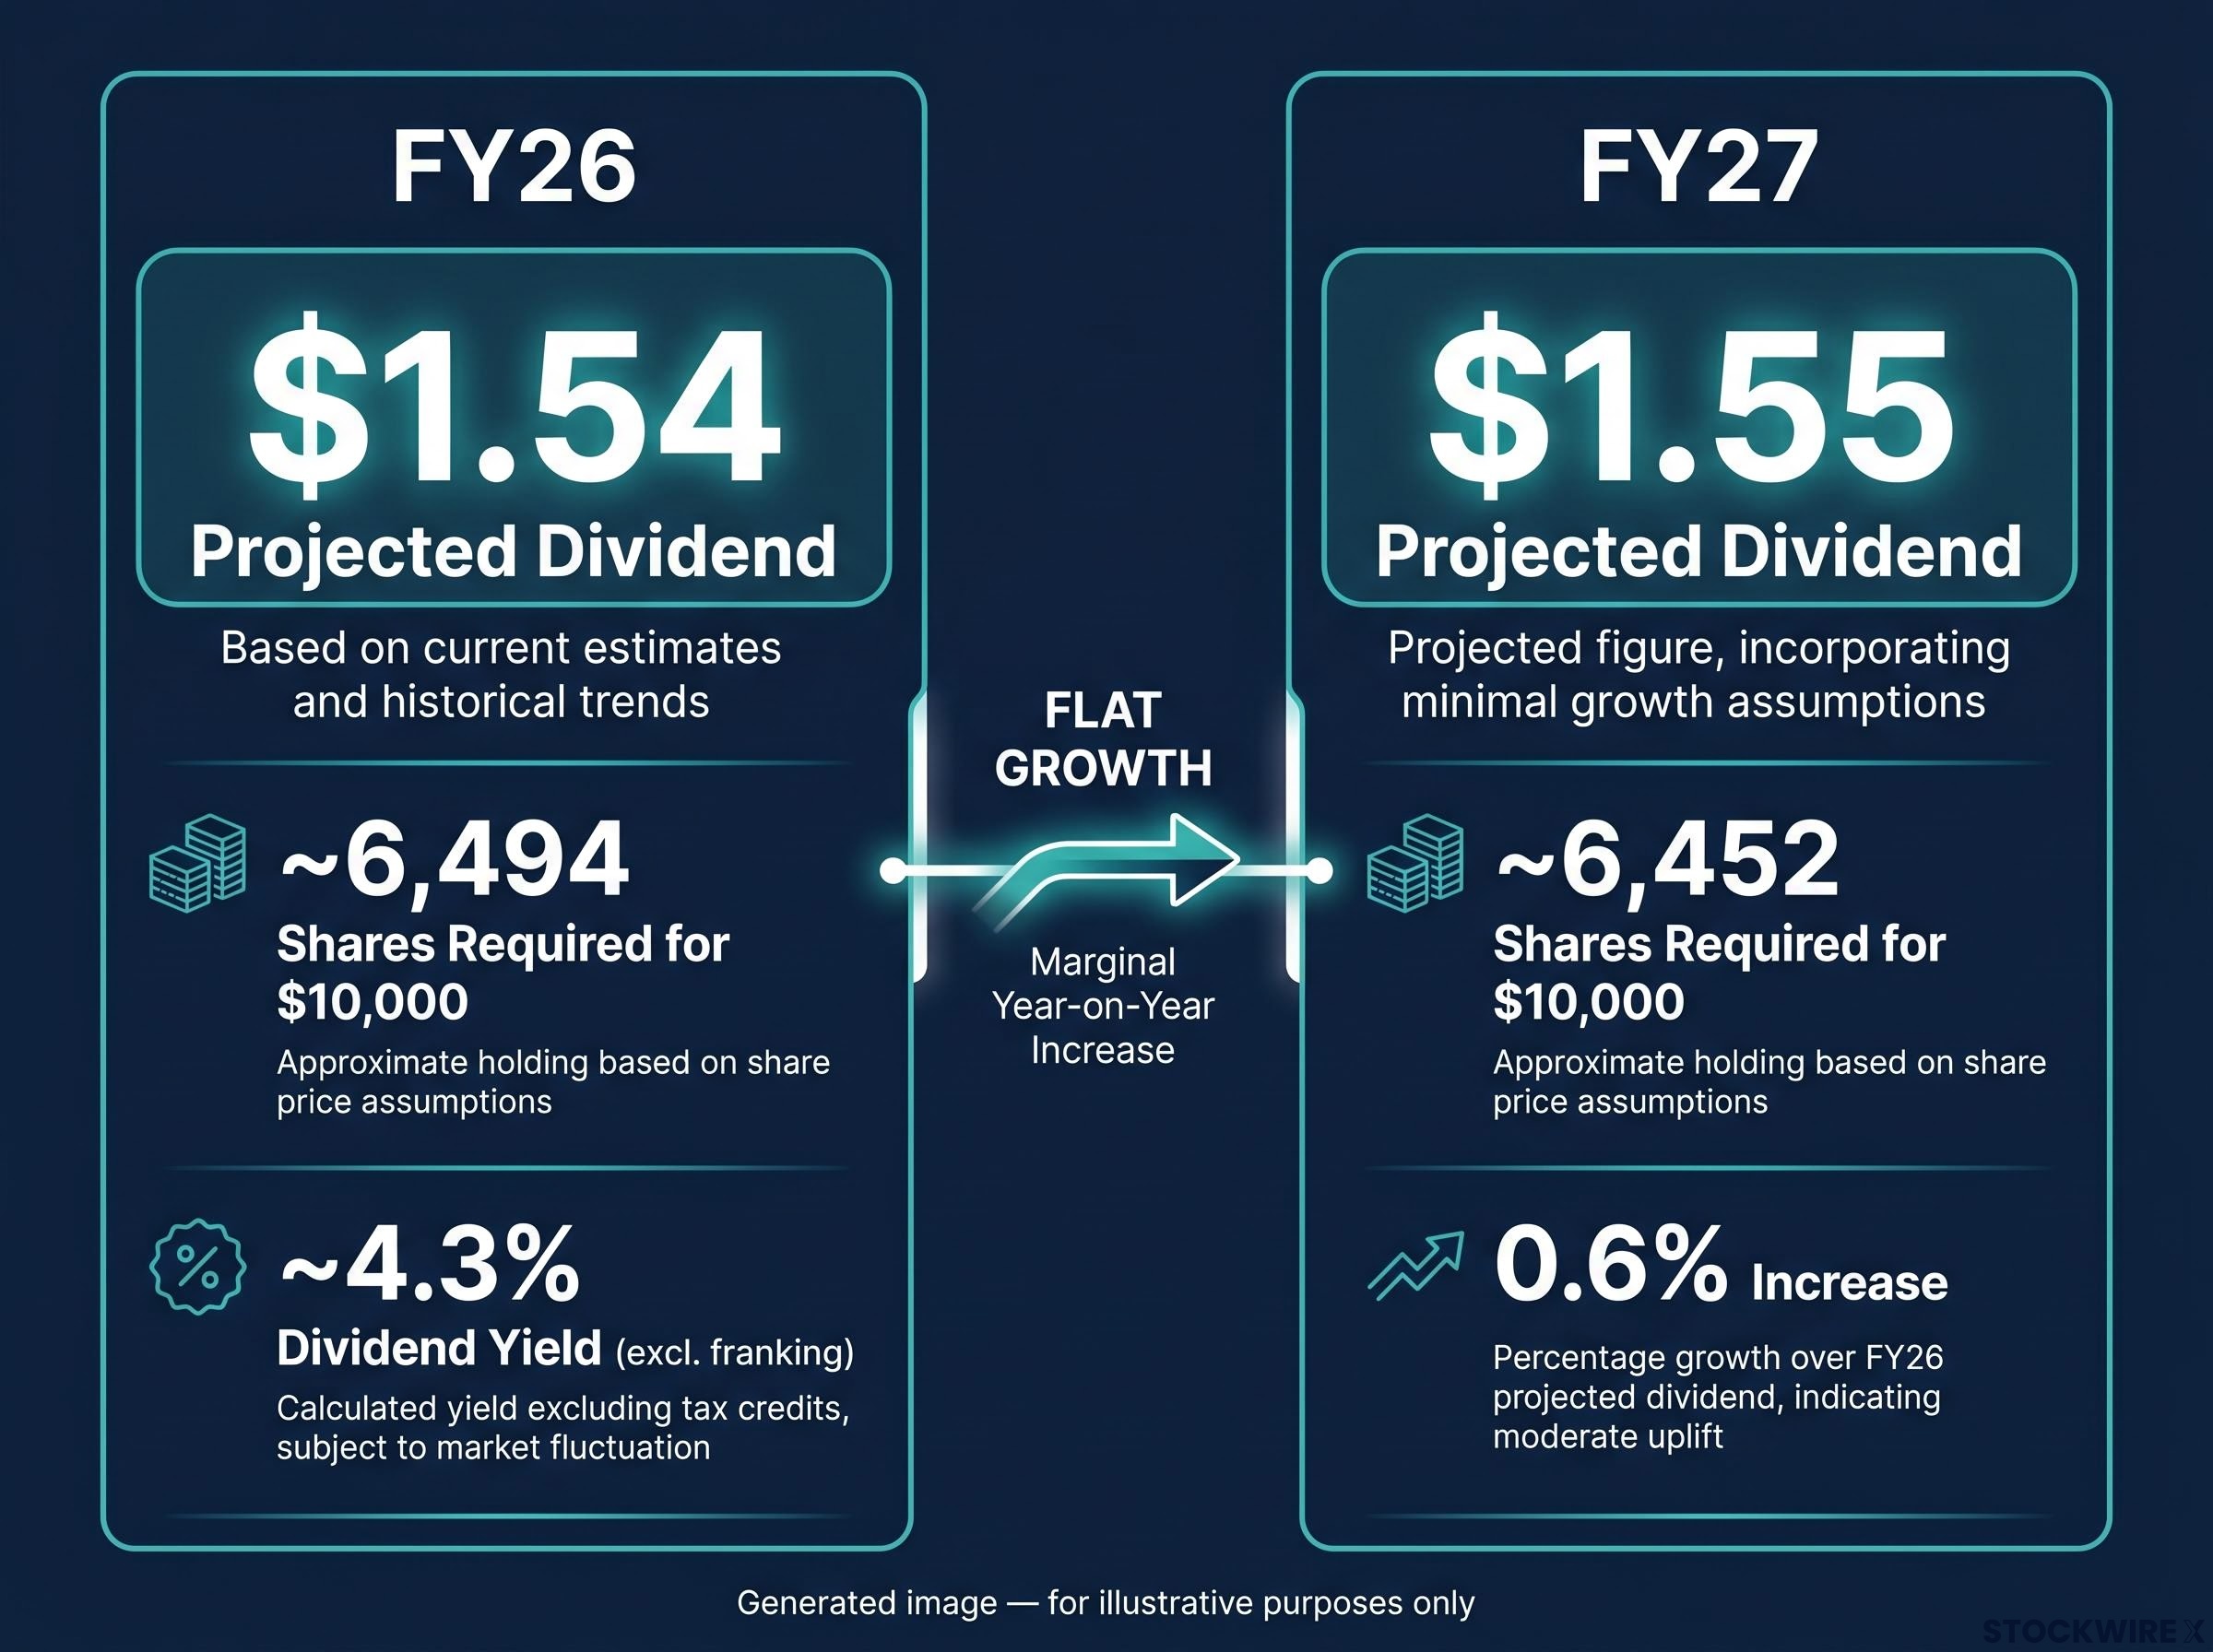
Two caveats worth holding in your head. These are analyst consensus projections compiled by CommSec, not guaranteed figures. And both calculations assume ordinary dividends only, with no special dividends factored in.
When big ASX news breaks, our subscribers know first
How franking credits reduce the share count you actually need
The pre-tax share counts above are the starting point, not the full picture. Westpac dividends come with a structural advantage that reduces the capital you need to hit your income target.
Here are the three franking facts that matter:
- Westpac dividends are 100% franked at the 30% corporate tax rate
- Franking credits attach to each dividend, effectively lifting the after-tax value of every dollar you receive
- New Zealand imputation credits also apply where relevant
If you are in a lower marginal tax bracket, or holding shares in a superannuation fund taxed at 15%, the gap between the pre-tax share count and the after-tax share count can be meaningful. You may need significantly fewer than 6,494 shares to reach a $10,000 after-tax income target.
The precise reduction depends on your individual circumstances, and you should model this against your own tax position or consult a tax adviser.
The ATO franking credit rules set out the holding period requirements and eligibility conditions that determine whether you can actually claim the credit attached to each Westpac dividend, conditions that directly affect how many shares you need to reach your after-tax income target.
What this means for your effective income target
The concept here is grossed-up yield, which is the full economic return including both the cash dividend and the attached franking credit. The calculation is: cash dividend divided by (1 minus the corporate tax rate).
For FY26, that produces a grossed-up yield of approximately 6.1% for eligible investors. Compare that to the headline 4.3% yield excluding franking. The difference is substantial, and it is one of the reasons fully franked ASX dividend stocks attract the income-focused investor base they do.
The takeaway: on an after-tax basis, Westpac’s income proposition is more competitive than the headline yield alone suggests. But the income proposition only works if the dividend holds. That is where the analyst consensus enters the picture.
Why most analysts currently rate Westpac a sell
When CommSec’s aggregation of analyst opinions on Westpac is examined as of mid-2026, the breakdown is stark: not a single analyst carries a buy rating, seven have assigned a hold, and nine have issued a sell. That distribution is not routine caution. It is a clear negative lean across the professional coverage universe.
| Rating | Number of Analysts | Percentage |
|---|---|---|
| Buy | 0 | 0% |
| Hold | 7 | 50% |
| Sell | 9 | 64% |
| Total | 14 | 100% |
An analyst rating, for context, is a professional recommendation reflecting where an analyst expects the share price to go over the next 12 months. A “sell” rating means the analyst believes the stock is likely to underperform, not that disaster is imminent. But nine sells out of fourteen is a strong signal. Not a single analyst covering the stock sees it as a buy at current prices.
The sell-heavy consensus on Westpac is not an isolated case: across ASX bank shares, analyst price targets imply sector-wide downside of 5-20% from current prices, yet markets have continued to hold valuations that professional coverage universes consider stretched heading into mid-2026.
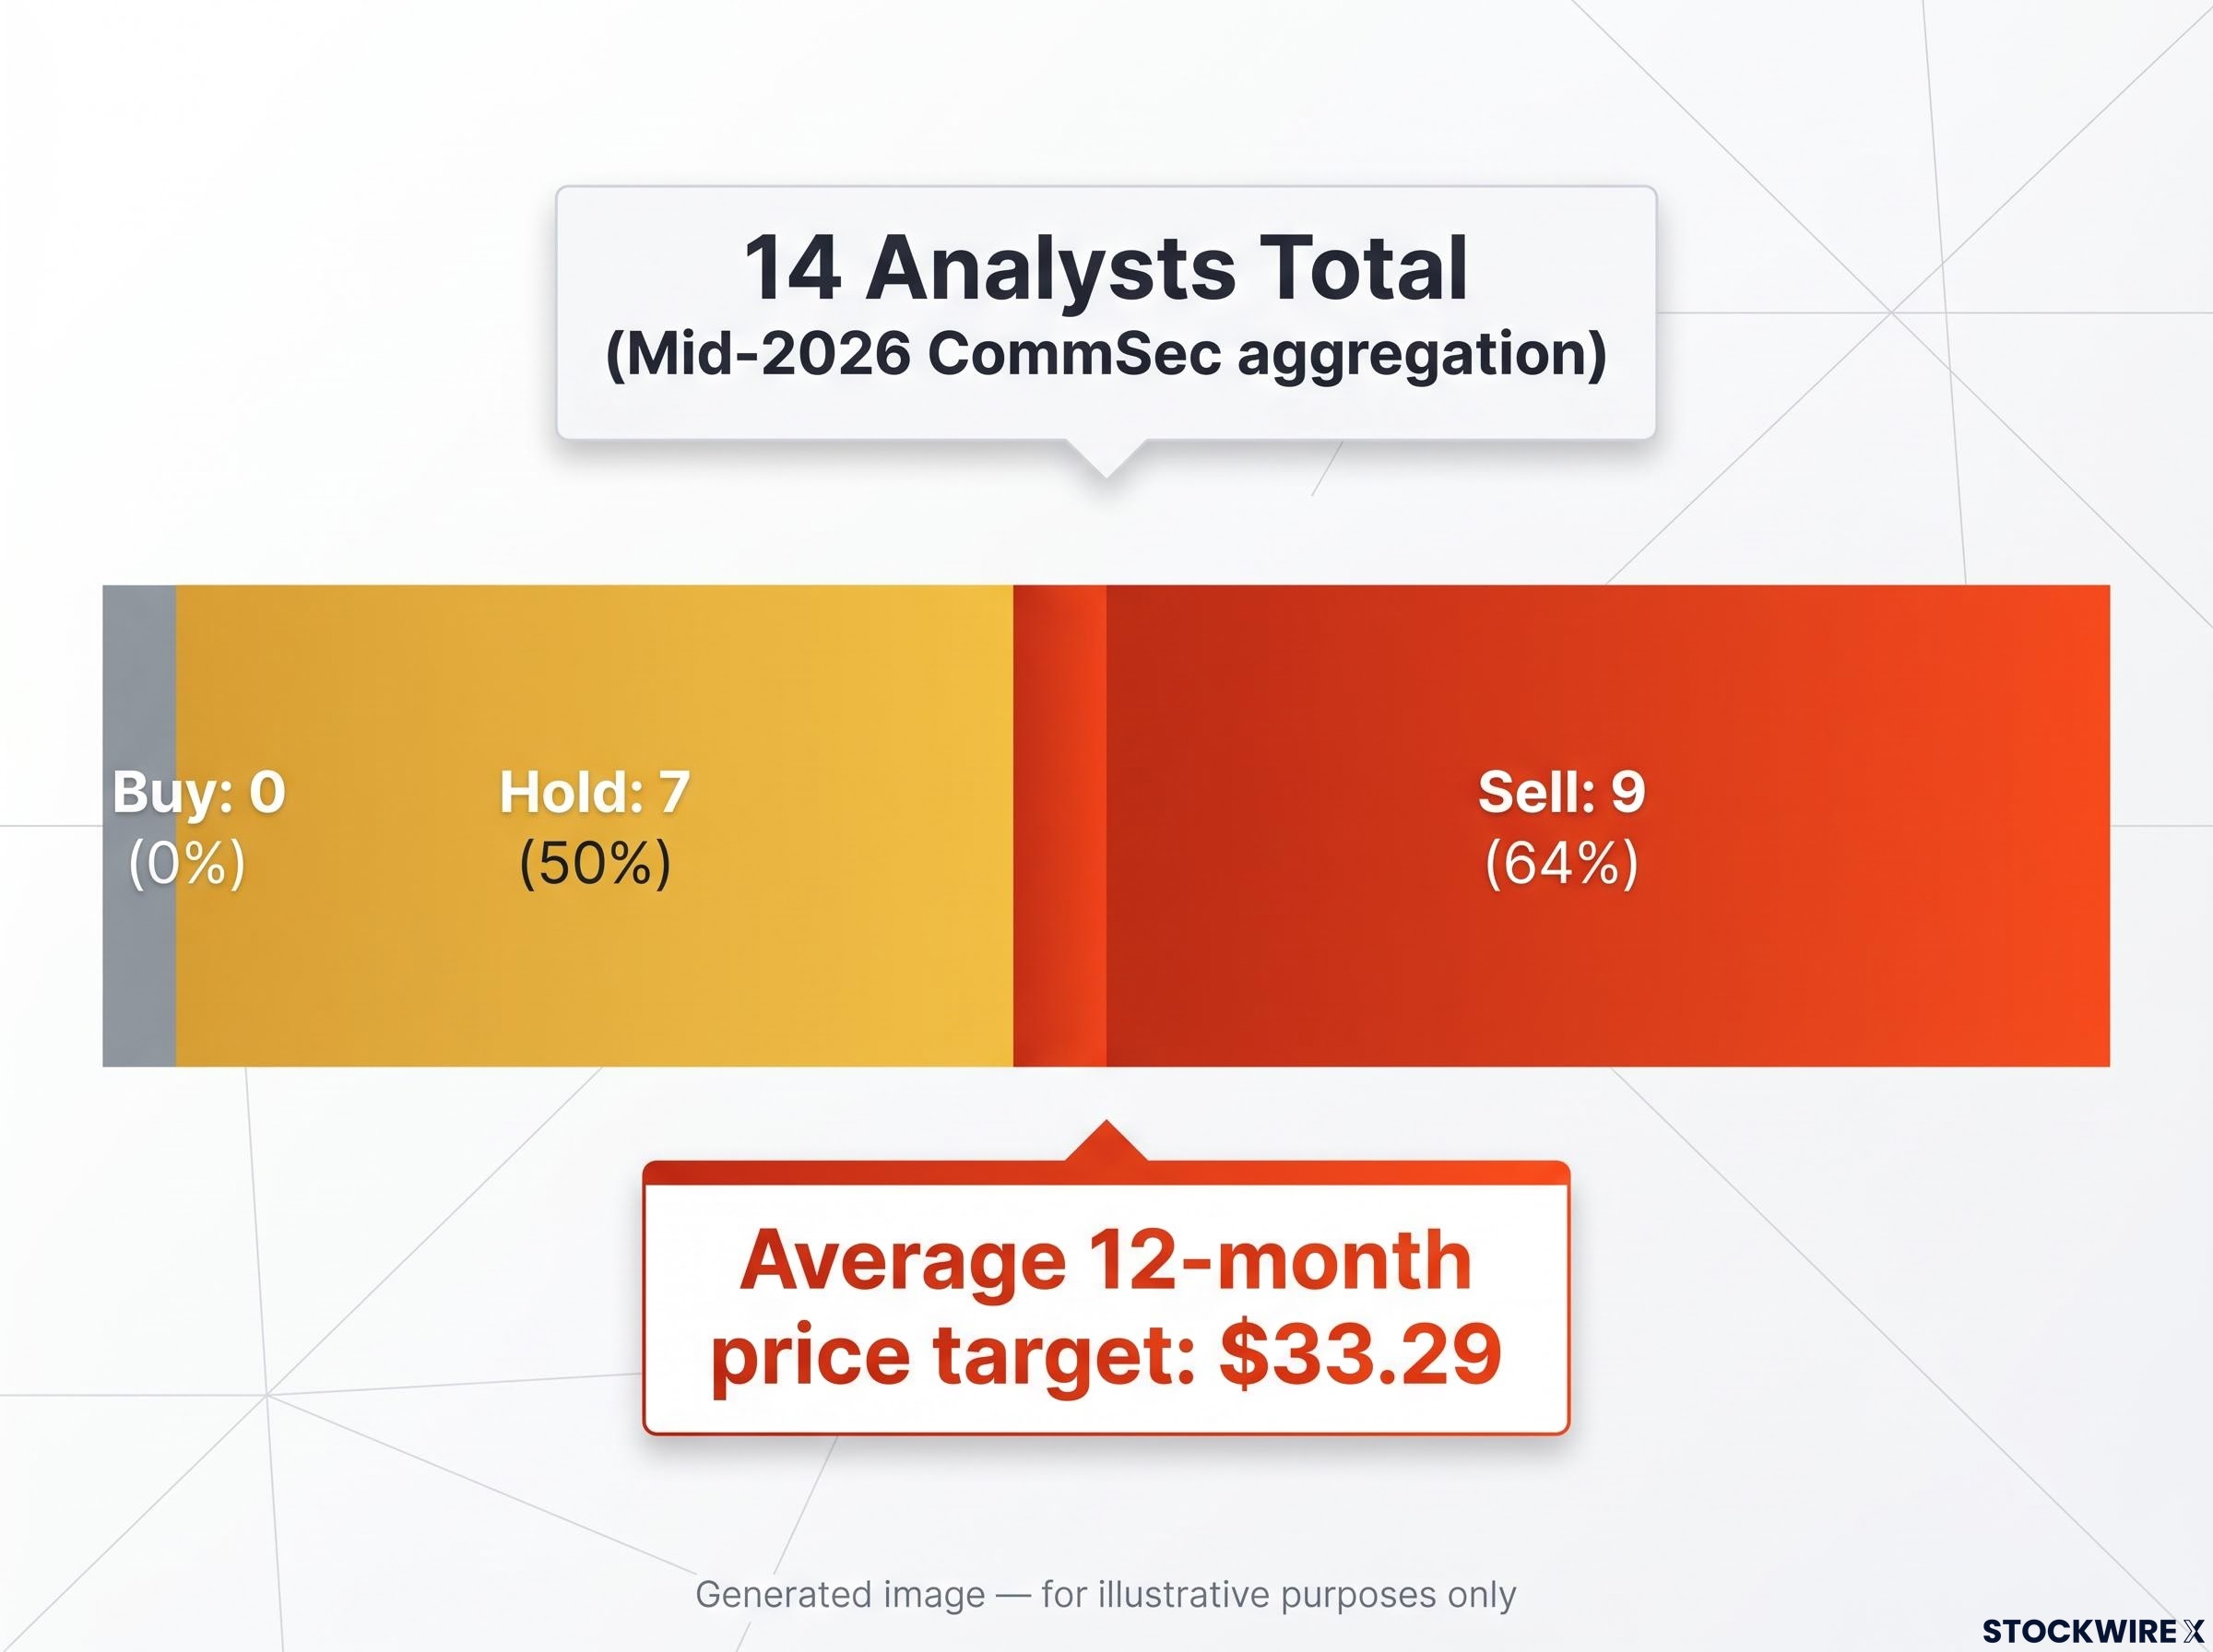
Average 12-month analyst price target: approximately $33.29 (source: CommSec aggregation)
Two concerns are driving the sell tilt. The first is net interest margin compression, the narrowing of the spread between what Westpac earns on loans and what it pays on deposits. Competitive pressure across the banking sector is squeezing that margin. The second concern flows directly from the first: if margin compression persists and earnings deteriorate, the dividend projections that underpin the income case may not hold. A dividend revision becomes a plausible outcome rather than a remote one.
For you as an income investor, this matters directly. The share counts in the first section are only as reliable as the dividend forecasts behind them, and those forecasts carry more uncertainty than a 4.3% yield figure on its own would suggest.
The competitive pressure behind the analyst pessimism
The margin compression analysts are worried about is not abstract. It has a specific competitive source.
Westpac operates in a banking market where pressure comes from every direction. The ASX-listed competitive field alone includes:
- Commonwealth Bank of Australia (CBA)
- National Australia Bank (NAB)
- ANZ Group Holdings (ANZ)
- Macquarie Group (MQG)
- Bank of Queensland (BOQ)
- Bendigo and Adelaide Bank (BEN)
- MyState Ltd (MYS)
- Pepper Money (PPM)
And this list excludes non-ASX-listed institutions that compete across mortgage lending, business banking, and deposits. The breadth of the competitive field tells you this is not a temporary pressure that will resolve itself. It is a structural feature of the Australian banking environment.
Why Macquarie is the name analysts keep coming back to
Macquarie Group attracts specific attention as a competitive threat. Its business model allows it to pursue growth in segments where the traditional major banks, Westpac included, have historically earned comfortable margins. When a player with Macquarie’s resources and ambition targets those same segments, the margin buffer that supports dividends narrows.
This dynamic is not unique to Westpac; it affects all four major banks. But understanding it helps you gauge whether the analyst pessimism is a temporary reaction to one bad quarter or a reflection of something more durable. The evidence points toward the latter. For a multi-year income position, that distinction matters.
Does the income case still hold? Weighing yield against risk
The analyst ratings paint a negative picture. But ratings alone do not settle the question for an income investor with a specific goal in mind.
Here is the counterpoint: Westpac continues to generate multi-billion dollar annual net profits. That earnings base, even under margin pressure, underpins near-term dividend capacity. The bank has the buffer to pay its projected dividends for the foreseeable future. The question is whether that buffer is shrinking fast enough to threaten the payout over your specific holding period.
Westpac’s 1H26 payout ratio of 75.6% sits above the bank’s own target range of 65-75% of cash earnings, meaning payout ratio headroom to grow dividends further is limited without a corresponding improvement in underlying earnings, a constraint that reinforces the flat trajectory visible in the FY26-FY27 projections.
Despite the intensity of competition it faces, the bank’s earnings remain substantial enough each year to support its dividend commitments in the near term.
There is also a factual anchor worth noting. The FY26 interim dividend of 77 cents per share (fully franked) was already paid on 26 June 2026. The FY26 income story is at least half confirmed. That gives you more certainty about the near-term picture than the sell-heavy analyst consensus alone might suggest.
The risk-benefit calculation differs depending on your situation. Before committing capital, ask yourself:
- Can you tolerate dividend variability, including the possibility that the payout could be cut in a future period?
- What is your investment horizon? A five-year income position carries different risk to a one-year trade.
- How does Westpac fit alongside other income positions in your portfolio? Concentration in a single bank adds sector-specific risk.
- Are you pricing in the franking credit benefit accurately for your own tax bracket?
These are not rhetorical questions. The answers shape whether Westpac at current prices is the right income vehicle for you specifically, or whether the yield is insufficient compensation for the risks you are taking on.
This article is for informational purposes only and should not be considered financial advice. Investors should conduct their own research and consult with financial professionals before making investment decisions.
Making the call with clear eyes on the income trade-off
The mechanics are concrete. Approximately 6,494 shares get you to $10,000 in annual dividend income based on FY26 projections; approximately 6,452 for FY27. Franking at the 30% corporate tax rate pushes the grossed-up yield to roughly 6.1% for eligible investors, reducing the effective share count you need.
The risk layer is equally concrete. Not one of the 14 analysts covering Westpac holds a buy rating, with nine of them sitting at sell and the remainder at hold, alongside an average 12-month price target of approximately $33.29, and competitive margin pressure that is structural rather than cyclical. The income case relies on dividend projections holding, and those projections carry genuine uncertainty.
If you are evaluating Westpac for income, here is where to take it from here:
- Review the full analyst consensus data through your broker platform, not just the headline rating
- Model your own franking credit benefit based on your marginal tax rate and superannuation structure
- Compare Westpac’s effective yield to other fully franked ASX dividend options across the banking sector
- Monitor Westpac’s upcoming final dividend announcement as the September financial year-end approaches
Investors who approach this decision with both the share count and the risk context are better positioned to make a call they can live with when dividend season arrives. The maths gives you a number. The analyst picture, the competitive environment, and your own investment horizon give you the judgement framework to decide whether that number is worth pursuing.
For investors wanting to extend this single-stock calculation into a full retirement income framework, our dedicated guide to living off dividends in Australia covers the capital targets, superannuation structures, and inflation-adjusted portfolio sizing required to generate sustainable income across different retirement income benchmarks.
Past performance does not guarantee future results. Dividend projections are subject to market conditions and company performance.
—