
Hormuz Prices Have Normalised. Geopolitical Inflation Risk Has Not.
54 mins ago
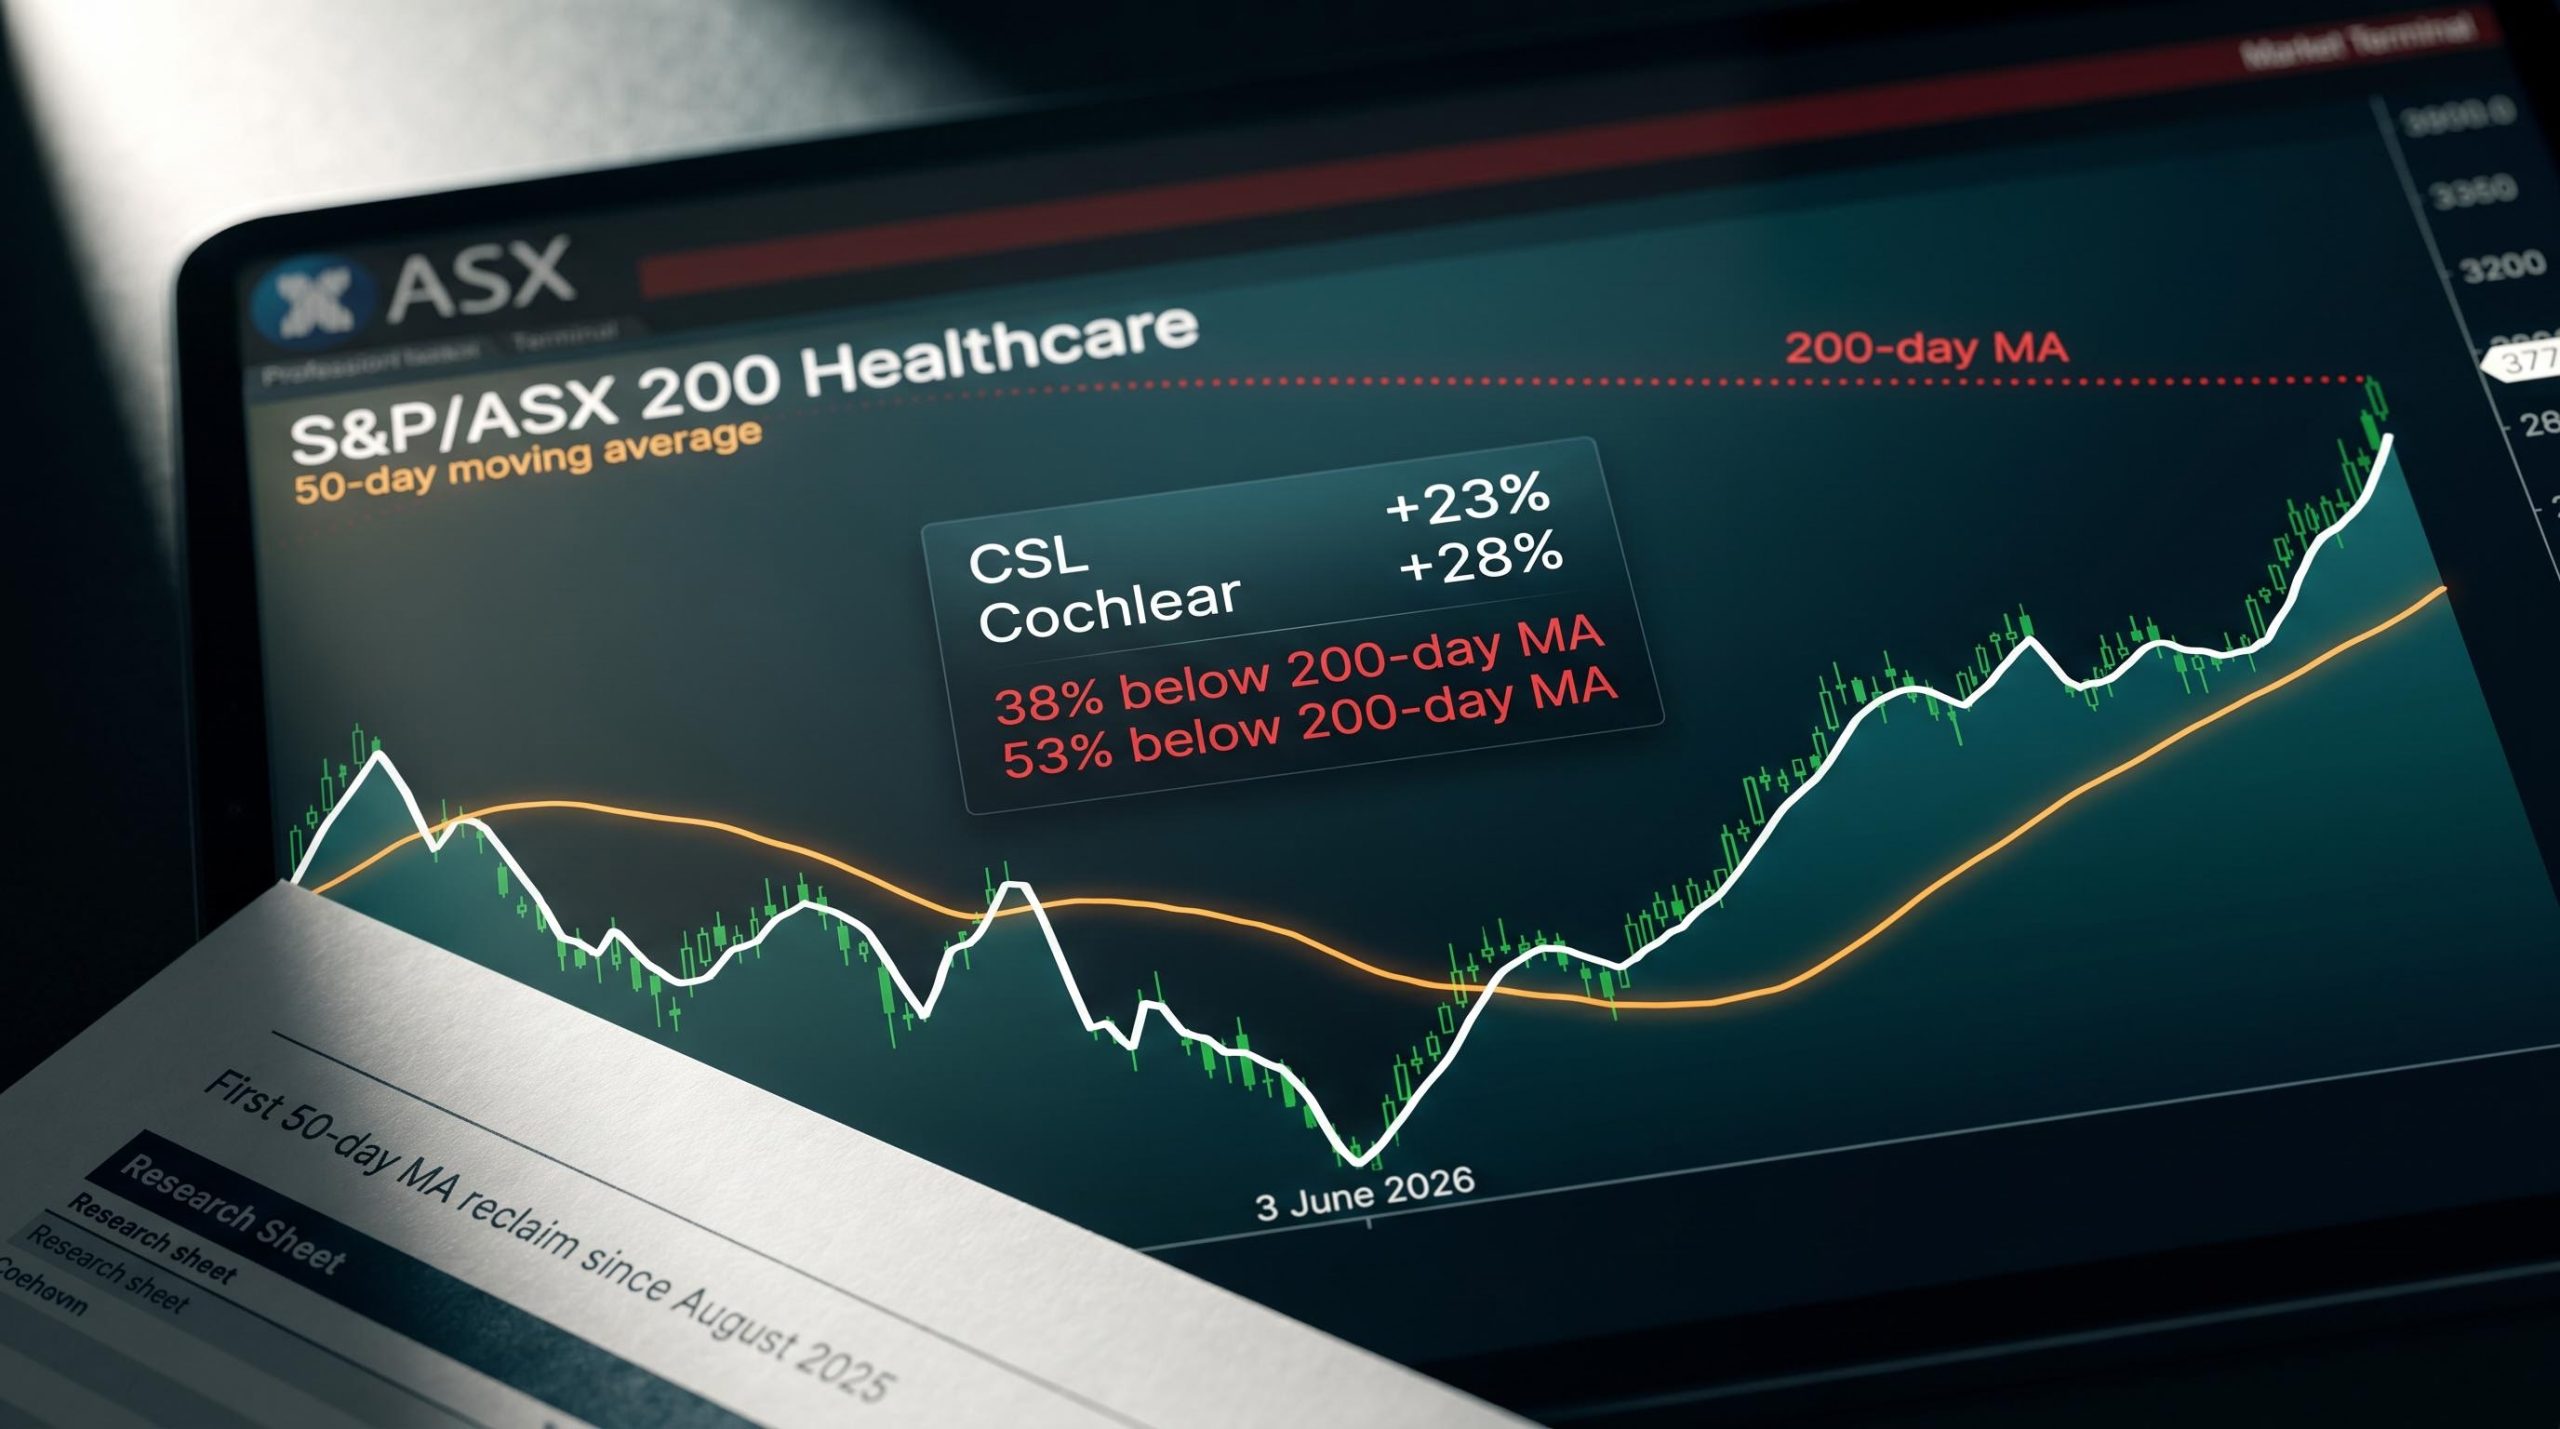
A sector that spent ten months producing nothing but failed rallies just crossed its 50-day moving average for the first time since August 2025. Whether that signal means anything is the only question worth asking right now.
The S&P/ASX 200 Healthcare index has rebounded sharply from its 3 June 2026 low, with the rally variously measured at approximately 13% (audited research) and 17% (original source reporting). From that same low, CSL has added roughly 23% and Cochlear roughly 28%. The move has coincided with a broad defensive rotation across the ASX, with Staples and Discretionary both rising in the range of 12-13% across the same period. But healthcare has spent the past year generating exactly this kind of short-term excitement before failing. The question is not whether the rally has happened. The question is what it is evidence of.
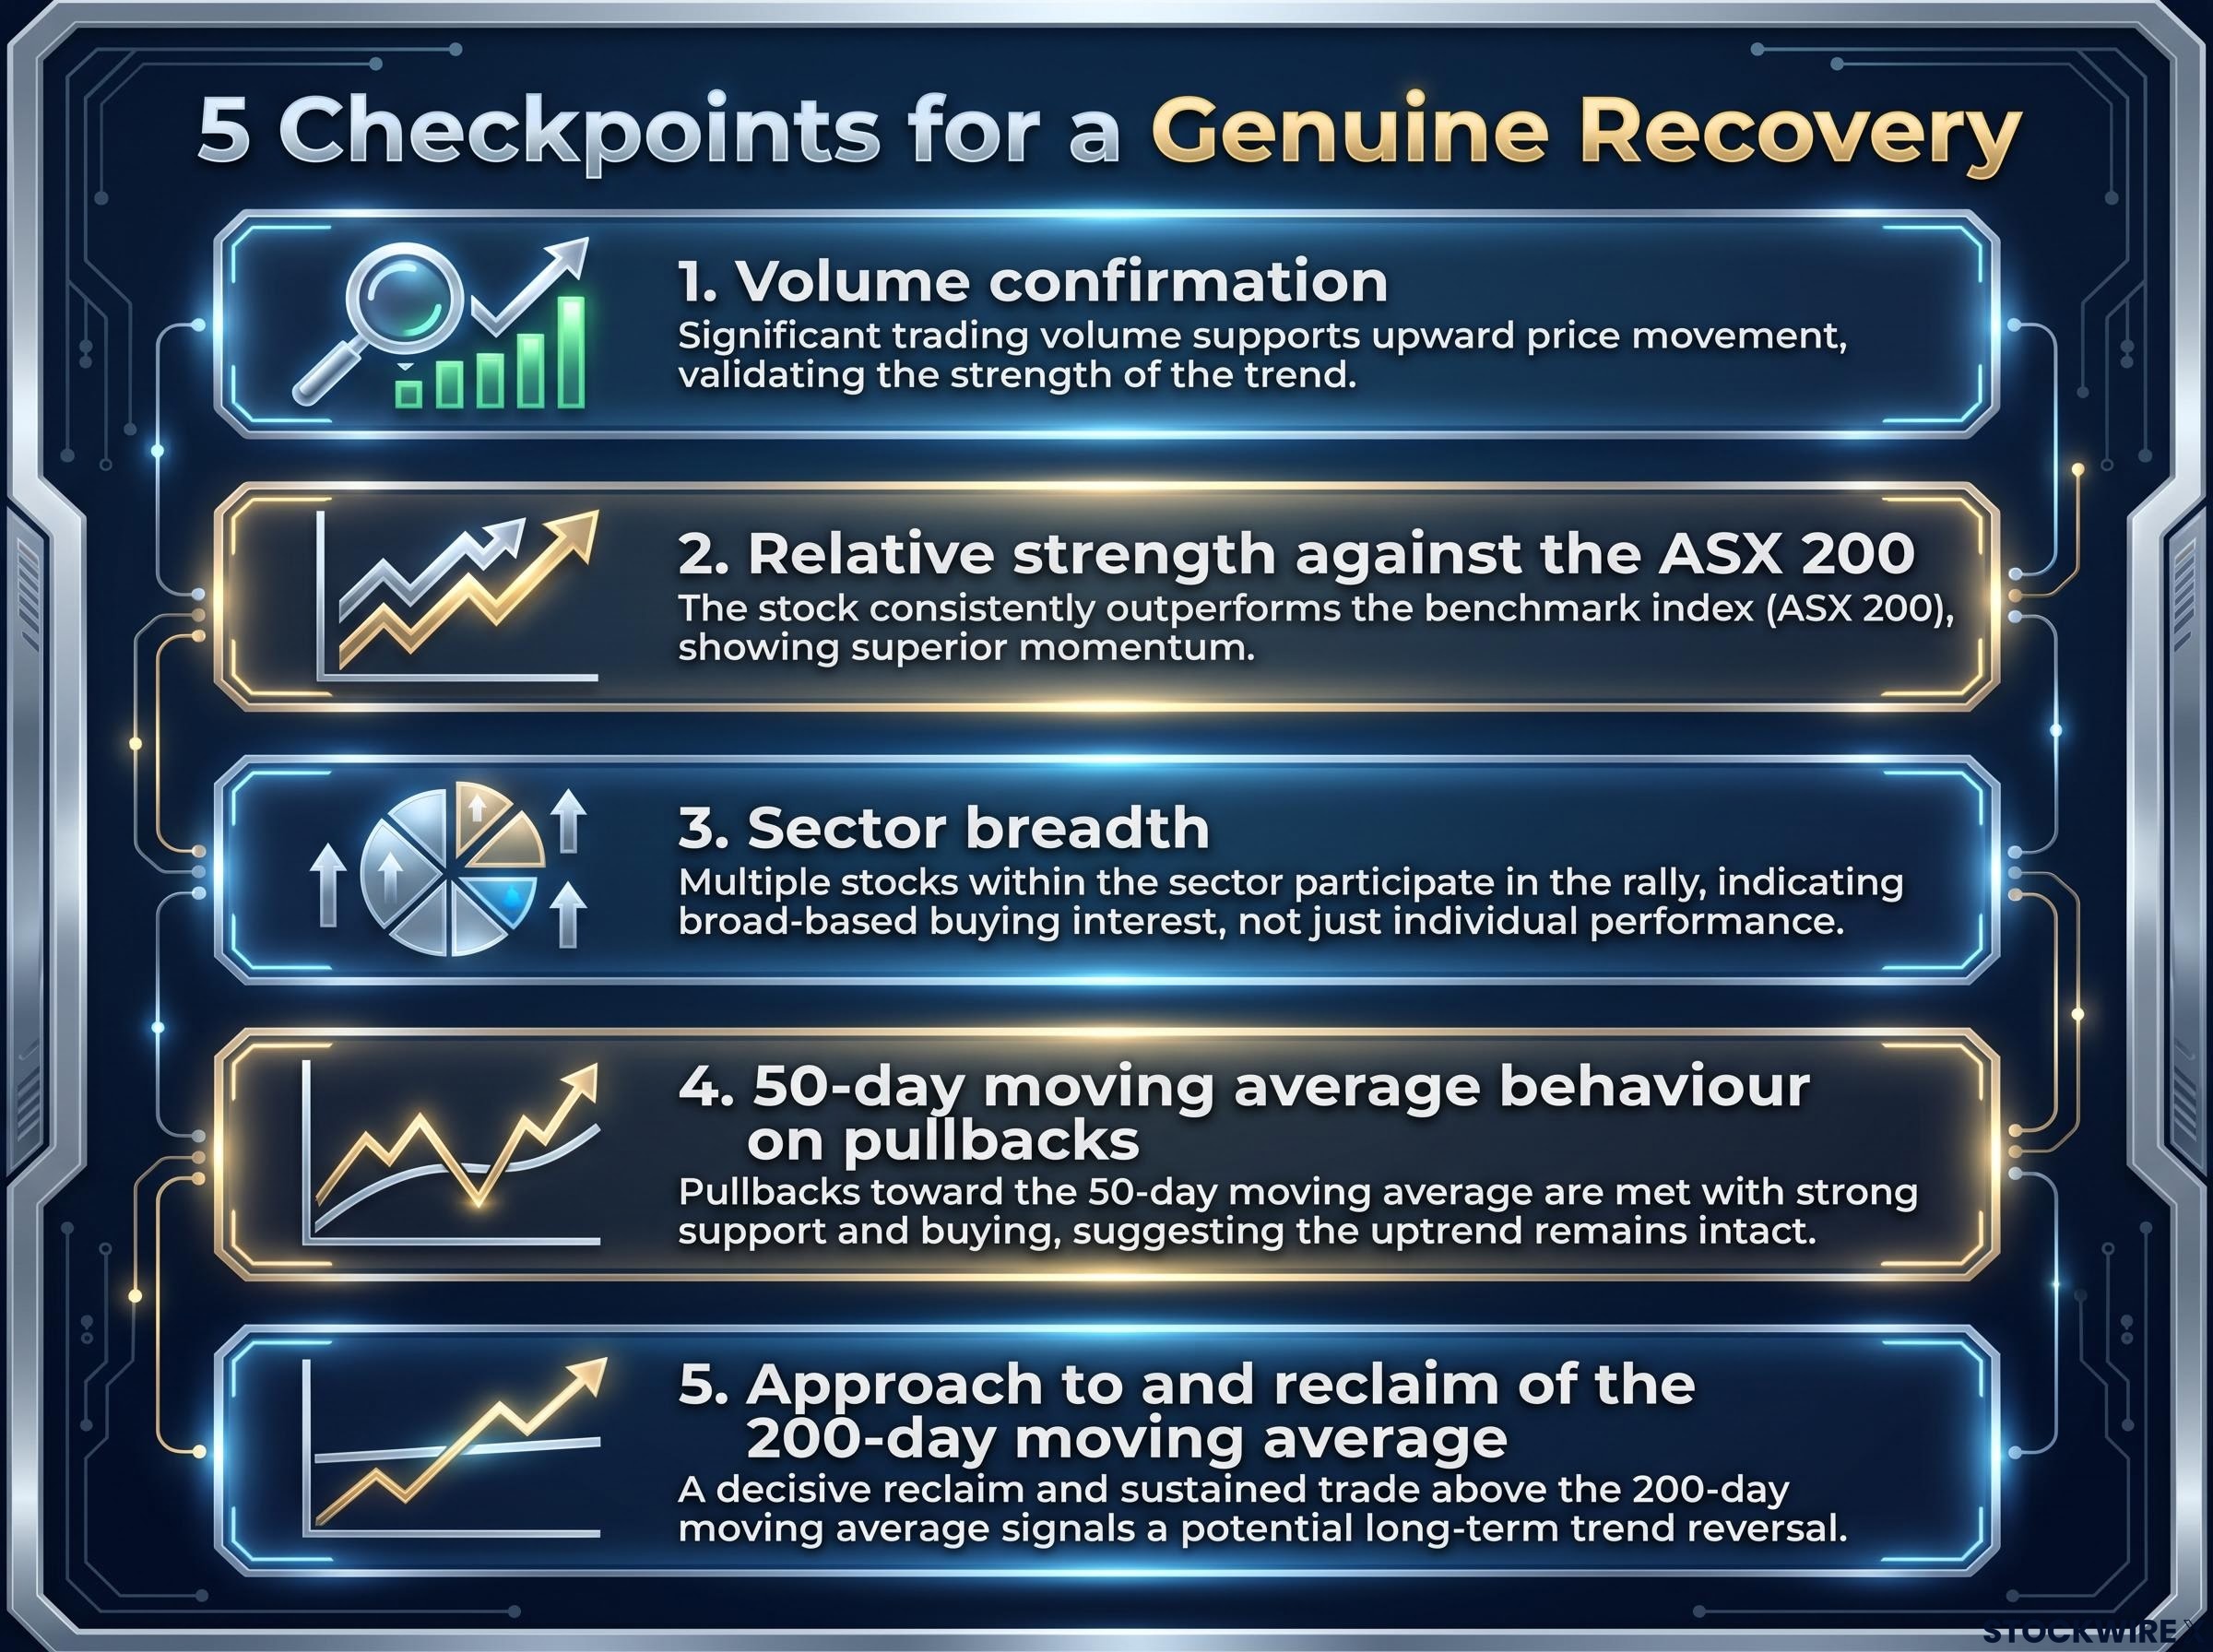
This piece lays out five objective checkpoints for distinguishing a genuine ASX healthcare sector recovery from another oversold bounce, tells you where the current evidence sits against each one, and gives you a practical framework for how to position around what comes next.
The raw numbers are real. The healthcare index has advanced approximately 13% from its 3 June 2026 low based on audited research, with some original source reporting placing the figure closer to 17%. The discrepancy likely reflects different measurement points, but the direction is not in dispute: this is the strongest short-term move the sector has produced in nearly a year.
More importantly, the index has crossed back above its 50-day moving average for the first time in roughly ten months, since August 2025. The 20-day moving average has started to turn higher, which is a pattern typically associated with the early stages of a bottoming process. For a sector stuck in a grinding downtrend, that combination is notable.
But notable is not the same as conclusive. Over the past twelve months, the healthcare index followed a repeating sequence:
The broad technical read of the index currently shows a “Neutral” outlook across moving averages from the 5-day to the 200-day, with buy and sell signals roughly balanced.
That sounds unimpressive. But for a sector that has been in sustained distribution for nearly a year, balanced signals represent a genuine shift in the weight of evidence. This is what early-stage regime change looks like before it becomes obvious.
A 50-day moving average is simply the average closing price over the prior 50 trading days. When price crosses above it, the short-term trend has shifted from down to up. But the strength of that signal depends entirely on how the cross happens.
A marginal, low-volume cross where price barely edges above the average and immediately stalls carries far less weight than a decisive break followed by consolidation above the level. For the signal to strengthen further, the 50-day average itself needs to flatten and begin to curl upward, confirming that the trend shift is not just price-driven but structurally embedded in the average’s trajectory.
The real limitation is what the 50-day moving average cannot tell you. It measures short-term trend direction, not the primary trend. The 200-day moving average, which smooths a full year of trading data, is the actual dividing line between bear-market conditions and a new bull phase.
A market trading below its 200-day moving average is statistically in a downtrend regardless of what shorter-term indicators suggest. Professional and institutional investors frequently define their risk frameworks around this level, making it a self-reinforcing threshold: when enough capital treats the 200-day as the line, it becomes the line.
Here is where the current setup becomes sobering.
ASX market breadth data from May 2026 showed 84.5% of ASX 200 constituents trading at least 10% below their 52-week highs, with Healthcare among the hardest-hit sectors alongside Consumer Discretionary and Technology — that structural context explains why a 13-17% rally still leaves CSL and Cochlear so far below their 200-day moving averages.
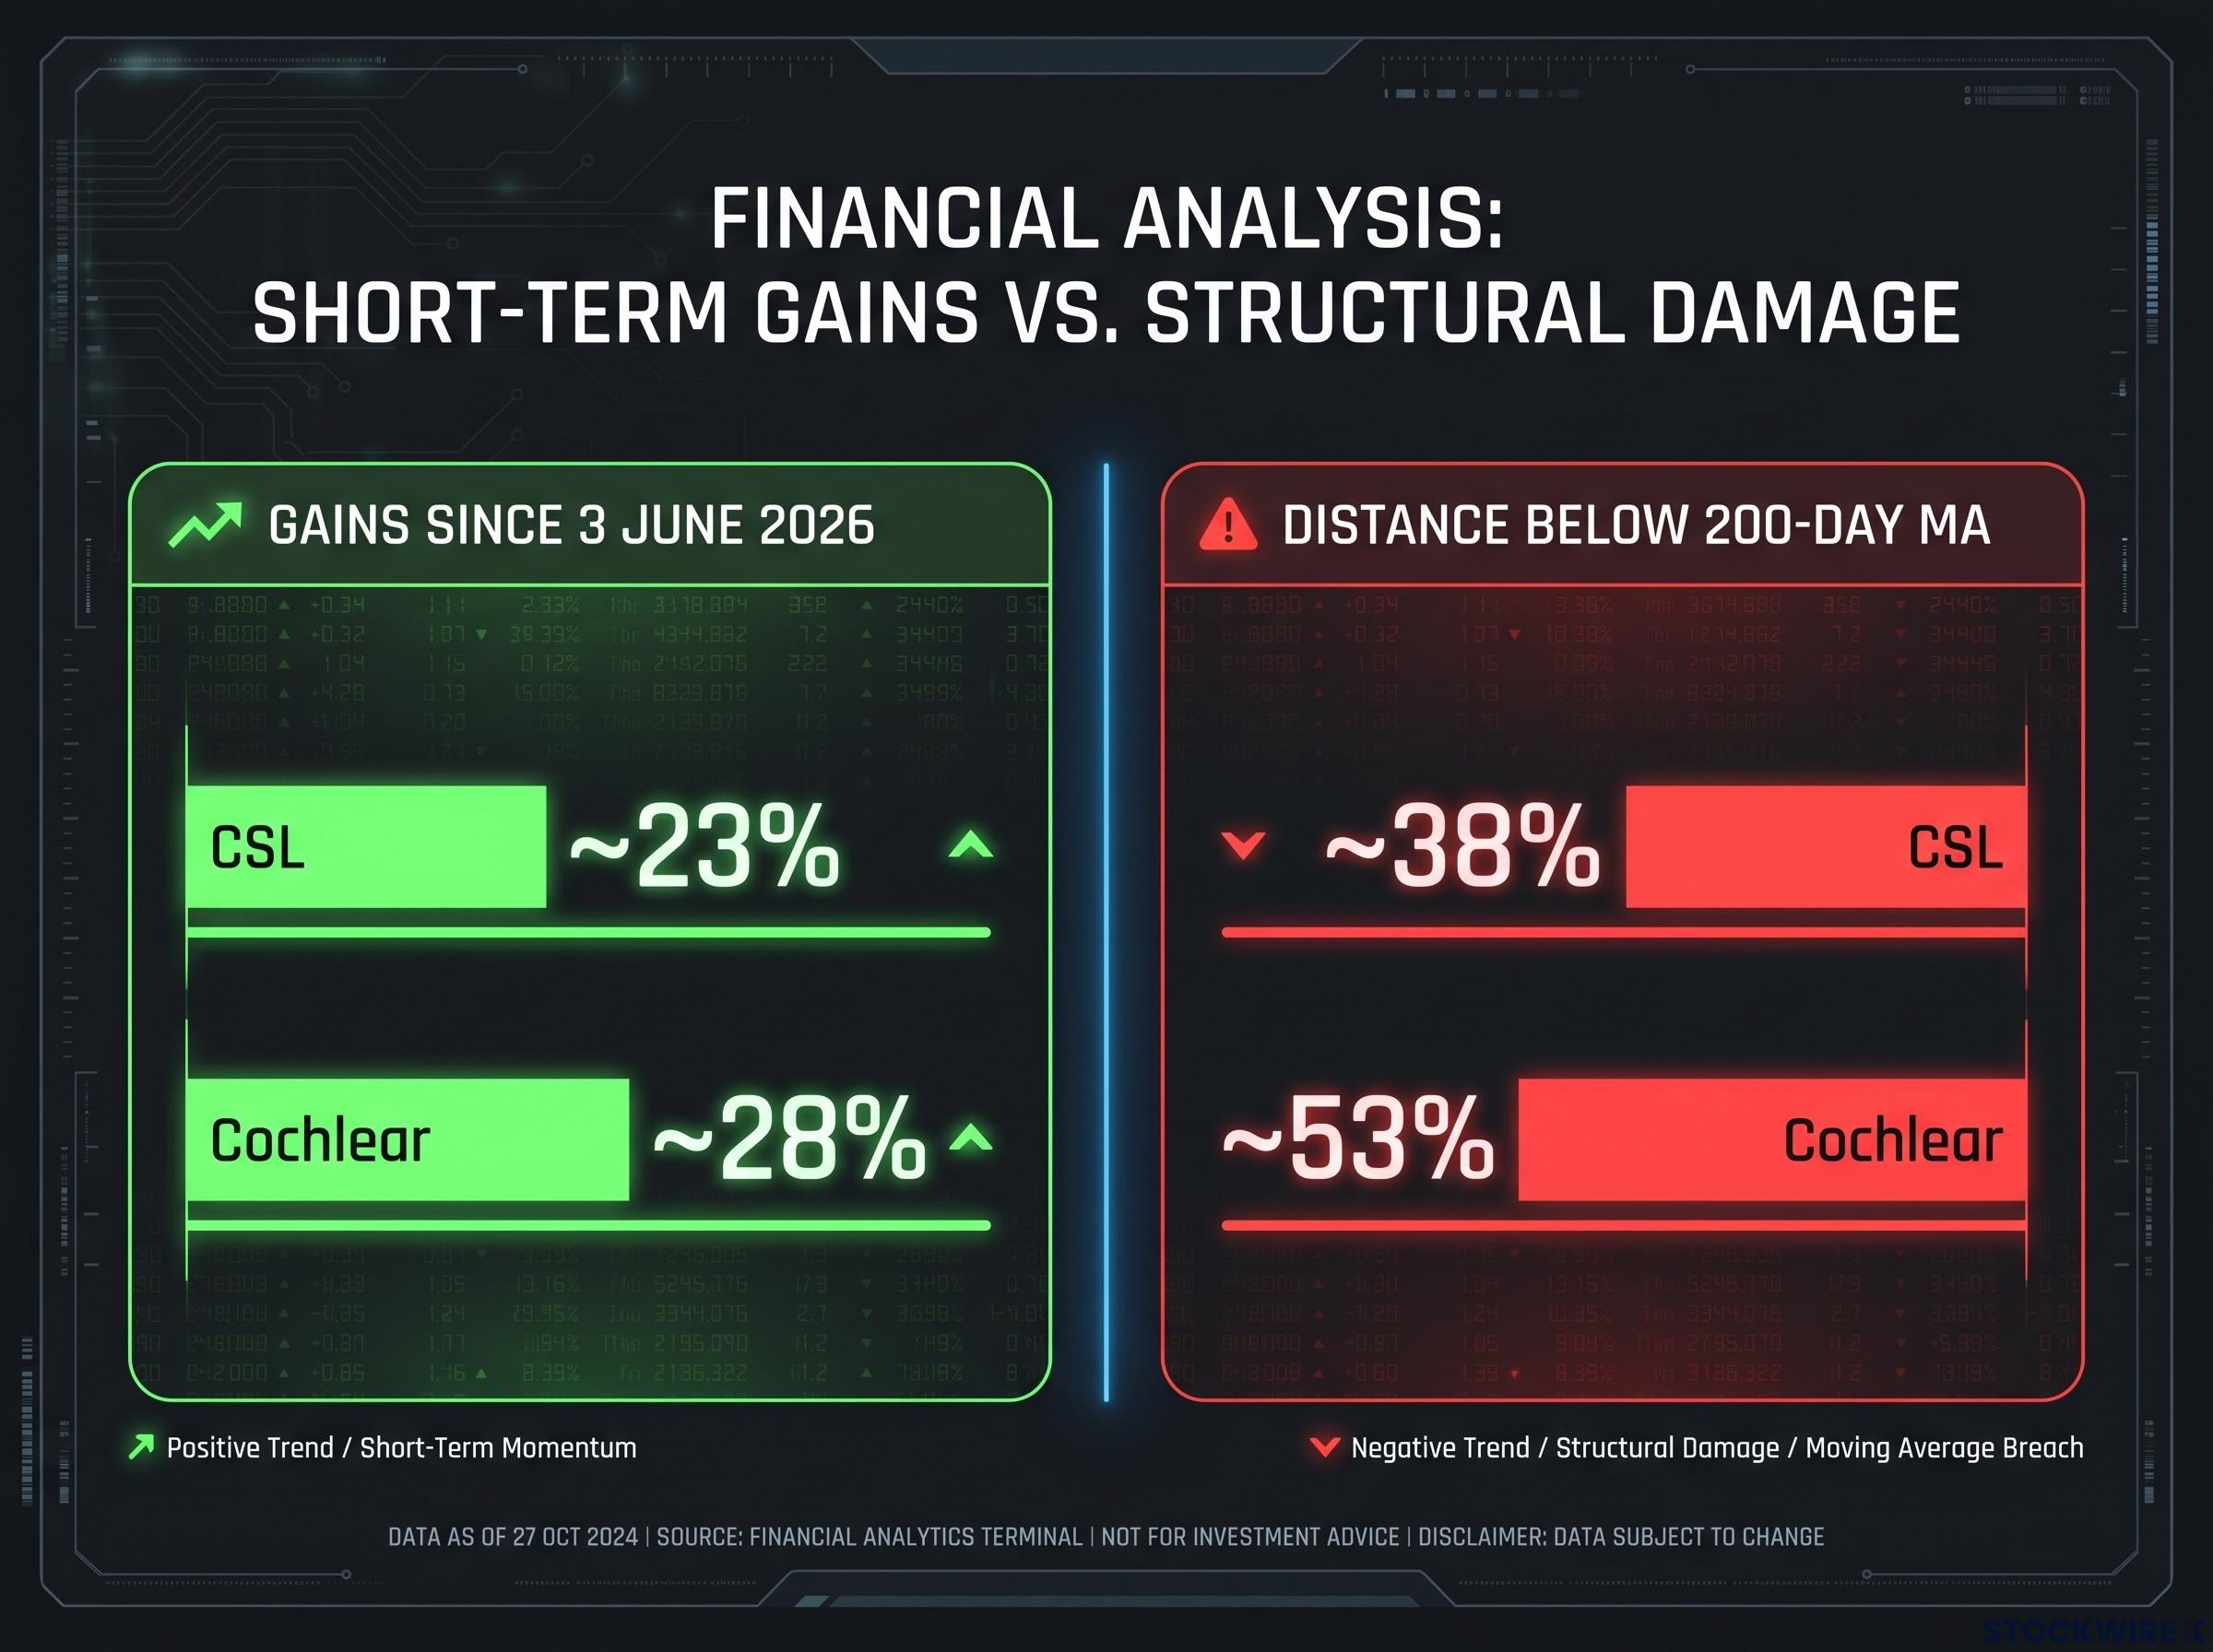
| Constituent | Gain since 3 June 2026 | Distance below 200-day MA |
|---|---|---|
| CSL | ~23% | ~38% |
| Cochlear | ~28% | ~53% |
A ~23% gain from its low still leaves CSL sitting roughly 38% below its 200-day moving average. A ~28% advance from the same point still leaves Cochlear approximately 53% adrift of that level. That tells you just how deep the structural damage in this sector has been. Hold that context before interpreting any short-term strength as confirmation of a trend change.
The required recovery sequence runs in three stages:
Until stage three occurs, the most conservative classification remains “late-stage bear-market rally” rather than “new bull trend.”
Rather than guessing whether this time is different, you can track five objective signals as the evidence develops. Two are already providing some early data. Three remain unresolved.
Each of the prior bounces over the past twelve months shared a common shape: a strong initial move off oversold conditions, apparent technical improvement as price approached the 50-day moving average, and then failure at or near that level as selling pressure resumed. The current rally has broken that pattern in one important respect by producing the first meaningful reclaim of the 50-day average since August 2025. But reclaiming it and holding it are two different things.
Sector breadth analysis from late May 2026 recorded only 13 new 52-week highs against 27 new lows across the ASX 200, with Consumer Discretionary producing zero new highs and eight new lows in the same week — illustrating how internal market deterioration can persist even when the headline index appears relatively stable.
The current characterisation: a promising but unproven recovery, not a confirmed trend change.
The supportive evidence beyond the sector’s own technicals is real. Three factors deserve credit:
The gap between Australian healthcare’s performance and that of its US counterparts over this period highlights how pronounced the local underperformance has been. A constructive global backdrop improves the probability that the recovery thesis succeeds; it does not validate it independently.
The rate-hold thesis that emerged from Westpac and NAB data in early June 2026 added a macro catalyst to the defensive rotation, with Healthcare gaining 1.32% on 9 June as capital moved into income-generating, lower-volatility sectors — providing the fundamental policy context that separates this rotation from purely technical price recovery.
The simultaneous defensive rotation across three ASX sectors is the most credible external support for the recovery thesis because it suggests deliberate capital repositioning, not just an isolated technical bounce. But neither the rotation nor the US context settles the argument on its own.
The most practical implication of this setup is that the burden of proof sits differently depending on which direction you are exposed. For longs, the technical environment now provides a defensible reference point for managing downside. For potential new buyers, patience for a retest costs very little given how far the index has already moved.
For readers wanting to map the current technical setup against the broader ASX 200 structure, our full explainer on ASX 200 supply zone positioning covers how the 8,984-9,022 overhead supply band interacts with sector-level risk allocation decisions, including pre-mapped entry and exit triggers for both the upside break and the downside failure scenarios.
The rally from the 3 June 2026 low, accompanied by the first meaningful reclaim of the 50-day moving average since August 2025, is the most credible bottoming signal the ASX healthcare sector has produced in approximately one year. It is broad enough at the constituent level to be notable: CSL up roughly 23%, Cochlear up roughly 28%, both from the same low. The short- and intermediate-term trend has improved.
The secular trend has not yet flipped. CSL remains approximately 38% below its 200-day moving average. Cochlear remains approximately 53% below. The same data that makes the recovery case credible also makes it look like every prior bear-market bounce that eventually failed. The evidence does not yet resolve that ambiguity.
| Bull case confirmation signals | Bear case reinstatement signals |
|---|---|
| Sustained trade above 50-day MA on healthy volume | Decisive loss of the 50-day MA |
| Improving sector breadth across constituents | Deteriorating breadth, fewer names participating |
| Continued relative outperformance vs ASX 200 | Renewed relative underperformance vs ASX 200 |
| Gradual approach toward the 200-day MA | Pattern consistent with prior failed rallies |
The rally is real and technically significant, but until the sector can sustain strength through the 200-day moving average with improving breadth and relative performance, it must still be treated as a potential bear-market relief rally rather than a fully confirmed sector recovery.
The five checkpoints outlined above give you a forward-looking diagnostic rather than a snapshot opinion. Track them as new data arrives. The picture will resolve itself; the framework ensures you are watching the right signals when it does.
This article is for informational purposes only and should not be considered financial advice. Investors should conduct their own research and consult with financial professionals before making investment decisions. Past performance does not guarantee future results, and technical analysis is subject to market conditions and various risk factors.
A cross above the 50-day moving average signals that the sector's short-term trend has shifted from down to up, but it only confirms the primary trend has changed when the sector can also approach and hold above the much longer 200-day moving average, which remains far above current price levels for CSL and Cochlear.
Despite CSL gaining roughly 23% and Cochlear gaining roughly 28% from their 3 June 2026 lows, CSL still sits approximately 38% below its 200-day moving average and Cochlear approximately 53% below, reflecting the depth of structural damage accumulated over the past year.
Five checkpoints matter: expanding volume on up-days, sustained relative outperformance against the ASX 200, broad participation across sector constituents, price holding above the 50-day moving average on pullbacks, and ultimately a break and hold above the 200-day moving average with that average beginning to flatten and turn higher.
ASX market breadth data from May 2026 showed 84.5% of ASX 200 constituents trading at least 10% below their 52-week highs, with Healthcare among the hardest-hit sectors alongside Consumer Discretionary and Technology, a sustained period of distribution that repeatedly produced short-term relief bounces before rolling back to new lows.
The reclaimed 50-day moving average serves as the active risk management reference: a decisive close back below it (sustained, not just an intraday spike) is the logical trigger to reassess exposure or tighten stops, while price holding above a stabilising or rising 50-day average incrementally strengthens the case for staying invested.