Why AI Infrastructure, Not Chips, Is Where Durable Value Sits
2 hrs ago

The assumption behind the most widely held portfolio structure in America just hit a 30-year stress point. UBS research published on 27 June 2026 shows the stock-bond correlation has fallen to its most extreme negative reading since 1996, a finding that goes directly to whether bonds can still do the job tens of millions of retirement investors are counting on them to do.
That matters because the 60/40 portfolio, the allocation split between equities and government bonds, is not a niche strategy. It sits inside target-date funds, advisor-managed retirement accounts, and self-directed brokerage portfolios across the country. When the relationship between its two components breaks down, the consequences are not theoretical. They show up in real drawdowns on real statements.
Here is what this correlation reading actually means, why it is happening, and which specific indicators tell you whether conditions are about to get worse or start normalising. Consider it a practical map for the months ahead.
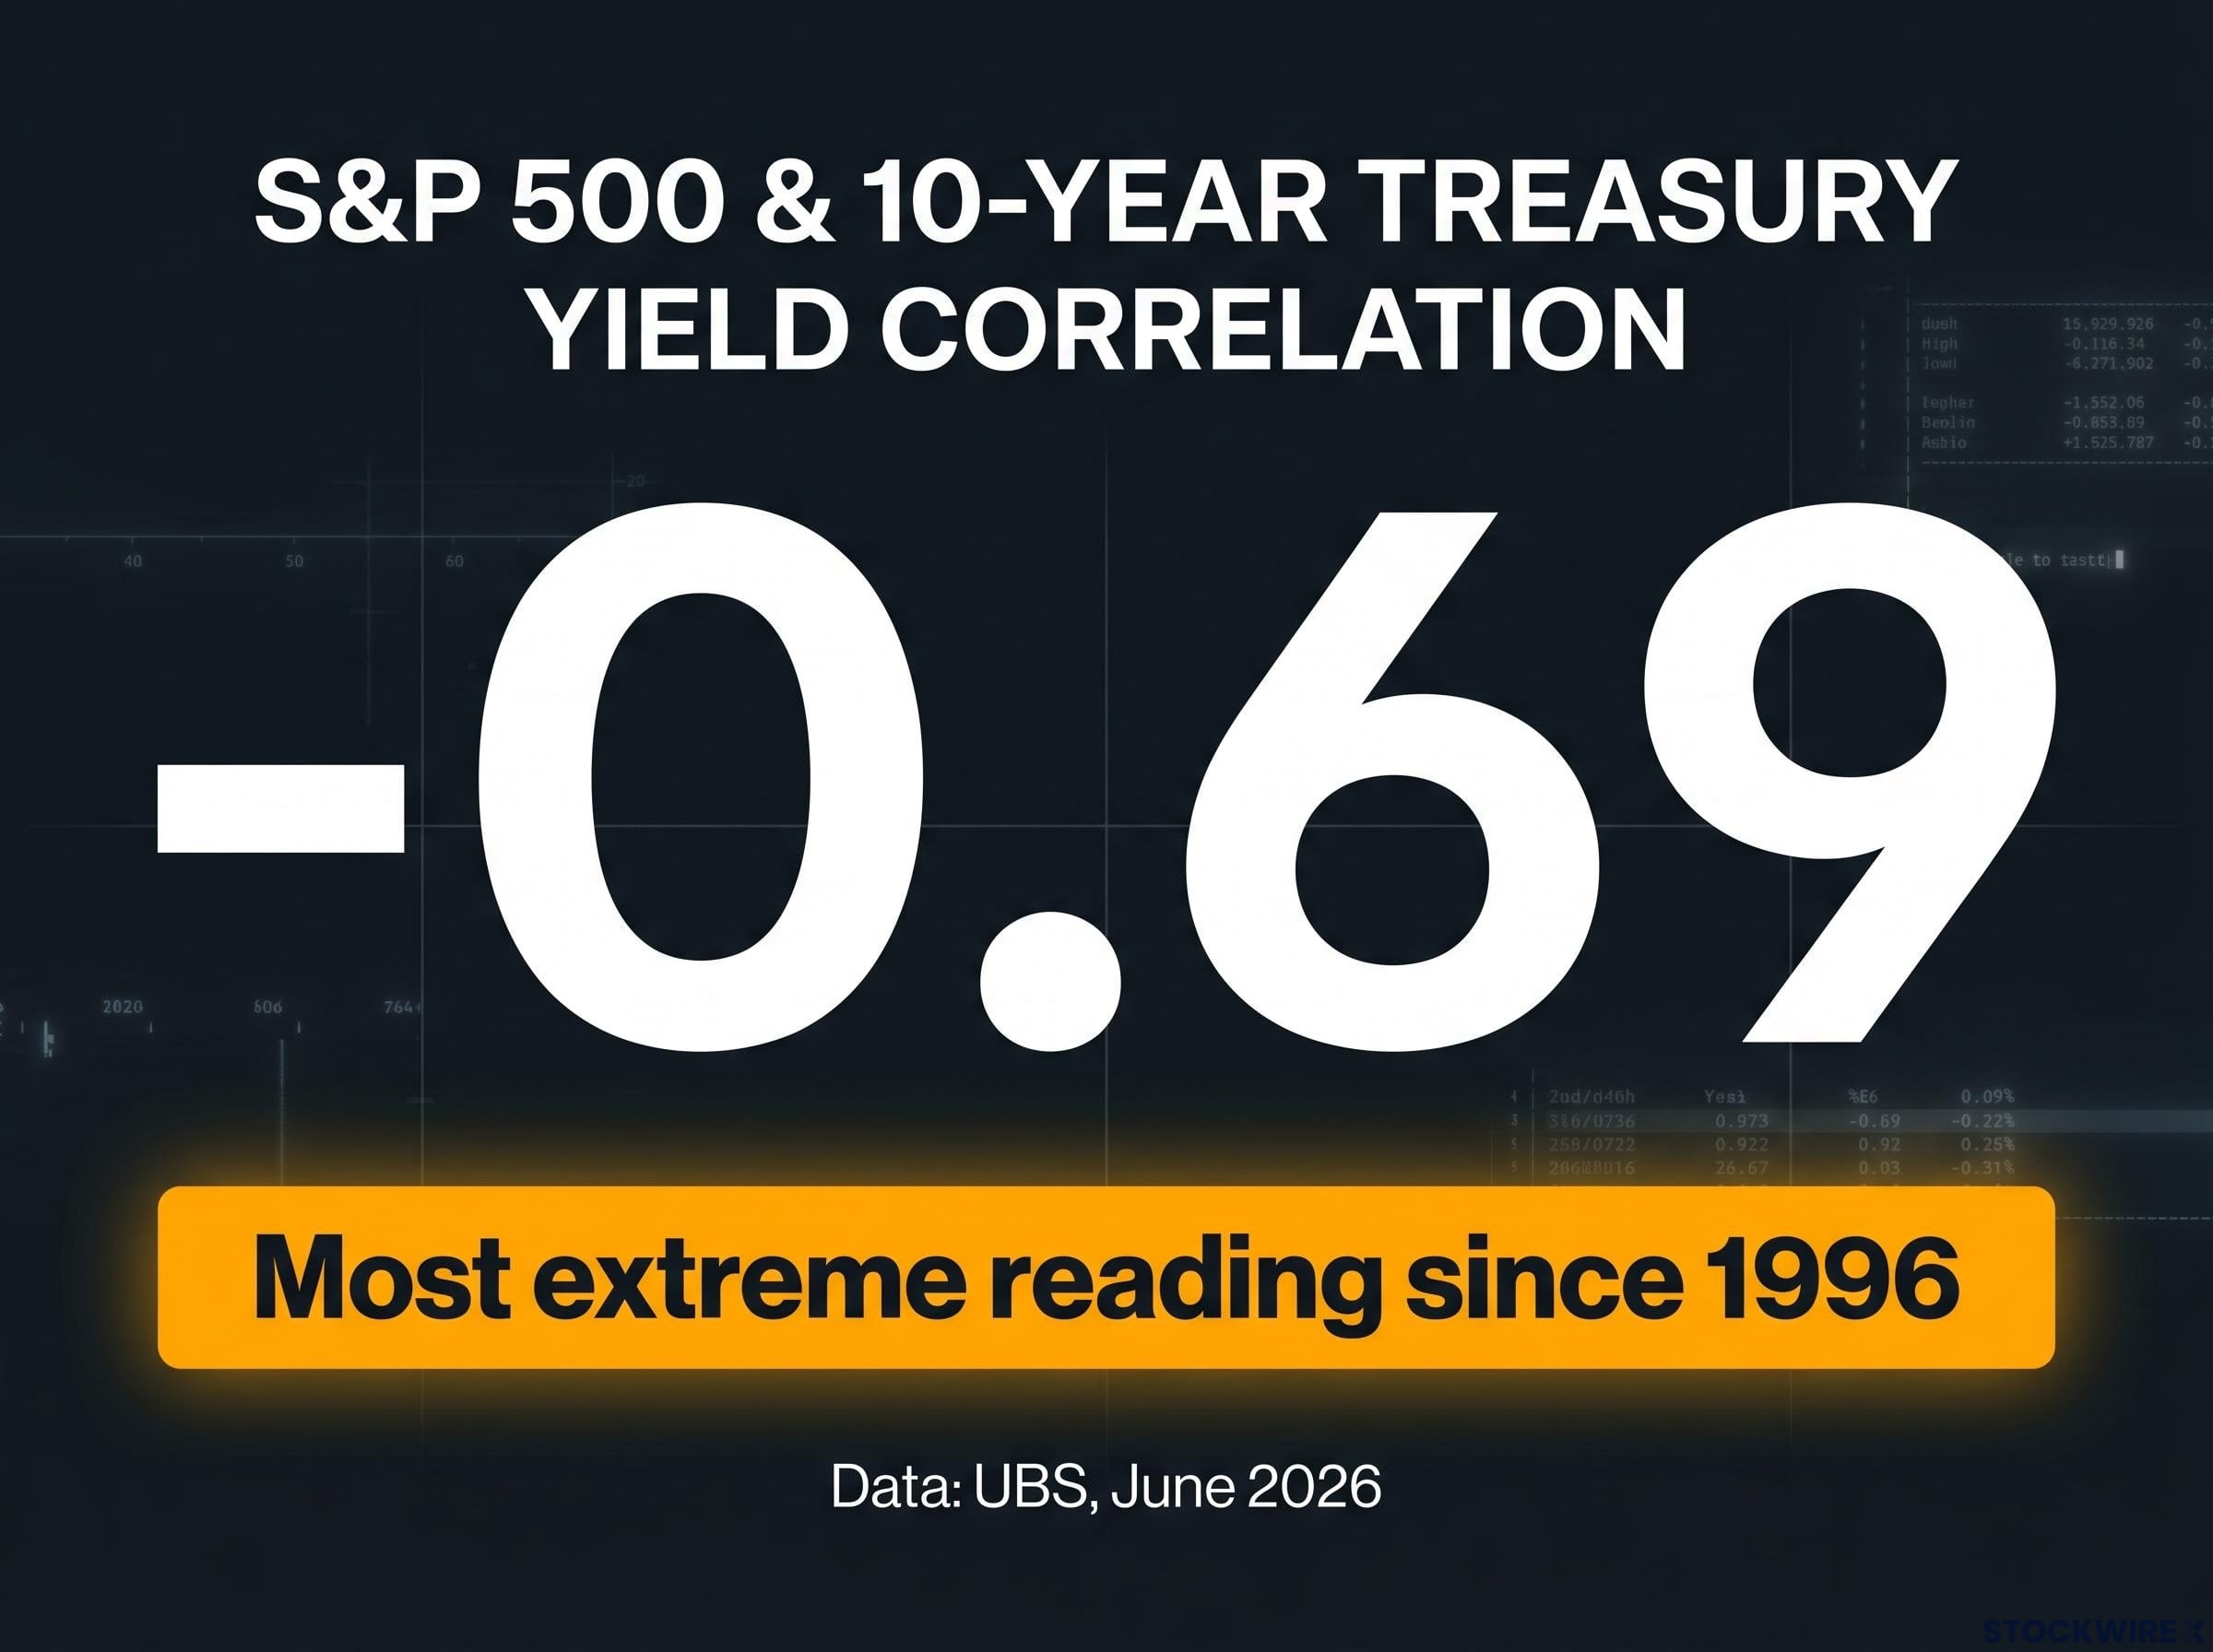
UBS research puts the two-month rolling correlation between the S&P 500 and the 10-Year Treasury yield at -0.69 as of late June 2026, a figure the bank describes as the most extreme in roughly three decades, with no comparable reading since 1996.
The key finding: A correlation of -0.69 between the S&P 500 and the 10-Year Treasury yield is the most extreme reading since 1996, roughly 30 years of historical data. Source: UBS, via Investing.com (Roushni Nair), 27 June 2026.
A deeply negative correlation might sound like good diversification on its surface. It is not, at least not in this context. What the reading tells you is that a single macro force, inflation and interest-rate expectations, has taken over as the primary driver of both asset classes simultaneously. That force is capable of moving both asset classes downward at once, which is the exact opposite of what a 60/40 investor is counting on. The correlation is not drifting. It is at a statistical extreme, and it demands attention.
For most of the period after 2008, the mechanism was straightforward. When equities sold off, it was typically because of growth fears. The Federal Reserve responded by cutting rates. Bond prices rose as yields fell, and the 40% bond allocation inside a balanced portfolio absorbed the equity losses. That is the world most investors still carry in their heads.
Sustained inflation above a specific threshold breaks that mechanism. When inflation runs hot, the Fed’s response shifts from rate cuts to rate holds or rate hikes. When rate expectations move higher, bond prices fall because of the inverse relationship between prices and yields, while equity valuations are simultaneously squeezed as higher borrowing costs weigh on corporate earnings and reduce the appeal of pricier stocks. Both sides of the portfolio take damage at the same time.
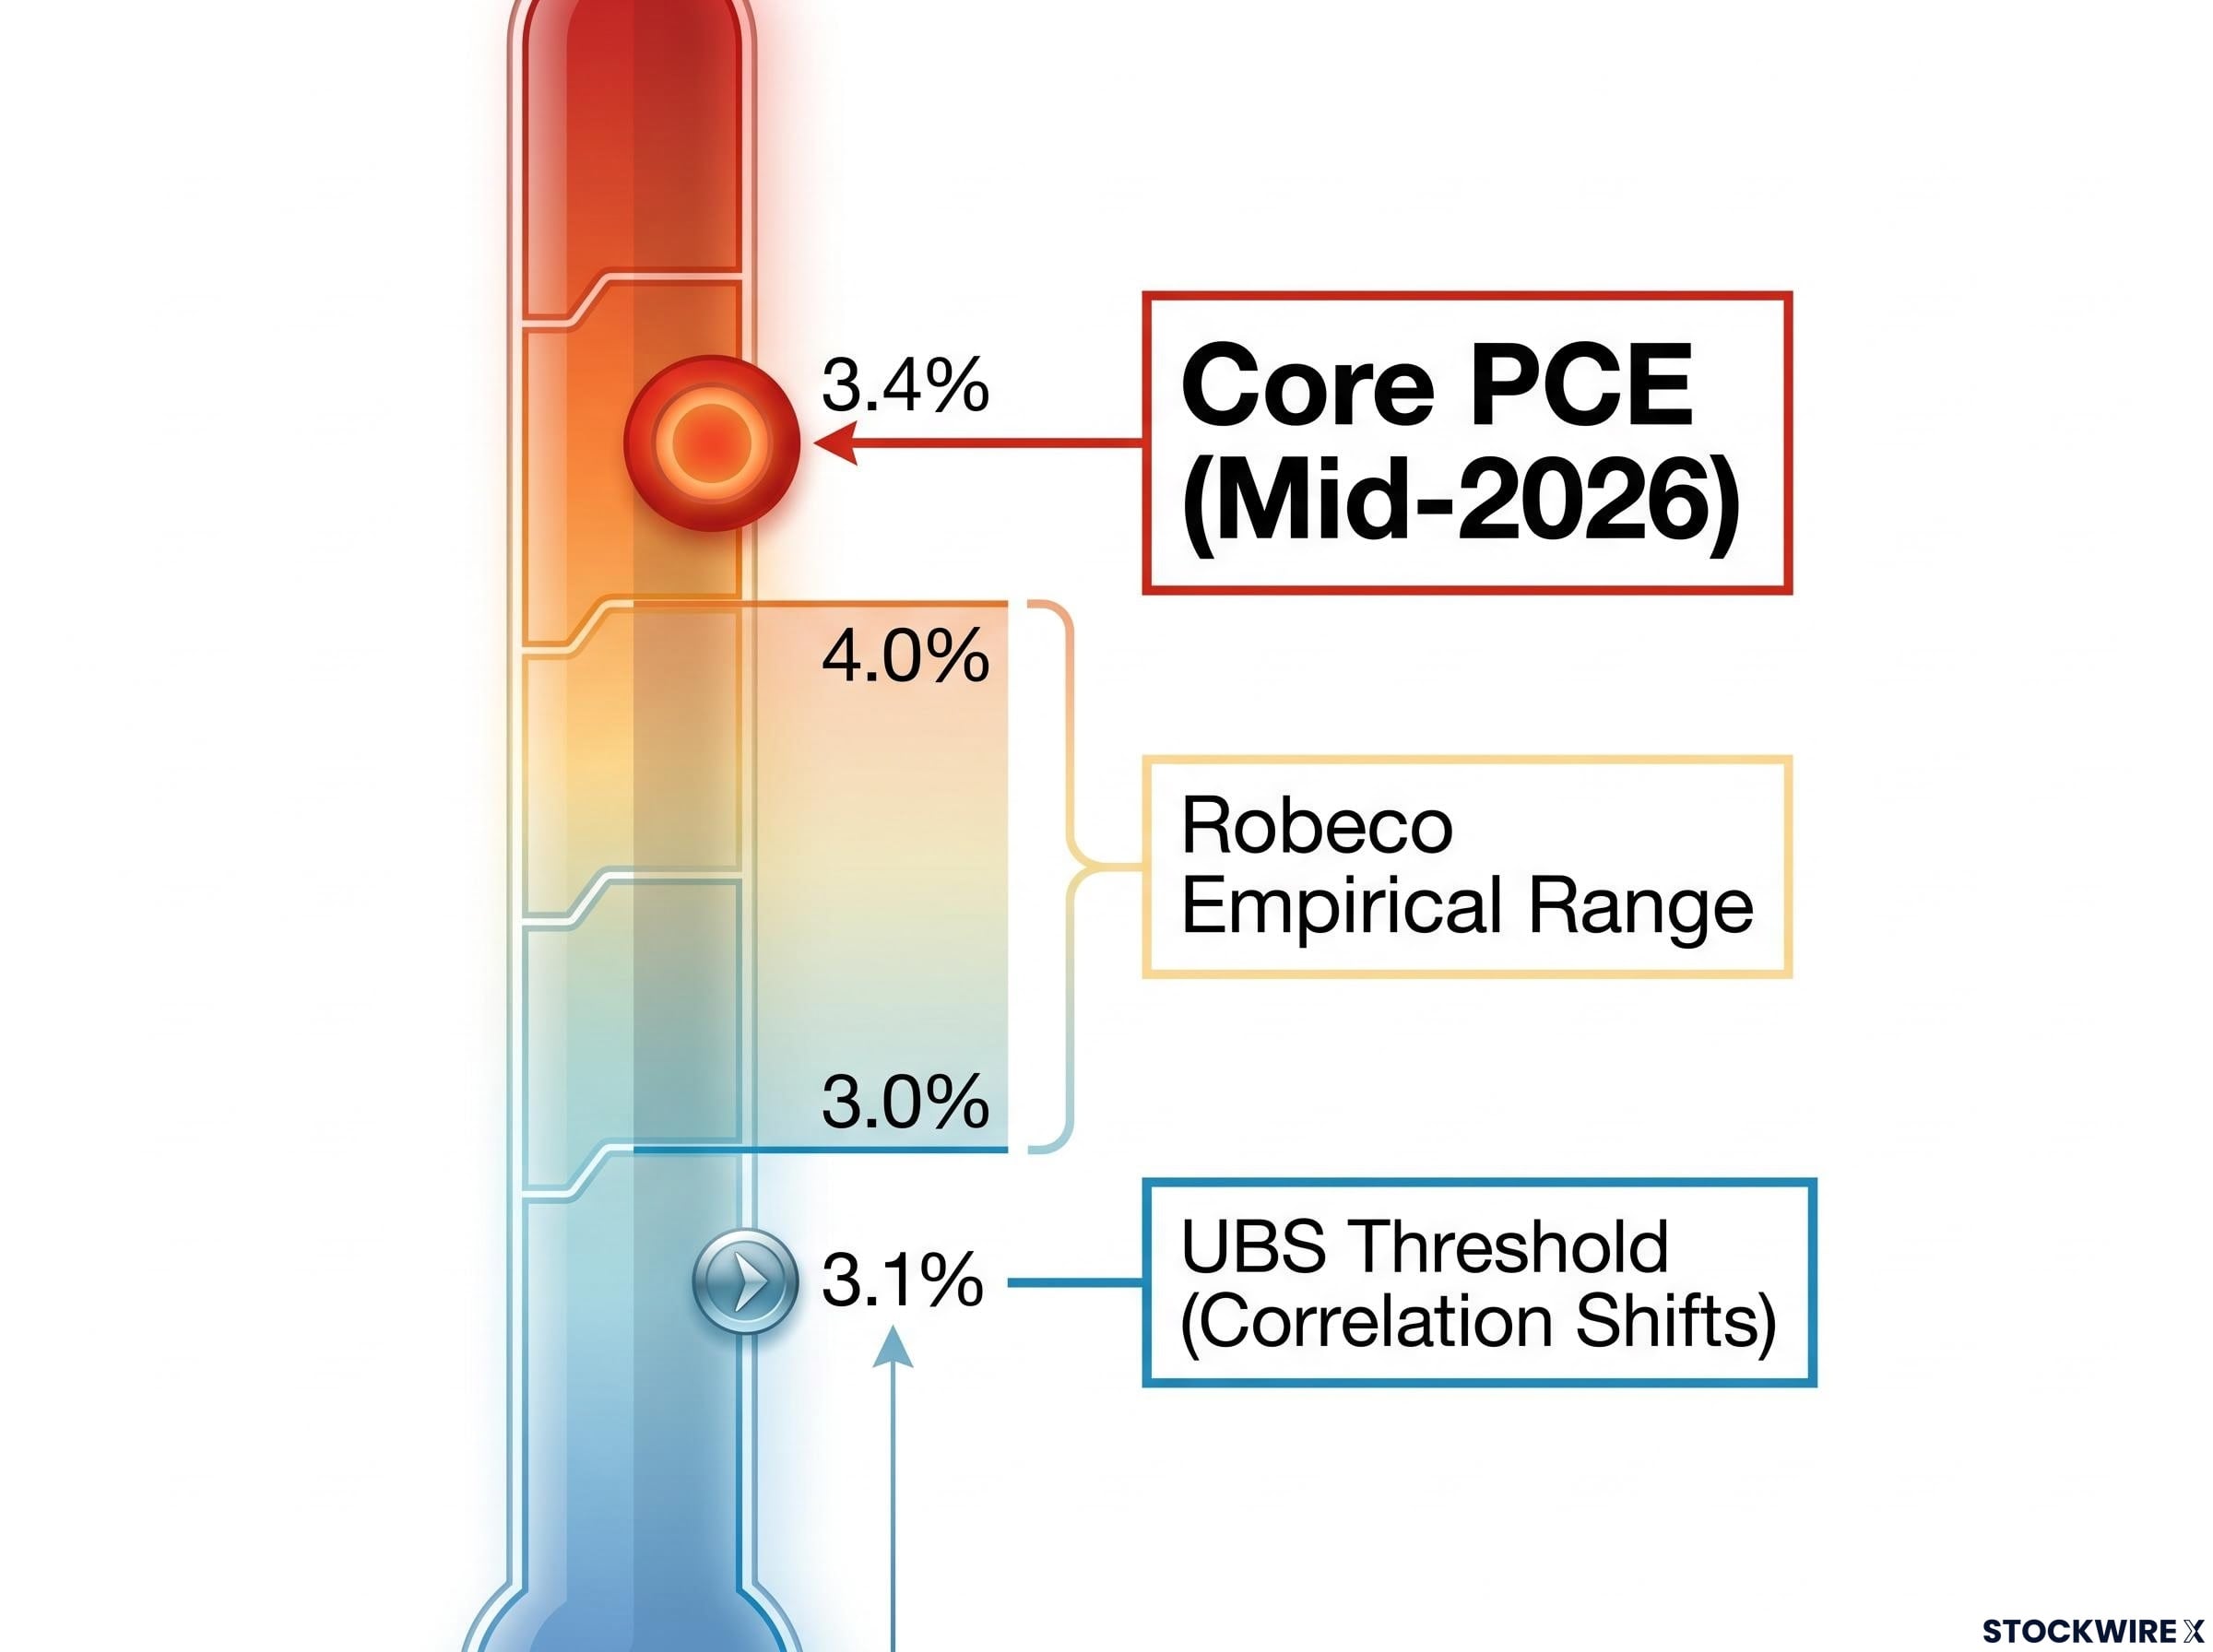
UBS identifies the threshold where this regime shift occurs:
As long as core PCE stays above 3.1%, the conditions driving this breakdown persist. The bond sleeve in a 60/40 portfolio remains an unreliable shock absorber, and the assumption that it will cushion equity losses carries materially more risk than it did in the post-2008 era.
The 60/40 portfolio assumptions that underpinned the strategy’s four-decade track record were stress-tested severely in 2022, when a positive stock-bond correlation during an inflationary shock produced roughly 20% losses and exposed a structural dependency most investors had never needed to think about.
The Federal Reserve held the federal funds target range at 3.50%-3.75% following its June 2026 FOMC meeting. According to UBS, further rate hikes are not the central forecast. But the absence of hikes is not the same as the absence of damage.
The key dynamic here is driven by market expectations rather than actual policy action. Markets pricing in a greater likelihood of further tightening push yields upward in advance. No actual policy change is required. As yield expectations shift higher, existing bond prices fall and the discount rate applied to future equity earnings rises, compressing valuations across the portfolio. Both halves can suffer before the Fed has moved a single basis point.
The June 2026 dot plot‘s upward revision from a 3.4% to a 3.8% year-end rate projection put at least one additional 25 basis point hike into the Fed’s own baseline, a shift that markets absorbed through the yield curve even before any actual policy action occurred.
UBS characterises the current period as a possible entry into a different market regime, one that diverges from the low-inflation, accommodative-policy environment that shaped the prior three years. Strategies calibrated to that earlier backdrop may no longer be suited to the conditions investors face today.
For you, the implication is direct: even if the Fed holds rates steady from here, the mere possibility of further hikes is enough to damage both halves of a 60/40 allocation. The risk is not conditional on a specific policy decision. It is already priced into the yield curve.
On paper, a 60/40 portfolio is two distinct risk engines: equities for growth and bonds for stability. In practice, when both asset classes are driven by the same inflation and rate expectations, those two engines collapse into one.
UBS specifically cautions that in these conditions, investors reducing overall exposure tend to sell both stocks and bonds at once, and that coordinated selling can produce a self-reinforcing downward spiral across both markets. Investors looking to reduce overall exposure sell both at once, amplifying drawdowns beyond what the historical 60/40 record would suggest is normal. The portfolio’s real risk profile has shifted even if the numbers on a statement page have not.
The synchronised global bond selloff that pushed the US 10-year Treasury near 4.60%, UK 30-year gilts to a 28-year high, and Japanese JGBs to a record in May 2026 demonstrated that yield pressure is not an isolated domestic phenomenon, with reinforcing drivers including above-consensus US inflation data, elevated energy prices, and geopolitical risk premia operating simultaneously across markets.
| Market environment | Stock-bond correlation behaviour | 60/40 portfolio outcome |
|---|---|---|
| Post-2008 low-inflation era | Negative: bonds rally when stocks fall, driven by growth fears and Fed rate cuts | Bonds absorb equity losses; portfolio volatility stays contained |
| High-inflation regime (current) | Unstable to positive: both fall simultaneously, driven by inflation and rate expectations | Both sides take damage; portfolio behaves as a concentrated macro bet |
For retirees and target-date fund investors in particular, the sequence-of-returns risk (the danger that losses arrive at the worst possible time relative to withdrawals) is materially higher than the historical experience of the 60/40 model would suggest. The protection you thought you had is not what it was.
The analytical framework above gives you the diagnosis. What follows is the monitoring checklist that tells you whether conditions are normalising or deteriorating further.
Inflation data and central bank signals now deserve a place alongside corporate earnings on the balanced-portfolio investor’s watchlist. The next CPI or PCE release carries direct allocation implications, and that represents a genuine change in what you need to monitor.
The UBS research does not declare 60/40 obsolete. But it makes clear that static reliance on bonds as the primary diversifier carries materially more risk in the current inflation-and-rate-driven regime than it did in the post-2008 world where the strategy was broadly validated.
Complementary exposures that have historically shown lower correlation to both equities and conventional bonds in inflationary environments include:
Each of these carries its own risks and complexities. None is a straightforward replacement for bonds.
The honest implication is that 60/40 now requires active justification against the current environment rather than passive confidence in historical precedent. Any allocation changes should be made in consultation with a qualified financial professional, with specific attention to your time horizon, liquidity needs, and individual risk tolerance.
For retirees and investors in drawdown phase who want to examine how current correlation conditions interact with their specific time horizon and withdrawal schedule, our dedicated guide to retirement asset allocation covers why age-based heuristics are inadequate and which income-driven frameworks major institutions now endorse as replacements.
This article is for informational purposes only and should not be considered financial advice. Investors should conduct their own research and consult with financial professionals before making investment decisions. Past performance does not guarantee future results. Financial projections are subject to market conditions and various risk factors.
The 60/40 portfolio breakdown refers to the failure of government bonds to cushion equity losses, which is the core function bonds are supposed to serve in a balanced portfolio. It matters now because UBS research shows the S&P 500 and 10-Year Treasury yield correlation has reached its most extreme negative reading since 1996, meaning a single macro force, inflation and rate expectations, is driving both asset classes downward simultaneously.
UBS identifies approximately 3.1% as the threshold at which the stock-bond correlation shifts toward positive territory, which is detrimental for diversification. With core PCE sitting near 3.4% as of mid-2026, conditions remain clearly above that threshold, meaning the breakdown persists.
The Fed held its target range at 3.50%-3.75% after its June 2026 FOMC meeting, but actual rate hikes are not required to cause damage. Markets pricing in a greater likelihood of further tightening push yields higher in advance, which simultaneously depresses bond prices and compresses equity valuations, hitting both halves of a 60/40 portfolio before the Fed moves a single basis point.
The four key signals are: 10-year Treasury yield movements, CPI and PCE releases relative to the 3.1% threshold, Fed communications including FOMC meetings and speeches, and global central bank actions that can redirect capital flows and influence US yield curves. A sustained core PCE reading below 3.1% is the clearest indicator that the correlation regime could begin to normalise.
UBS and related research point to real assets such as physical property and infrastructure, commodities, Treasury Inflation-Protected Securities (TIPS), and alternative strategies like managed futures or market-neutral funds as exposures that have historically shown lower correlation to both equities and conventional bonds during inflationary periods. Each carries its own risks and none is a straightforward replacement for bonds.