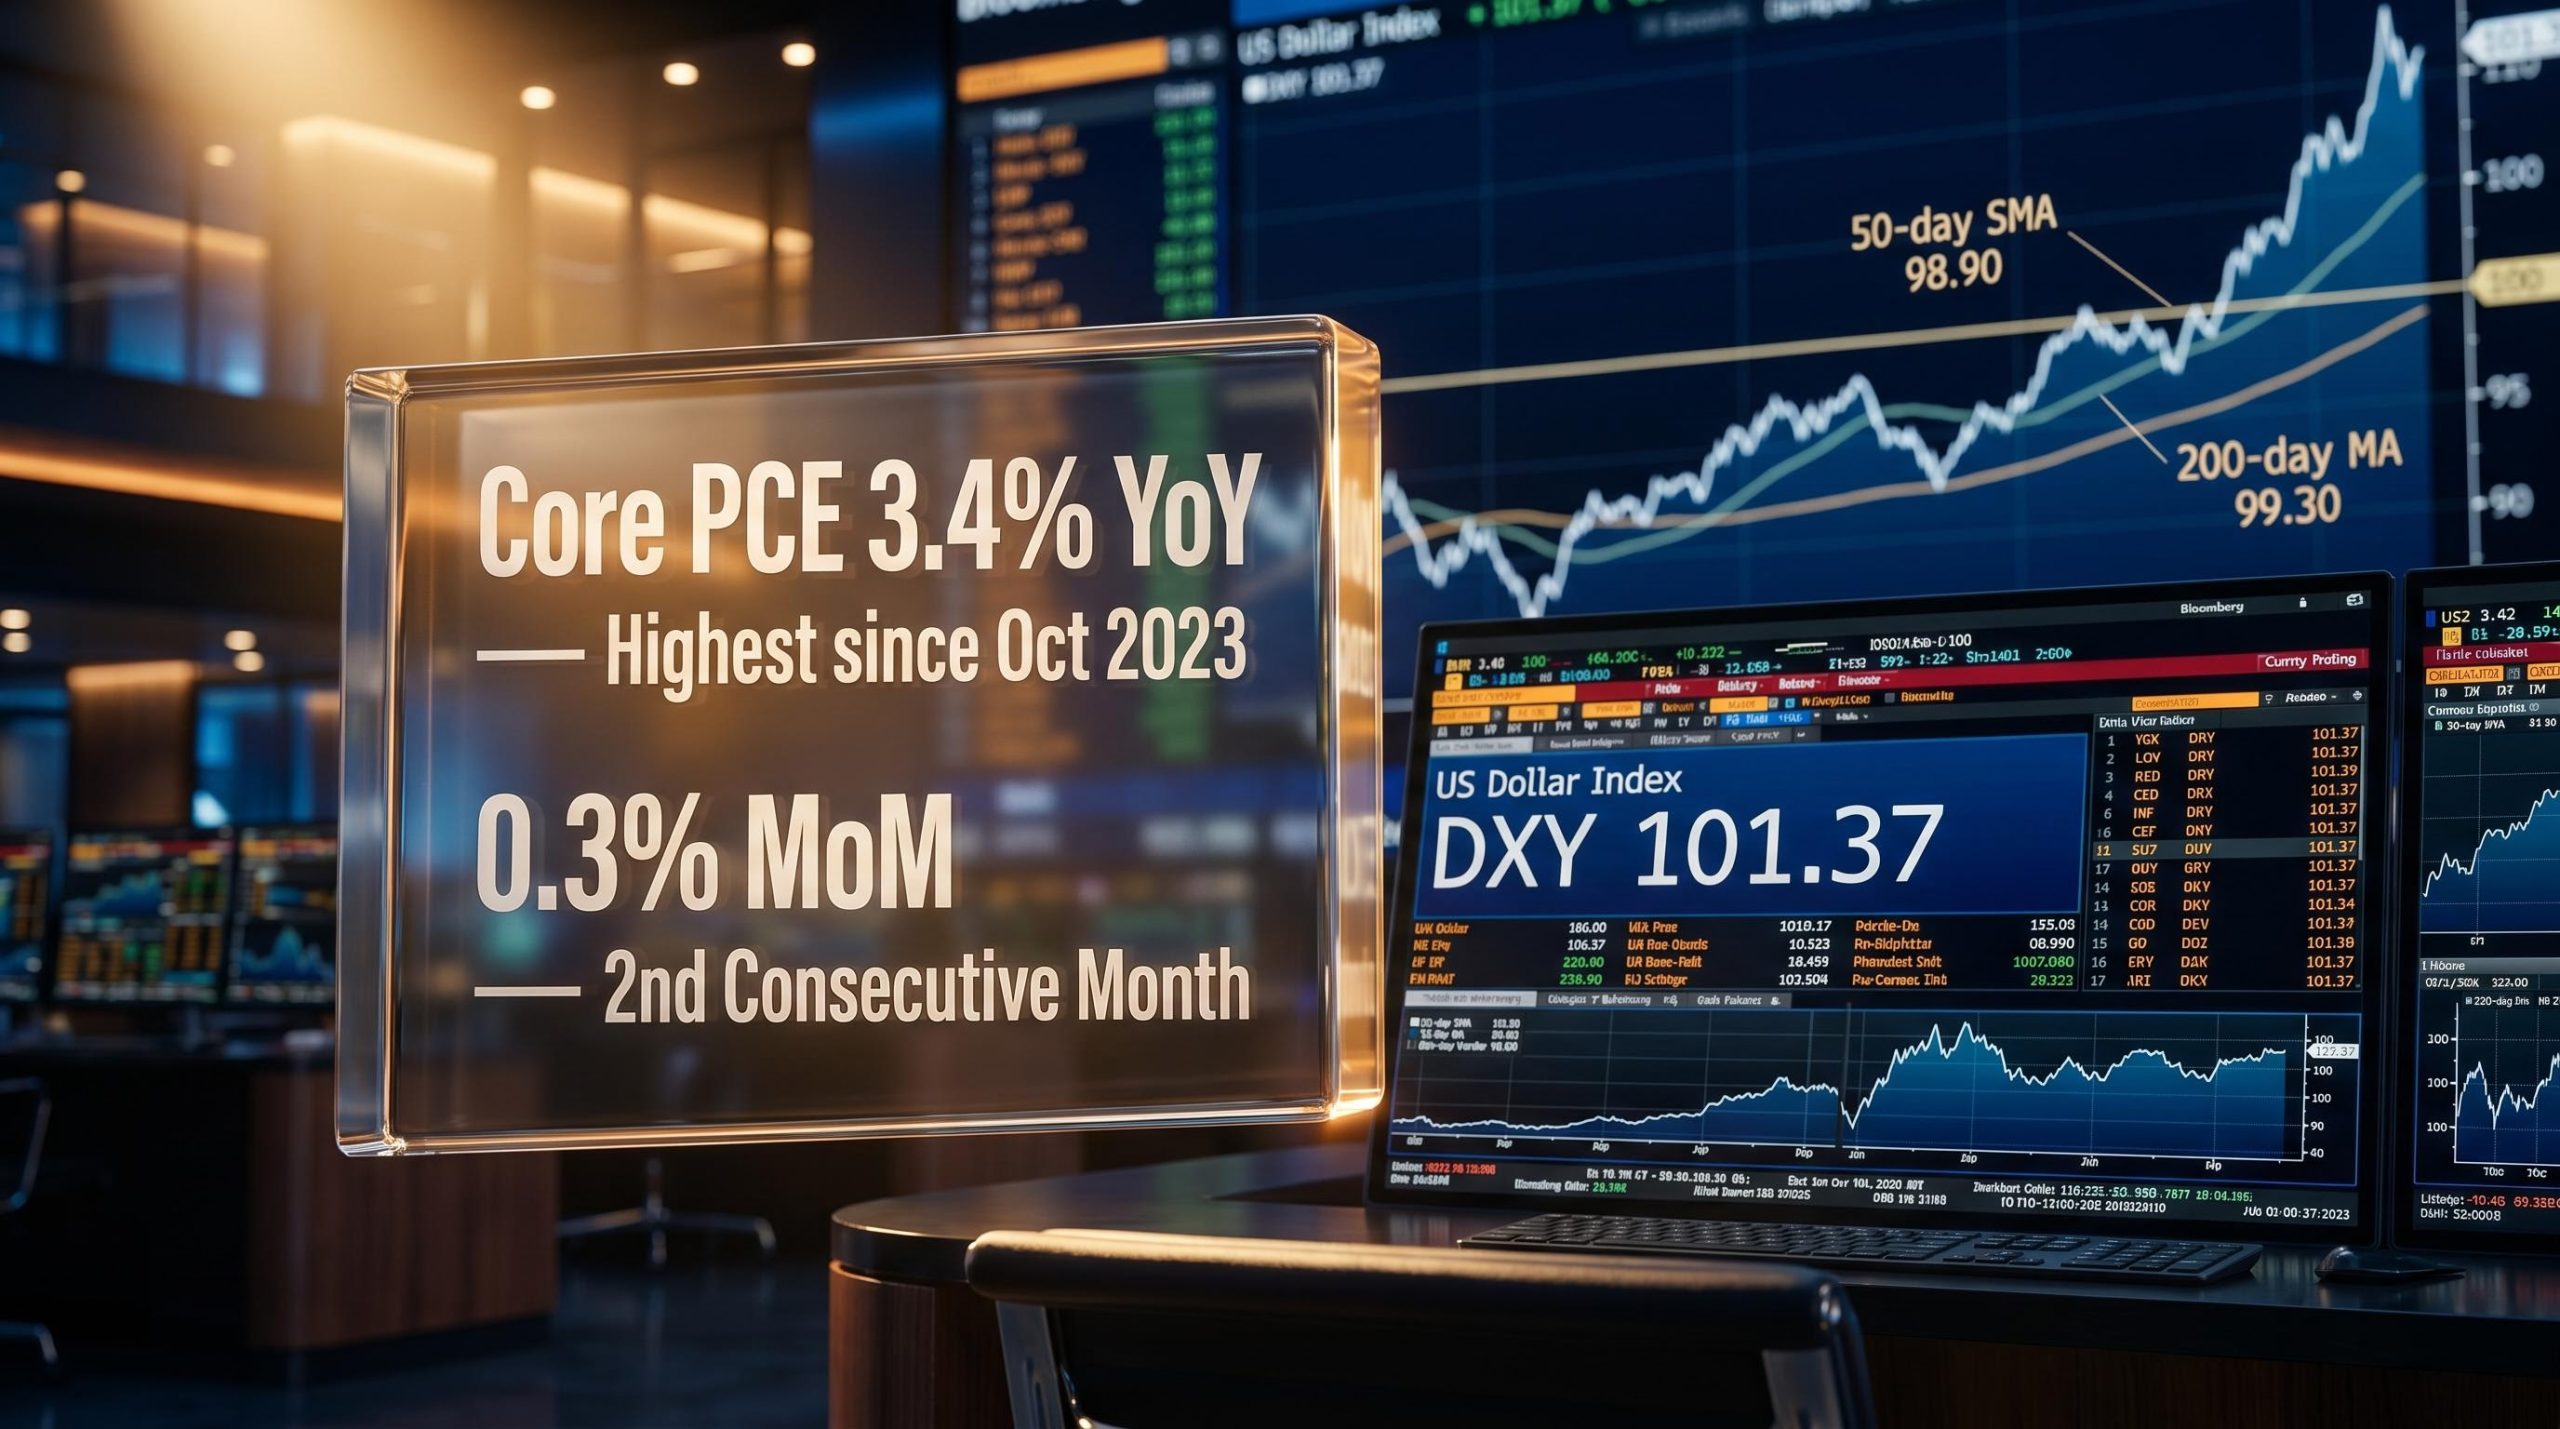
Why AUD/USD Hinges on the Strait of Hormuz, Not the RBA
10 mins ago

Semiconductor investors are sitting on one of the strongest earnings stretches in the sector’s history, and most professional forecasts say it continues through 2026 into 2027. The discomfort is not the present. It is what comes after.
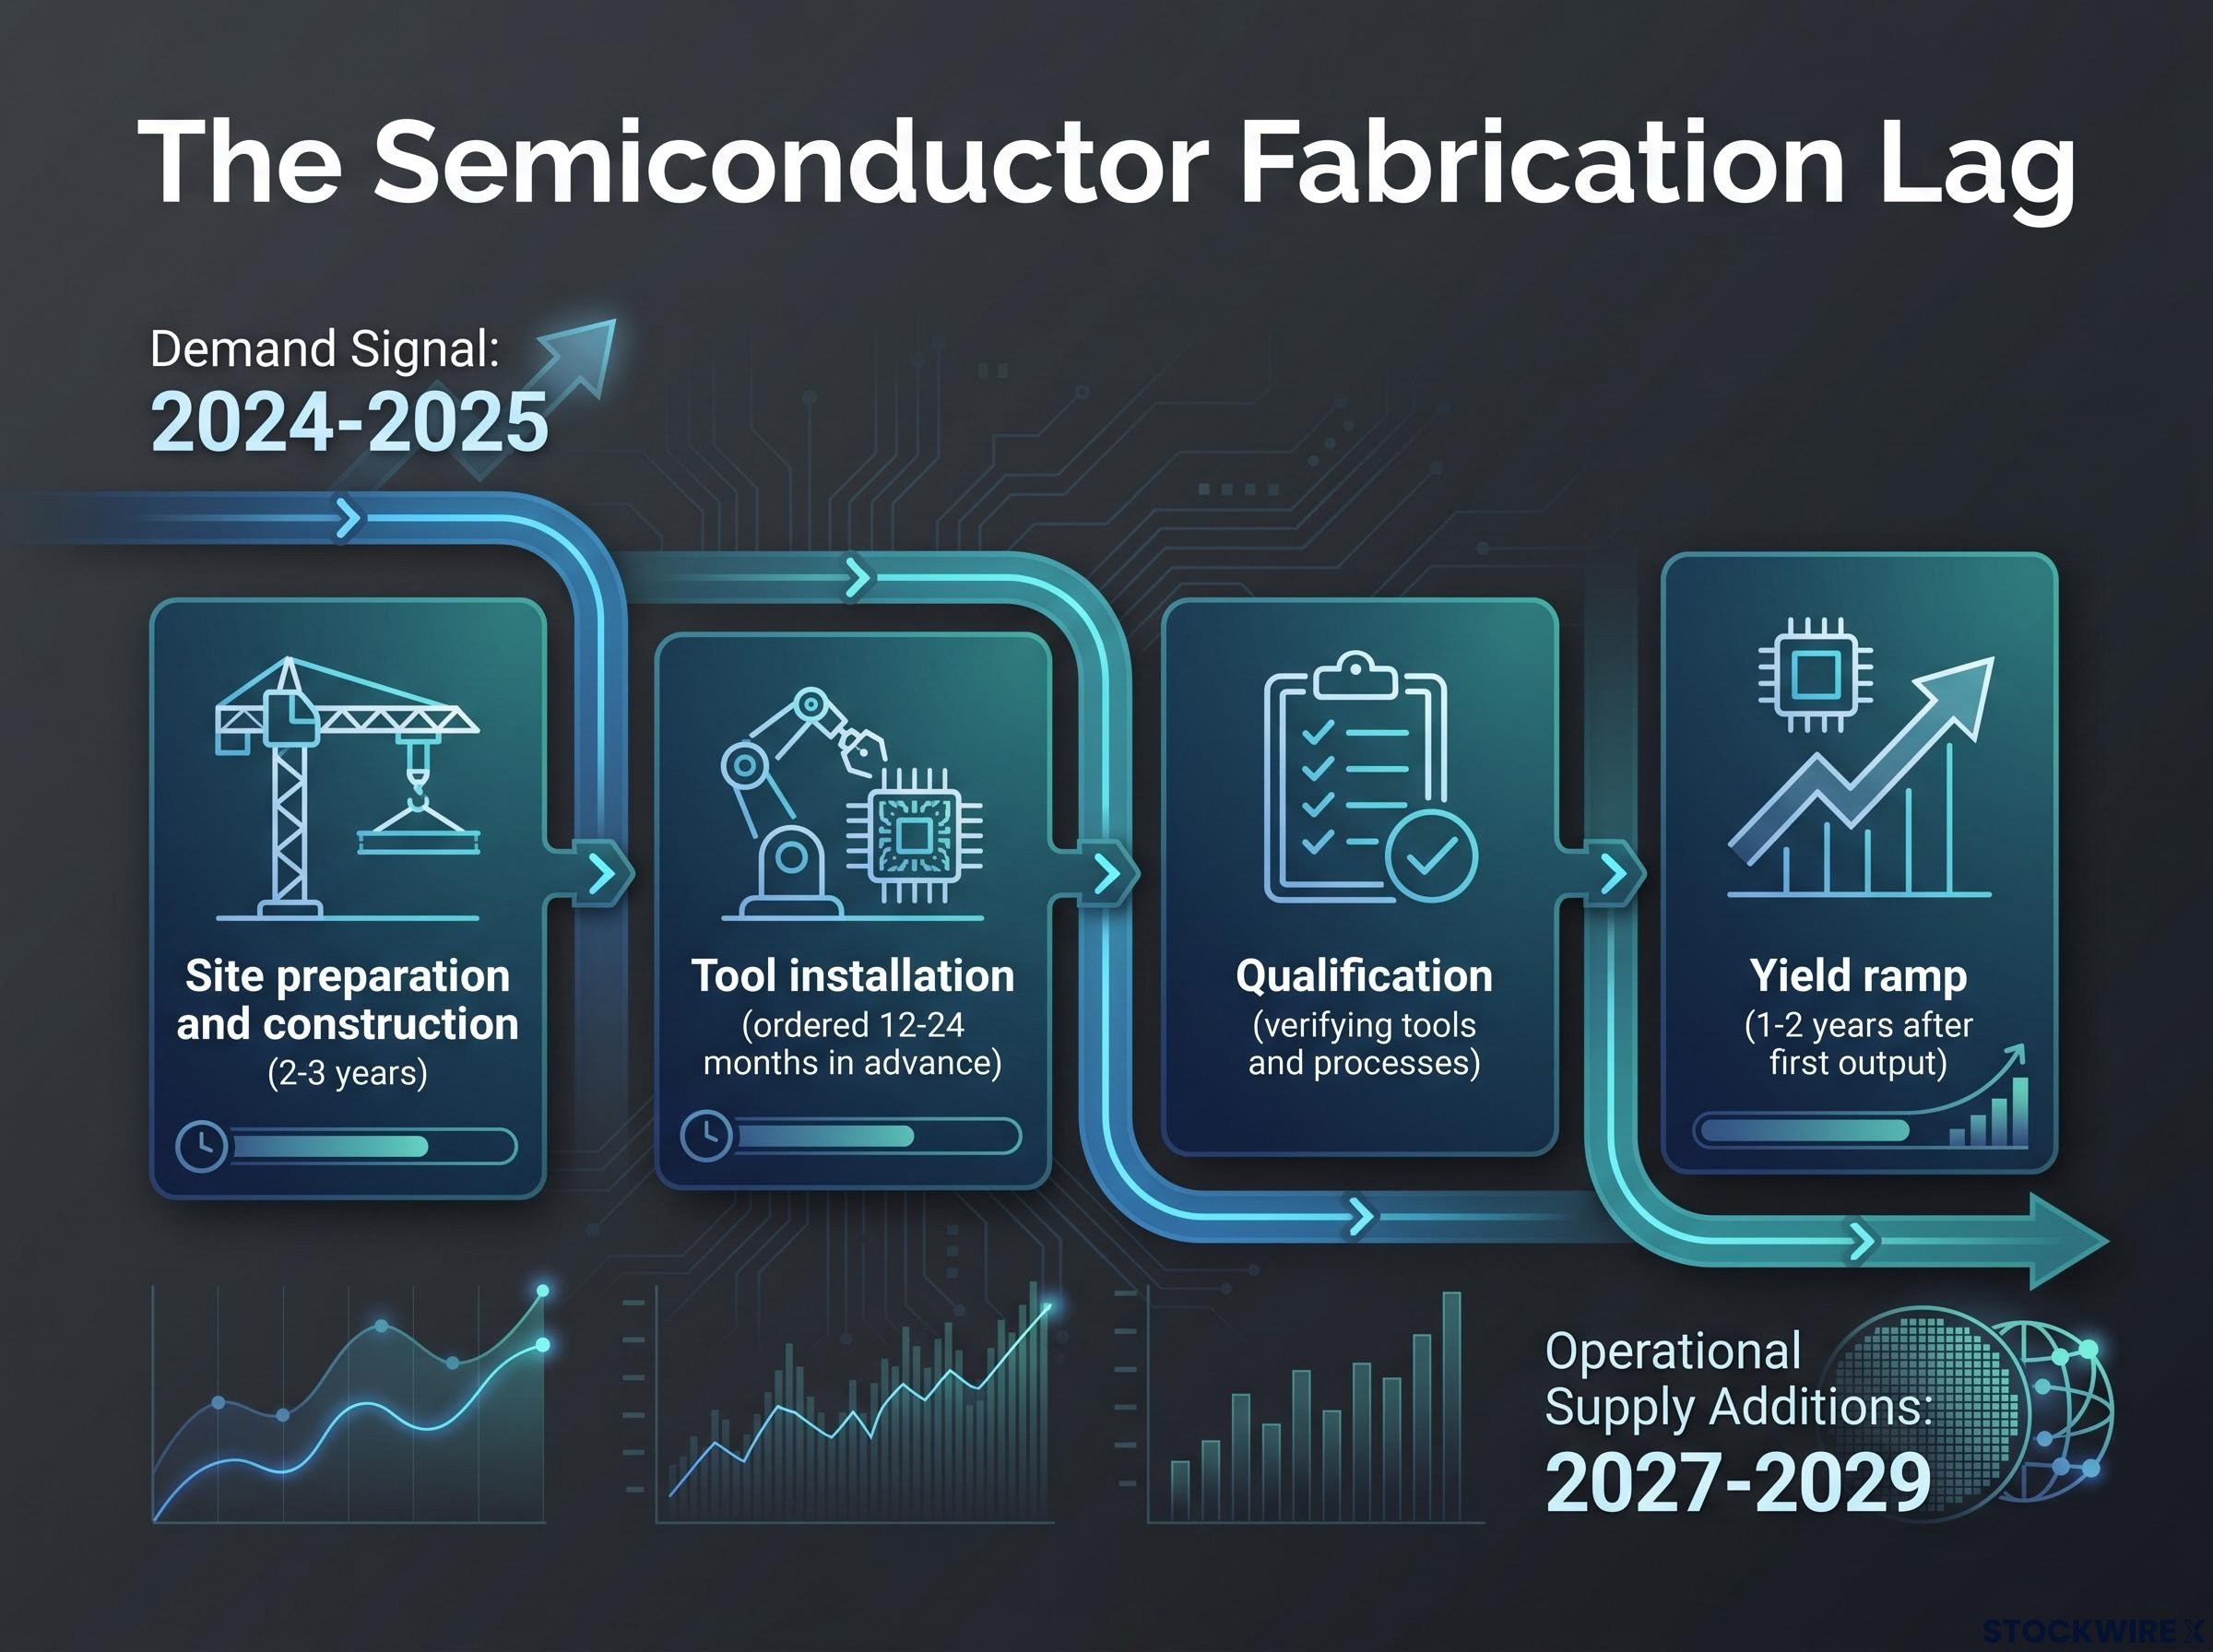
When semiconductor capacity waves arrive, they do not arrive gradually. They arrive all at once, because every major producer responds to the same demand signal with the same multi-year construction timeline, and the supply additions cluster in the same narrow window. The AI-driven supercycle has produced genuine structural demand, not speculative excess, which makes an early exit genuinely costly. At the same time, the capital expenditure commitments made in 2024 and 2025 by TSMC, Samsung, and their peers are largely locked in, and the supply response they represent is approximately 18 to 24 months from becoming a market reality.
The window between now and then is the analytically important zone. Here is a framework for navigating it with discipline rather than guesswork: how the supply wave mechanics work, where each segment of the sector sits on the risk spectrum, which indicators to monitor, and when to start moving.
The central distortion in the semiconductor cycle is the lag between the demand signal and the supply response. In most industries, that lag is measured in months. In semiconductors, it is measured in years.
A new fabrication plant moves through a multi-year sequence before it produces a single commercial chip:
The capex-to-revenue lag sits at the structural centre of this risk: Morningstar analyst Dennis Li has quantified it at 18-24 months for hyperscaler AI infrastructure spending, which aligns closely with the fab construction timelines that place meaningful supply additions in the 2027-2029 window.
That timeline means the AI demand signal from 2024-2025 translates to operational supply additions clustered in 2027-2029. Global wafer fab capacity currently stands at 42.5 million wafers per quarter, growing 7% year-on-year. Additional mega-fab lines are moving to first output around 2027, with full production around 2028.
The lag alone would be manageable. The problem is synchronisation. Multiple major producers all received the same demand signal, and all made large capital expenditure commitments within a similar window.
TSMC has guided a 2026 capital budget of $52-56 billion, explicitly to expand capacity and advance leading-edge processes. Samsung’s total outlay across capital expenditure and R&D is understood to run in the range of $70-80 billion annually. TSMC’s Arizona Fab 2 (3nm) targets volume production in 2027-2028; Fab 3 (2nm/A16) is planned before 2030. A European joint fab is targeting production in 2027.
TSMC’s 2026 capital budget guidance of $52-56 billion confirms that the supply additions now in motion are not speculative commitments subject to revision, but locked expenditures with equipment lead times already running, making the 2027-2029 supply wave a structural certainty rather than a conditional risk.
These commitments are largely locked in. Given equipment lead times of 12-24 months, the order books visible today provide a reliable map of where supply will materialise. The supply wave is not contingent on future decisions; it is already in motion, with delivery windows that can be tracked against announced construction schedules. Investors should treat the 2027-2029 window as a known structural pressure point on the supply side, regardless of what happens to demand.
Before the risks, the current numbers explain why staying invested is the rational choice right now.
Global semiconductor revenues reached approximately $700 billion in the most recent reported year, up 21% year-on-year. Deloitte’s 2026 Global Semiconductor Industry Outlook projects $975 billion in sales for 2026, with growth of 22% in 2025 and 26% projected for 2026.
Deloitte’s 2026 forecast: $975 billion in global semiconductor sales, representing 26% year-on-year growth.
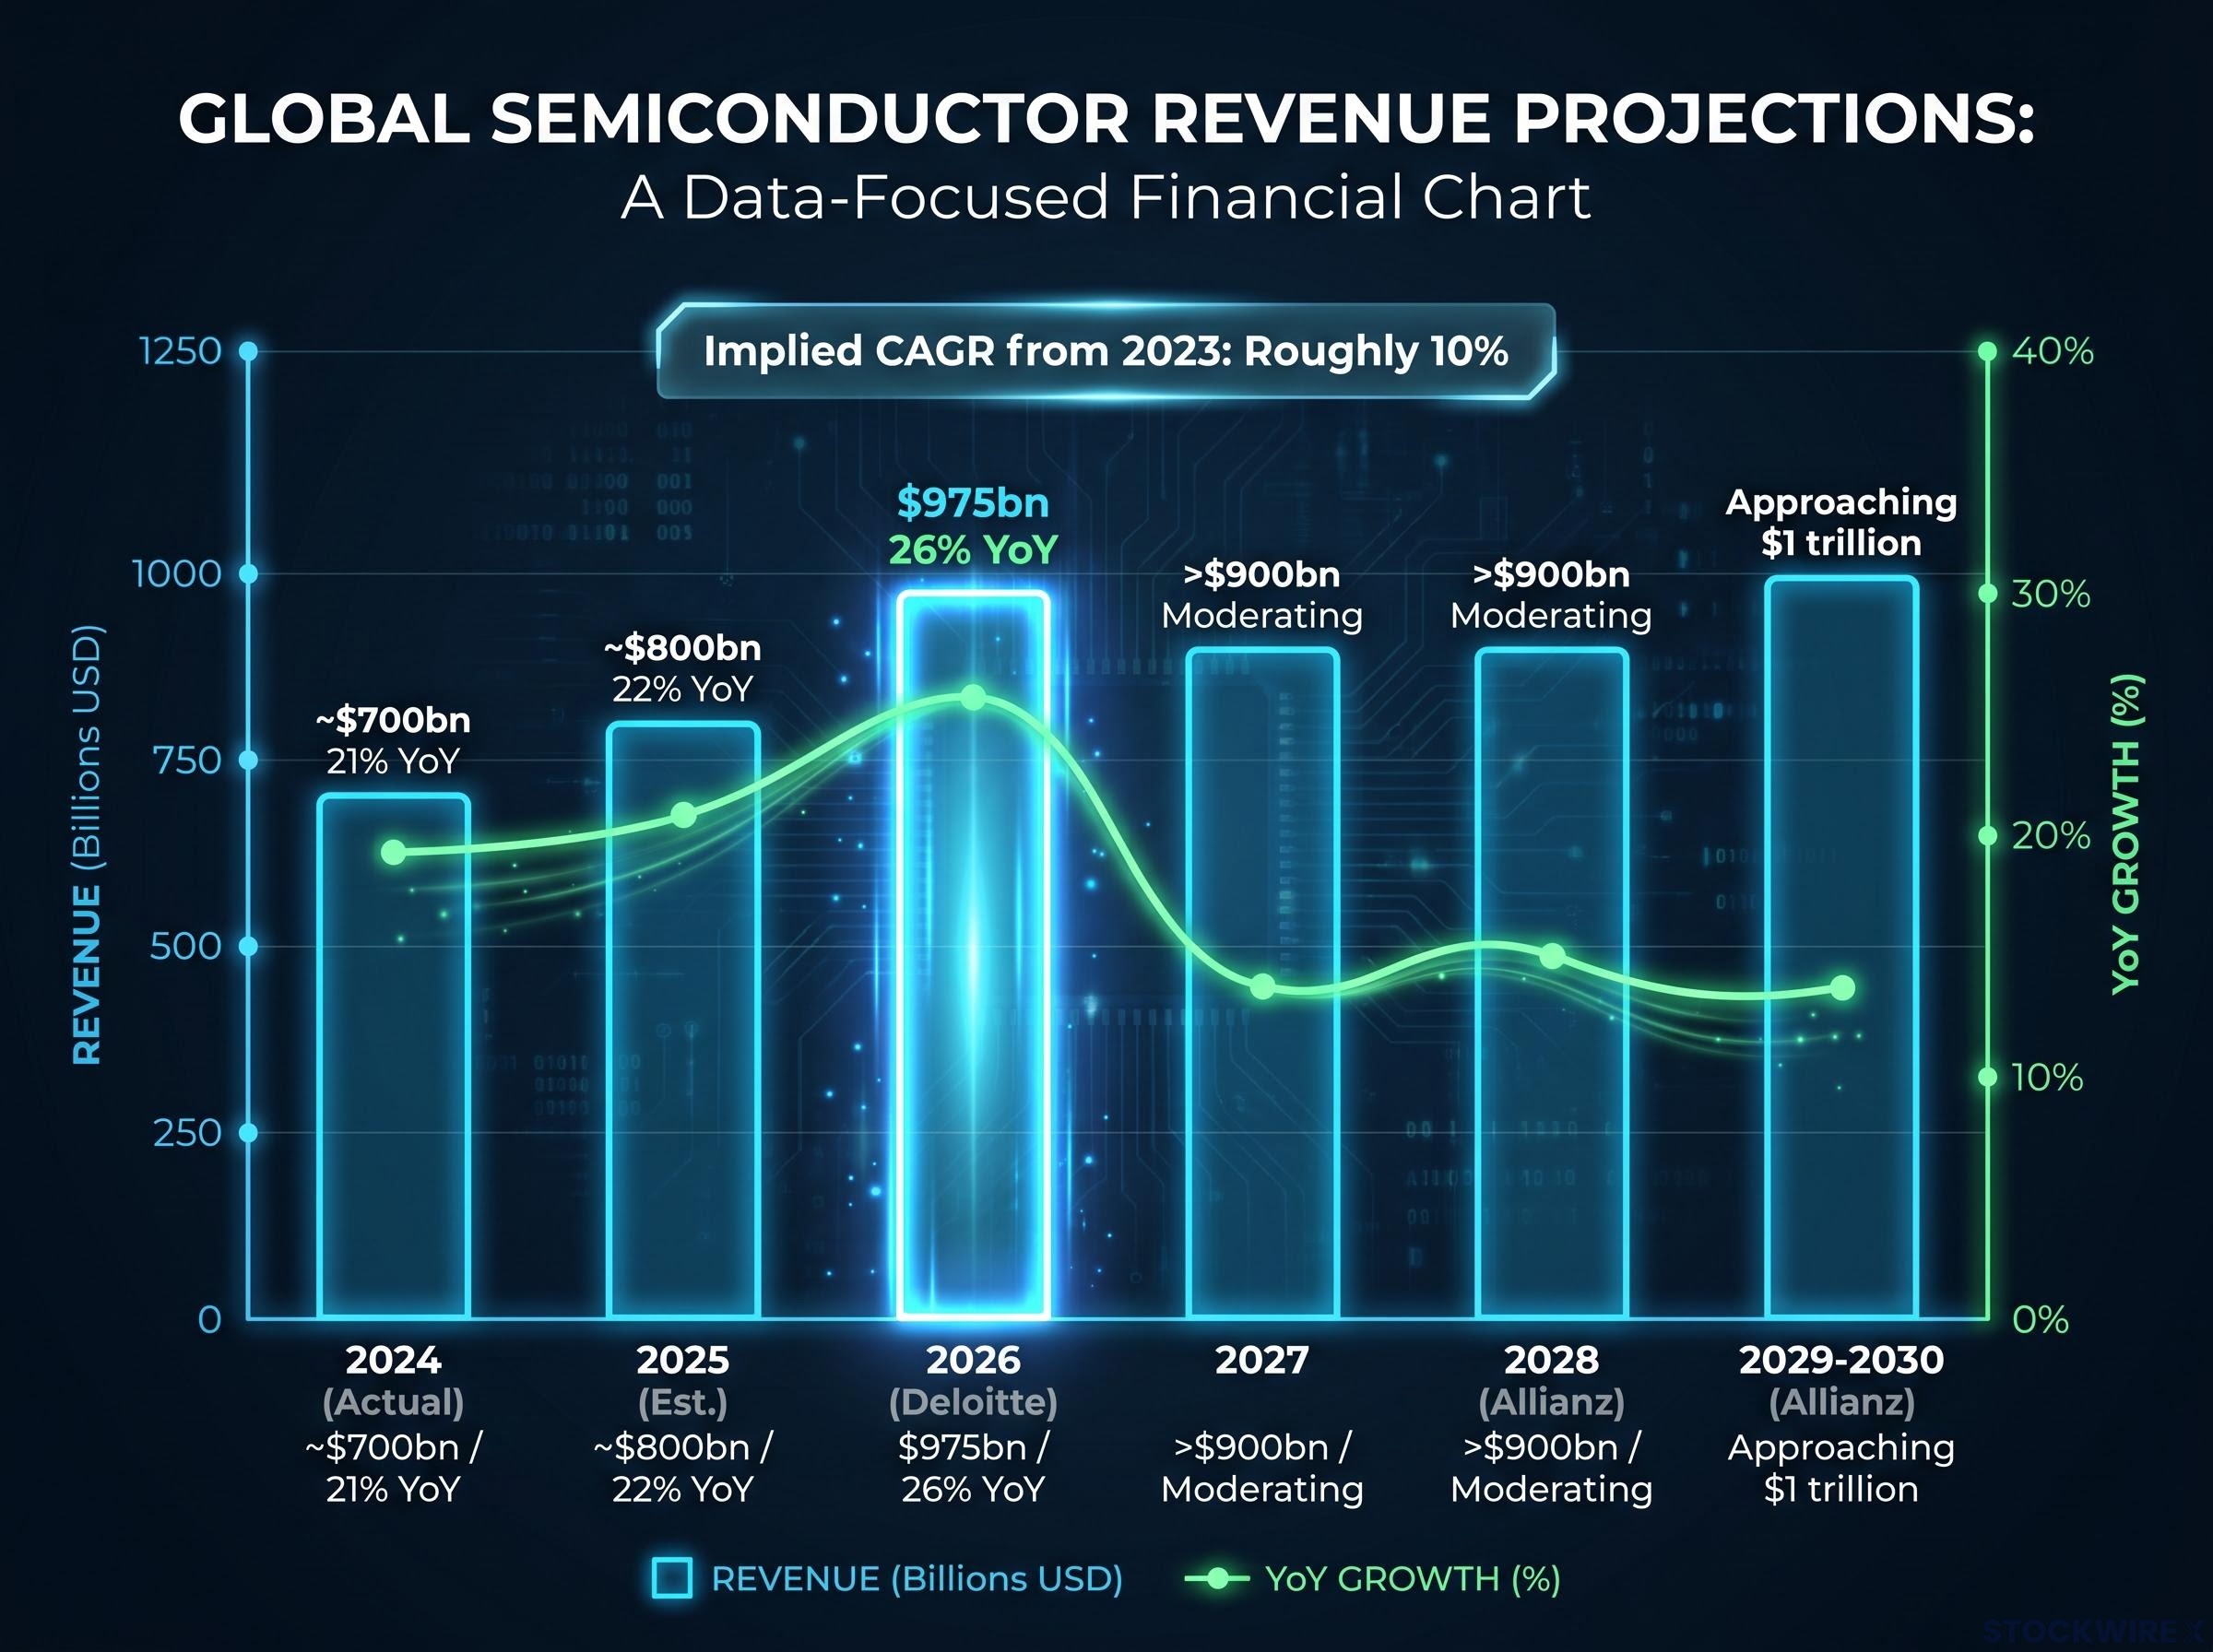
The trajectory beyond that remains strong. According to Allianz Research, the market is tracking to exceed $900 billion by 2028 and approach $1 trillion by 2029-2030, implying roughly 10% compound annual growth from 2023 levels. IDC characterises the current phase as a semiconductor supercycle with double-digit revenue compound annual growth for 2024-2028.
The supply side explains the earnings power. Memory is experiencing a structural supply constraint, with DRAM prices elevated sharply year-on-year and NAND supply tightened following capital expenditure cuts in 2024. High Bandwidth Memory (HBM), the specialised memory required for AI accelerators, is particularly constrained because wafer capacity has been reallocated from commodity DRAM to HBM production. Micron has publicly highlighted demand and supply constraints expected to persist beyond calendar year 2026.
| Year | Revenue Estimate | YoY Growth | Supply Condition |
|---|---|---|---|
| 2024 | ~$700bn (actual) | 21% | Tight |
| 2025 | ~$800bn (est.) | 22% | Tight |
| 2026 | $975bn (Deloitte) | 26% | Tight |
| 2027 | >$900bn baseline | Moderating | Loosening |
| 2028 | >$900bn (Allianz) | Moderating | Potential excess |
What matters to you is not the 26% growth figure in isolation. Growth at this rate places the sector firmly in the uppermost tier of its own historical distribution. It is that positioning which gives cover for elevated valuation multiples, and it is also that positioning which makes the eventual return to trend so consequential: when growth reverts, the multiples built around exceptional performance have no foundation to rest on.
When the semiconductor cycle turns, value is destroyed through two channels simultaneously, not one. Understanding both is what separates a manageable drawdown from a compounding one.
These two forces do not arrive sequentially. They arrive at the same time, because markets begin pricing in lower future earnings before the current quarter’s results actually deteriorate. That is where the compounding effect bites hardest.
Forced deleveraging can accelerate the double hit well before fundamental deterioration materialises: the June 2026 semiconductor selloff, triggered by a Korean regulatory misstep, demonstrated how a mechanical redemption event in a heavily positioned sector can cascade into a 7.8% single-session decline in the NYSE Semiconductor index, compressing multiples independently of any quarterly earnings miss.
Illustrative scenario (not a forecast): suppose 2026 delivers earnings growth of approximately 25%, in line with current forecasts, but growth in 2027 disappoints at 5% rather than the 15% the market had anticipated. The resulting earnings shortfall, combined with investors repricing away from a growth premium, could together drive a market drawdown of the order of 20-25%, with the valuation re-rating amplifying what would otherwise be a modest fundamental miss.
The framework from Damien Klassen at Nucleus Wealth helps quantify this: according to his analysis, when growth reaches the uppermost percentiles of historical experience, it may reasonably support valuations well above long-run norms, but once growth steps down toward more ordinary levels, those elevated ratings tend to compress in parallel. Bloomsbury Intelligence explicitly warns that oversupply in 2028-2029 is a realistic possibility if AI demand growth moderates as capacity expands.
Consensus estimates systematically project recent peak growth rates into out-years. That structural bias means downward revisions, when growth normalises, are typically larger than expected.
The specific warning signal to watch: upgrades to 2026 estimates that come at the cost of muted 2028 estimates. That pattern tells you the market is pulling demand forward rather than creating durable growth. It is a leading indicator of the double hit, visible before the current quarter’s results disappoint.
Where you are positioned within the semiconductor sector matters as much as whether you are in the sector at all. Four segments carry materially different risk profiles.
| Segment | Cyclical Exposure | Key Risk Driver | Recommended Exit Horizon |
|---|---|---|---|
| Memory (DRAM, NAND, HBM) | Highest | Supply wave, price commoditisation | Strict exit before 2028 capacity peak |
| AI Accelerators | Moderate-high | Hyperscaler in-house silicon displacement | Longer hold; monitor plateau signals |
| Foundries / IDMs | Moderate | Operating leverage from heavy capex | Medium-term hold with active monitoring |
| Equipment Makers | Moderate (leading) | Order book deceleration | Hold for signal value; use as leading indicator |
Memory is the most cyclically exposed. Bloomsbury Intelligence characterises current conditions as a structural crisis driven by wafer reallocation from commodity DRAM to HBM, with tight supply expected through 2027-2028 and oversupply in 2028-2029 a realistic possibility. Pure-play memory names like Micron, SK Hynix, and Samsung’s memory division warrant the strictest exit discipline.
China’s DDR5 supply ramp adds a forward-looking dimension that the current consensus largely underweights: ChangXin Memory Technologies has achieved commercial DDR5 delivery with yields above 80%, shifting from a theoretical competitive threat to a present supply-side reality that could bring forward the memory pricing correction the market currently places in 2028-2029.
AI accelerators, particularly those with strong software ecosystems and deep customer integration such as NVIDIA, may sustain elevated margins longer. But they are not immune. Google’s TPU, Amazon’s Trainium, Microsoft’s Maia, and Meta’s MTIA represent meaningful displacement risk over the medium term.
Foundries and diversified IDMs benefit from policy support through the US CHIPS Act and EU Chips Act, but face significant operating leverage risk once heavy capital expenditure translates into excess capacity. Equipment makers like ASML, Applied Materials, Lam Research, and Tokyo Electron serve a dual purpose: they participate in the ongoing build-out, and their order book trends peak 12-24 months ahead of chip maker earnings, making them leading indicators for the broader cycle.
Treating semiconductor exposure as monolithic creates blind spots. A pure-play memory name requires a different exit trigger and timeline than an ecosystem-anchored AI logic name.
The framework below is ordered by lead time, longest first. The indicators closest to the top give you the most advance warning. The ones further down are confirmation signals.
The two-or-three-indicators-flashing-amber rule: begin scaling back before indicators confirm the cycle has turned, not after. Waiting for red confirmation is structurally too late. When two or three of the five indicators above move into amber territory, that is the signal to begin graduated de-risking.**
The signal that matters is not the near-term earnings beat. It is whether the 2028 and 2029 estimates are holding firm during a strong 2026 print. That divergence is where the cycle’s durability is being assessed by the market in real time.
The affirmative case for holding semiconductor positions through this phase is straightforward. Broad consensus from Deloitte, Allianz, IDC, and TrendForce supports strong growth and tight memory supply into 2026-2027. When growth is running at historically exceptional rates, accepting a valuation premium is a rational response, not a reckless one. Reducing exposure simply because absolute prices feel high, without evidence that the earnings foundation is deteriorating, means sacrificing returns that the fundamentals genuinely support.
The analysis from Nucleus Wealth’s Damien Klassen makes this point clearly: his framework holds that genuinely exceptional earnings growth can rationally support valuations well above historical norms. The analytical task is identifying when current premiums become unjustifiable as growth steps down, not treating all premiums as inherently dangerous.
The risk in this environment cuts both ways. Sitting out a semiconductor supercycle carries a real opportunity cost. Equally, remaining concentrated in high-multiple positions once the exceptional growth that justified those multiples has passed is where the most serious losses compound.
The graduated de-risking sequence, when indicators trigger it:
The active monitoring period runs from late 2026 through 2028. This is when the transition from constraint to potential loosening is most likely to begin, and it requires quarterly reassessment of where each indicator sits relative to the amber thresholds described above.
This framework is not passive. It requires active, regular engagement with the five indicators. Investors entering the 2027 capacity wave with a prepared framework are not predicting the top. They are managing the risk of holding premium valuations past the point where those premiums are justified.
This article is for informational purposes only and should not be considered financial advice. Investors should conduct their own research and consult with financial professionals before making investment decisions.
Financial projections referenced in this article are subject to market conditions and various risk factors. Past performance does not guarantee future results.
The supply wave changes the terms, not the thesis. The distinction matters.
What the supply wave changes:
What the long-term AI thesis does not change:
The long-range semiconductor market forecast from Bank of America, projecting $2.7 trillion by 2030 at a 28% compound annual growth rate from 2025, frames current hyperscaler spending as a floor rather than a midpoint of the demand curve, providing the analytical backdrop against which the supply wave’s normalising effect should be calibrated.
The supply wave does not invalidate the investment thesis for semiconductors. It changes how that thesis is expressed: from exceptional near-term earnings growth that justifies premium multiples, to sustained above-average growth that justifies reasonable but not peak multiples.
The investors who will navigate this environment well are those who hold both truths simultaneously, that the secular demand story is real and that the peak-cycle earnings rate is not permanent, and act on the distinction. That is the difference between semiconductor cycle investing as a reactive exercise and semiconductor cycle investing as a disciplined one.
—
The semiconductor supply cycle refers to the multi-year lag between a demand signal and the supply response, driven by fab construction timelines of 2-3 years plus qualification and yield ramp periods. For investors, the critical implication is that capital expenditure commitments made in 2024-2025 by TSMC and Samsung will translate into clustered supply additions in the 2027-2029 window, creating predictable pressure on pricing and margins.
The double hit refers to two simultaneous forces that destroy value when the semiconductor cycle turns: an earnings channel, where revenue and margin growth slow as pricing power erodes, and a multiple compression channel, where elevated valuation premiums collapse as growth normalises. Both forces arrive at the same time because markets begin repricing lower future earnings before quarterly results actually deteriorate.
Memory, including DRAM, NAND, and High Bandwidth Memory, carries the highest cyclical exposure because tight supply through 2027-2028 is expected to give way to realistic oversupply in 2028-2029 as new wafer capacity comes online. Pure-play memory names like Micron, SK Hynix, and Samsung's memory division warrant the strictest exit discipline of any segment.
The five indicators, ordered by lead time, are: equipment order deceleration at ASML and Applied Materials (12-24 months ahead), fab construction progression from tool installation to yield ramp, forward earnings revisions for 2027-2029, memory spot versus contract price divergence, and macro signals including hyperscaler capex guidance and central bank rate direction. The article recommends beginning graduated de-risking when two or three of these move into amber territory.
The supply wave changes the terms of the AI semiconductor thesis without invalidating it: peak-cycle earnings growth normalises, memory pricing power compresses, and valuation multiples contract from peak premiums, but large-scale AI training and inference demand remains durable and multi-year. Deloitte, IDC, and Allianz Research all project continued above-average growth after 2026, with Allianz forecasting the market approaching $1 trillion by 2029-2030.