Citi Puts Memory Supply Above Chip Design in AI Stock Rankings
1 hr ago
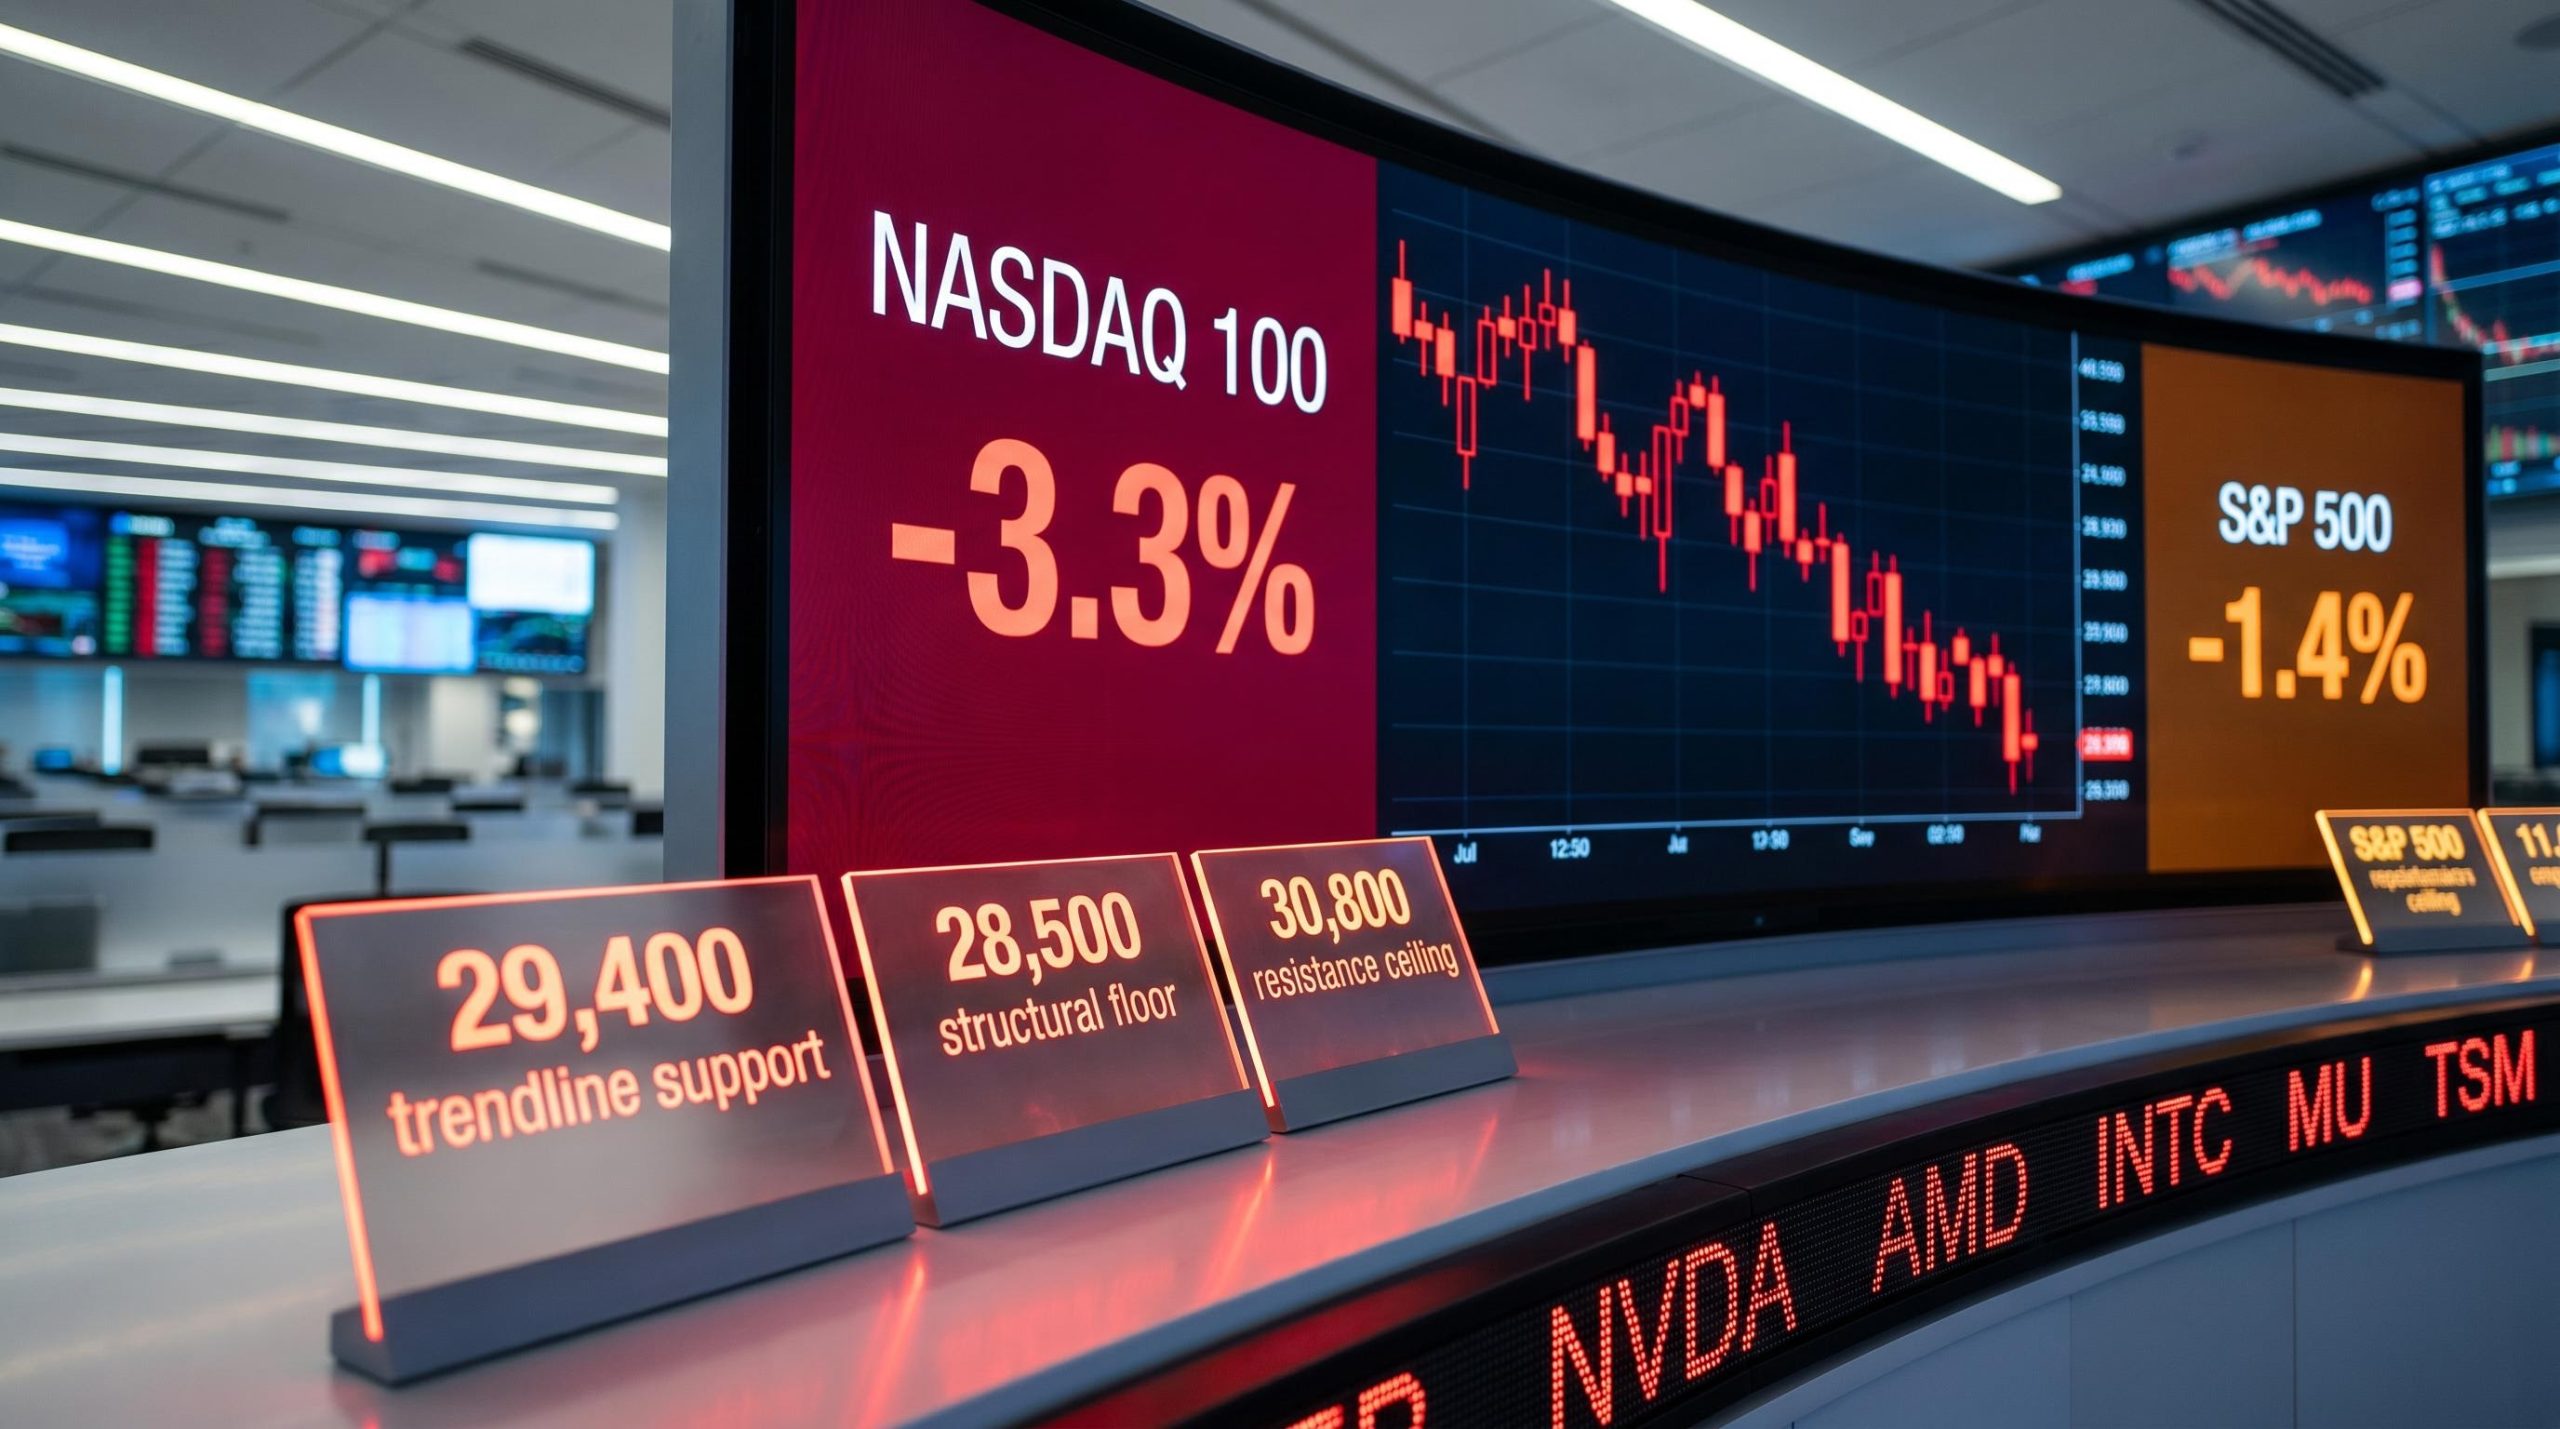
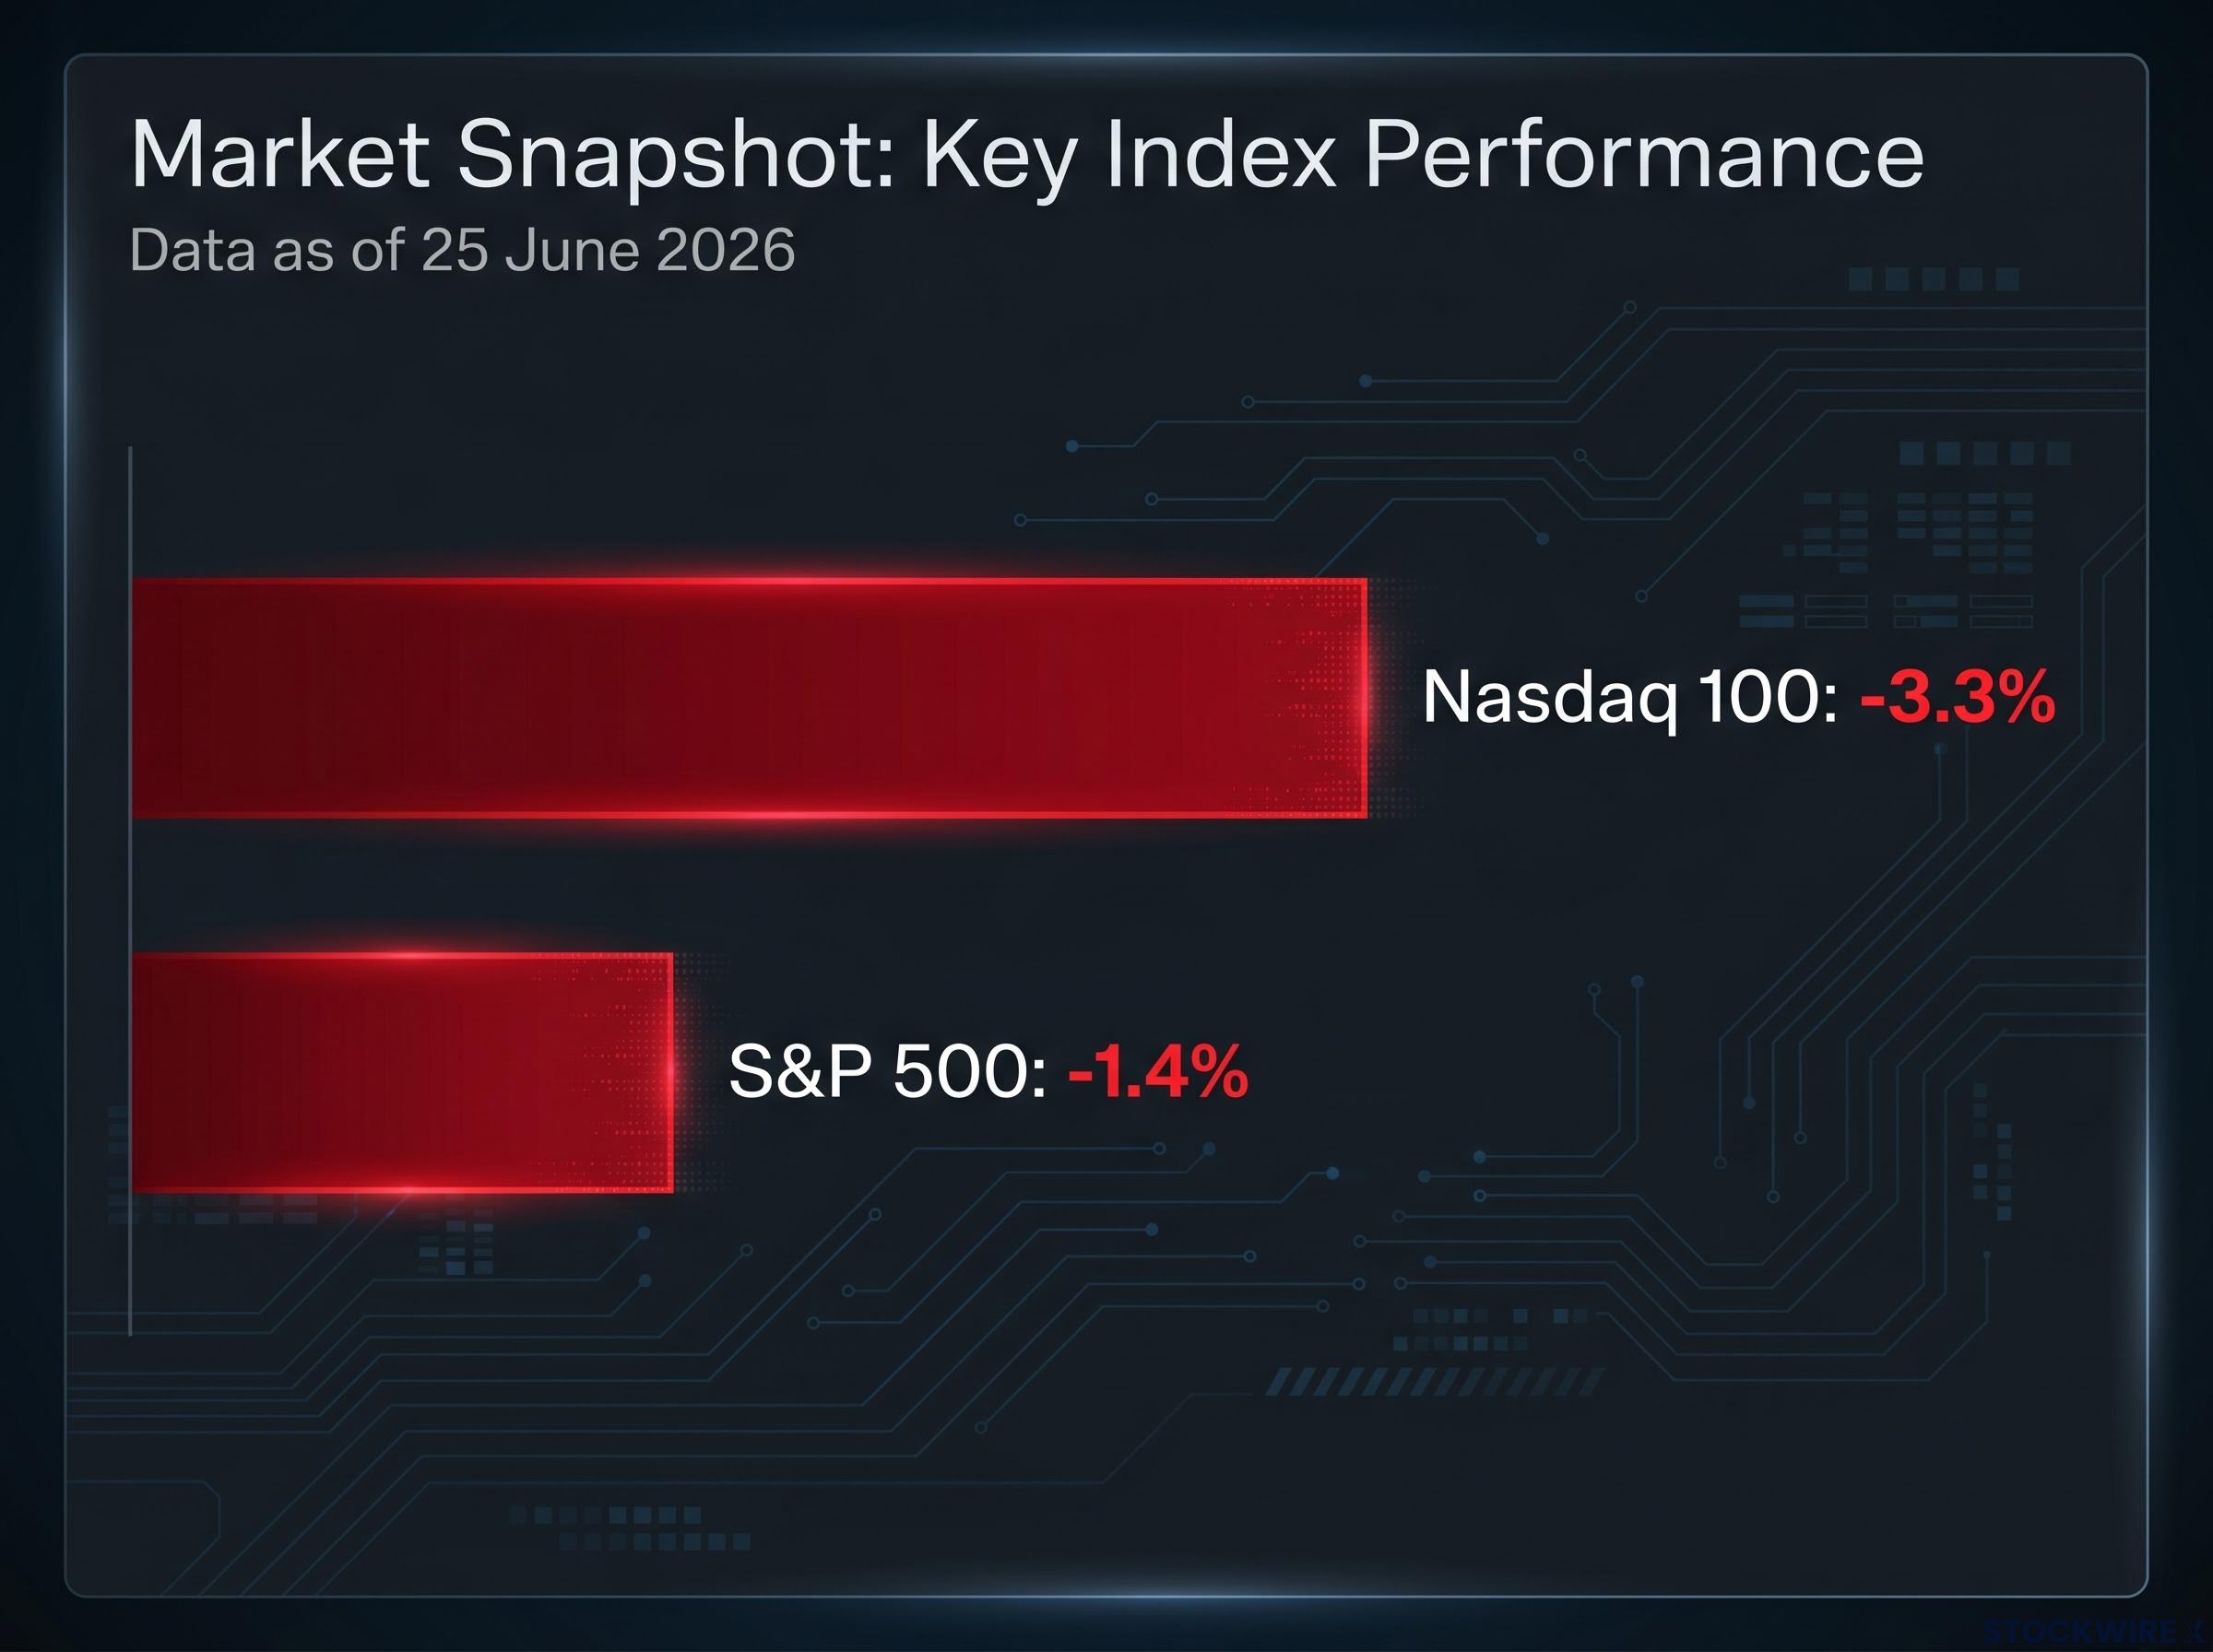
The Nasdaq 100 fell 3.3% in the overnight session heading into 25 June 2026. The S&P 500 dropped 1.4% in the same window. That gap is not noise. It is a diagnostic, isolating exactly where the market’s doubt is concentrated: artificial intelligence infrastructure, semiconductors, and the handful of mega-cap names that have carried the 2026 rally.
The sell-off arrives at a moment when investors are beginning to ask a harder question about AI spending. Vast sums have been poured into data centres, specialised chips, and compute capacity, with the economic returns from that investment remaining deeply uncertain and, for many projects, unlikely to materialise for several years. With interest rates still elevated compared to the zero-rate era that originally inflated many of these valuations, the market is less forgiving of distant or speculative earnings streams.
Here is a clear read on what this pullback is actually signalling, which technical levels matter most right now, and what to watch over the coming days to distinguish an orderly correction from a deeper unwind.
The 3.3% Nasdaq 100 decline against the 1.4% S&P 500 decline tells you almost everything you need to know about the character of this sell-off. The stress is not distributed evenly. It is sitting squarely on technology, semiconductors, and AI-exposed names.
Semiconductor stocks bore a disproportionate share of the losses, confirming that this is an AI-hardware and AI-infrastructure repricing rather than a cyclical or macro-driven event. Three features define it:
The semiconductor supercycle framing that drove much of the 2026 rally rests on a specific structural shift: agentic AI workloads running continuously convert episodic chip demand into permanent baseline consumption, a thesis that Microsoft and Meta’s combined $160 billion in AI infrastructure commitments appeared to validate before this repricing began.
Hebe Chen, Senior Market Analyst at Vantage Markets, described the move as reflecting investor caution around technology valuations, with participants choosing to reduce exposure following the sector’s strong run.
That framing matters. Investors who misread this as a systemic event may de-risk unnecessarily across their entire portfolio. The divergence between the two indices tells you this is a sector-specific valuation problem, not a signal to reduce all equity exposure, and that distinction should shape how you respond.
The sell-off is not happening in a vacuum. It reflects a structural tension that has been building for quarters: companies have deployed enormous capital into data centres, specialised chips, and compute capacity ahead of demand, while the revenue and profit returns on that investment remain unclear and, in many cases, are still years from being realised.
In a higher-rate environment, that matters more. Markets discount distant earnings more heavily when borrowing costs are elevated, which makes premium valuations for speculative future returns harder to sustain. Competitive pressure adds another layer: potential commoditisation of AI services could compress margins, undermining the original profitability assumptions behind the spending.
The market is not abandoning the AI theme. It is beginning to separate companies with demonstrable near-term economic returns from those with aspirational or distant payoffs. If you understand that distinction, you can evaluate individual AI-exposed holdings with more precision rather than reacting to the headline index move.
The current AI investment cycle has already surpassed every prior technology spending peak as a share of GDP, with Goldman Sachs projecting that meaningful ROI from enterprise AI deployments will not emerge until 2027-2028, which sets a precise timeline for when the market’s patience with aspirational earnings narratives will run out.
Three signals in upcoming earnings communications will tell you which companies are on the right side of this separation:
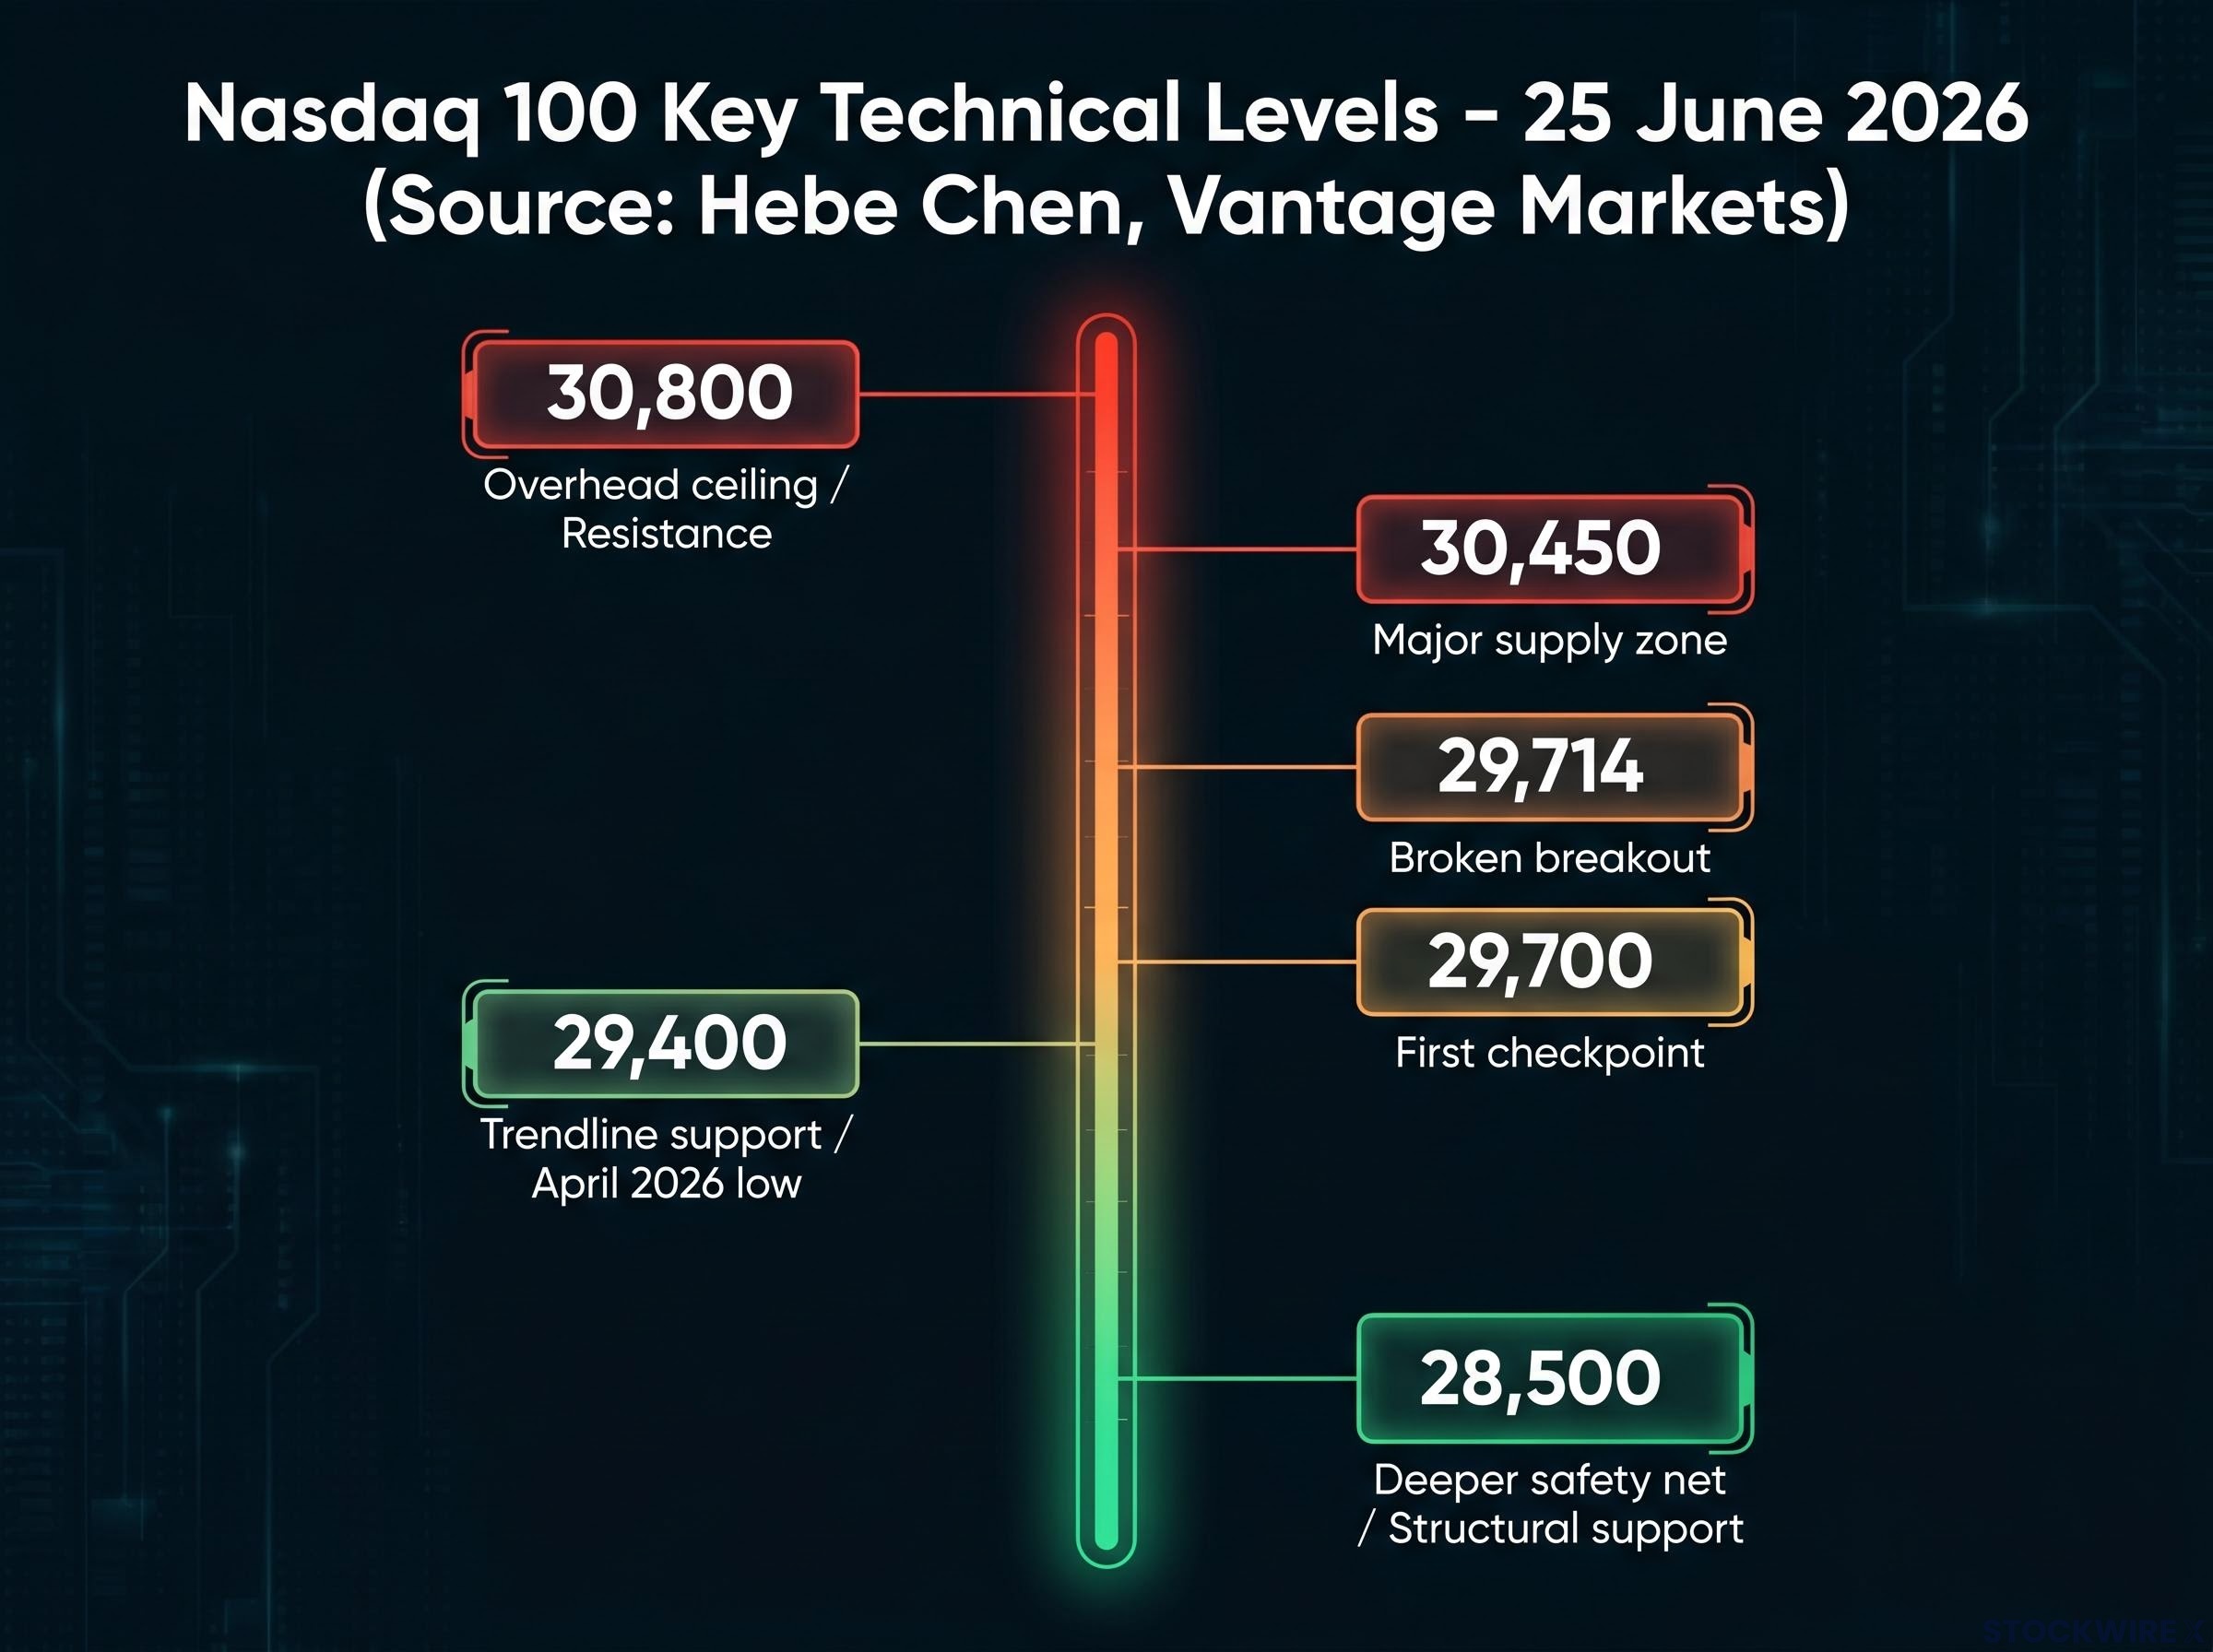
Technical analysis attributed to Hebe Chen at Vantage Markets (as of 25 June 2026) maps out the levels the index will need to navigate over the coming sessions. Reading them as a sequence, rather than a static list, turns the technical picture into a live diagnostic tool.
The index has pulled back beneath the 29,714 prior breakout level, a shift that places the recent advance under renewed scrutiny. That shift matters. Dropping back below a breakout level changes the short-term view from constructive to cautious, because it tells you the buying conviction that drove the original breakout has faded.
The Nasdaq 100 valuation risk was visible before this pullback arrived: the index’s 18% rally from its April lows had pushed momentum indicators into overbought territory at a defined resistance zone, with Nvidia carrying a trailing P/E of approximately 40-41 that priced in earnings acceleration requiring confirmation across the Magnificent Seven this season.
Above, the 30,800 level has acted as a persistent ceiling, with buying consistently failing to gain traction near this peak. Each unsuccessful attempt to push through this zone confirms that upside momentum has already faded from overbought readings. Until 30,800 is convincingly reclaimed, it represents a hard cap on bullish scenarios.
On any recovery attempt, two resistance levels will need to be cleared in sequence: 29,700 marks the first hurdle where former support has flipped to overhead supply, while 30,450 represents a heavier barrier where sellers have shown up consistently. Clearing and holding above 30,450 would argue the correction has likely run its course.
The first meaningful floor is around 29,400, which corresponds to the rising trendline drawn from the April 2026 low. This is the first real test of whether the uptrend structure remains intact. A firm bounce here supports the “orderly pullback within a larger bull trend” reading.
A clean break below 29,400 changes the narrative. Structural support at 28,500 would then become the relevant reference point. A move toward that level would likely coincide with louder AI-doubt media coverage and broader risk-off behaviour, though for longer-term investors it could ultimately represent an attractive accumulation zone for high-quality names.
Knowing where 29,400 sits, and what a break below it would signal, gives you a concrete reference point to monitor rather than reacting emotionally to daily price swings.
| Level | Price | Role | What it means |
|---|---|---|---|
| Overhead ceiling | 30,800 | Resistance | Multiple failed breakouts; cap on bullish scenarios until reclaimed |
| Major supply zone | 30,450 | Near-term resistance | Clearing and holding here suggests correction has likely run its course |
| Broken breakout | 29,714 | Former support / now resistance | Drop below shifted short-term view from constructive to cautious |
| First checkpoint | 29,700 | Near-term resistance on bounce | A strong move above is the first sign buyers are regaining control |
| Trendline support | 29,400 | Immediate support | Aligned with April 2026 trendline; key test of uptrend integrity |
| Deeper safety net | 28,500 | Structural support | Next significant level if 29,400 fails; potential accumulation zone |
Diagnosis is useful. A forward-looking monitoring framework is more useful. These five signals, tracked over the coming days, will resolve the key uncertainty: is this an orderly correction within an ongoing uptrend, or the beginning of a deeper unwind?
Having pre-defined signals turns market monitoring from a reactive, anxiety-driven exercise into a systematic check. That is how you avoid emotionally driven decisions during volatile, narrative-heavy periods.
The correct response to this pullback depends on two things: your time horizon and your existing exposure.
Long-term investors (five-plus year horizon) may view this as a gradual accumulation opportunity in quality names, accepting short-term volatility as the cost of future growth. Short-term traders should respect the broken breakout and momentum rollover rather than fighting the trend. These are different strategies that call for different actions on the same data.
Within AI exposure specifically, a quality filter becomes more important when the broader theme is being repriced. Focus on companies with:
The market is beginning to separate AI winners, those with demonstrable near-term economic returns, from AI losers, those with aspirational or distant payoffs. Positioning should reflect that separation.
If semiconductors or AI-linked names represent a large concentration in your portfolio, now is the time to assess whether that sizing still matches your risk tolerance given the current technical and fundamental picture. The investors most likely to navigate this correctly are those who treat AI as a selective, quality-filtered theme rather than a single monolithic bet, because the repricing is not uniform across all AI-exposed names.
The danger sits on both sides: wholesale de-risking driven by narrative panic is one mistake, but ignoring meaningful technical deterioration because of long-term conviction is another.
The structural AI thesis is not the thing being tested here. Companies are still building out AI infrastructure. Demand for compute is still growing. The multi-year investment cycle remains broadly intact.
What is being tested is the market’s willingness to pay current prices for uncertain future earnings. That distinction determines what a deeper sell-off would actually mean. A breach below 29,400 would escalate the correction narrative and likely bring louder AI-doubt headlines, but it would not by itself invalidate the longer-term AI infrastructure investment cycle. A move toward 28,500 would amplify volatility and media noise, yet for patient, long-term investors, that region could represent a more attractive entry point for high-quality names.
The resolution depends on the five signals outlined above, particularly earnings guidance quality and whether the selling broadens beyond AI-heavy names. Investors who can separate the structural thesis from the near-term valuation reset will be better positioned to act deliberately rather than reactively if this correction deepens.
For investors assessing individual semiconductor names amid the repricing, our dedicated guide to semiconductor stock valuations examines the name-by-name valuation framework across the sector, from Micron at under 9x forward earnings to Intel at 101x, and explains which valuation tools apply to hypergrowth names versus cyclical recovery plays.
This article is for informational purposes only and should not be considered financial advice. Investors should conduct their own research and consult with financial professionals before making investment decisions. Past performance does not guarantee future results. Financial projections are subject to market conditions and various risk factors.
—
The pullback is driven by a repricing of AI infrastructure and semiconductor stocks, as investors question whether the enormous capital deployed into data centres and chips will deliver economic returns on any near-term timeline, compounded by elevated interest rates that make distant earnings harder to justify at current valuations.
The Nasdaq 100's 3.3% decline versus the S&P 500's 1.4% drop reflects sector-specific stress concentrated in AI hardware, semiconductors, and mega-cap tech, rather than broad market weakness, meaning the selling is a targeted valuation reset rather than a systemic risk event.
The most critical near-term level is 29,400, which aligns with the rising trendline from the April 2026 low; a convincing bounce here supports the orderly correction reading, while a clean break below it opens the path toward deeper structural support at 28,500.
Five signals define the outlook: whether 29,400 holds, the quality of earnings guidance from AI infrastructure companies, semiconductor sector relative performance, whether selling broadens into S&P 500 cyclicals and defensives, and the character of any recovery attempts toward the 29,700 resistance level.
During a repricing of the broader AI theme, focusing on companies with strong free cash flow, concrete and measurable AI revenue streams, and durable competitive moats, such as ecosystem lock-in or proprietary data, separates names with demonstrable near-term returns from those with aspirational or distant payoffs.