SpaceX opened at $150 on 12 June 2026 and closed above $160, leaving the company valued at approximately $2.1 trillion on $18.7 billion of trailing revenue. That is a trailing price-to-sales multiple of roughly 112x, placing it among the most richly valued companies ever to list on a public exchange.
Elon Musk followed the IPO with a social media post projecting $1 trillion in revenue by 2030 or 2031. That projection, combined with the valuation, creates a specific and testable analytical question: what growth rate is already embedded in the price, and is there any historical precedent for achieving it?
This analysis answers that question precisely, then connects it to two structural forces, forced index buying and staggered insider unlocks, that are set to shape SpaceX’s price dynamics through late 2026. The result is a concrete framework for assessing whether the current price reflects business value, structural buying pressure, or some combination of the two.
What $2.1 trillion actually requires SpaceX to prove
Start with the revenue base. SpaceX generated $18.7 billion in 2025, representing 33% year-over-year growth. Musk’s target is $1 trillion by 2030. The arithmetic that connects those two numbers is not ambiguous.
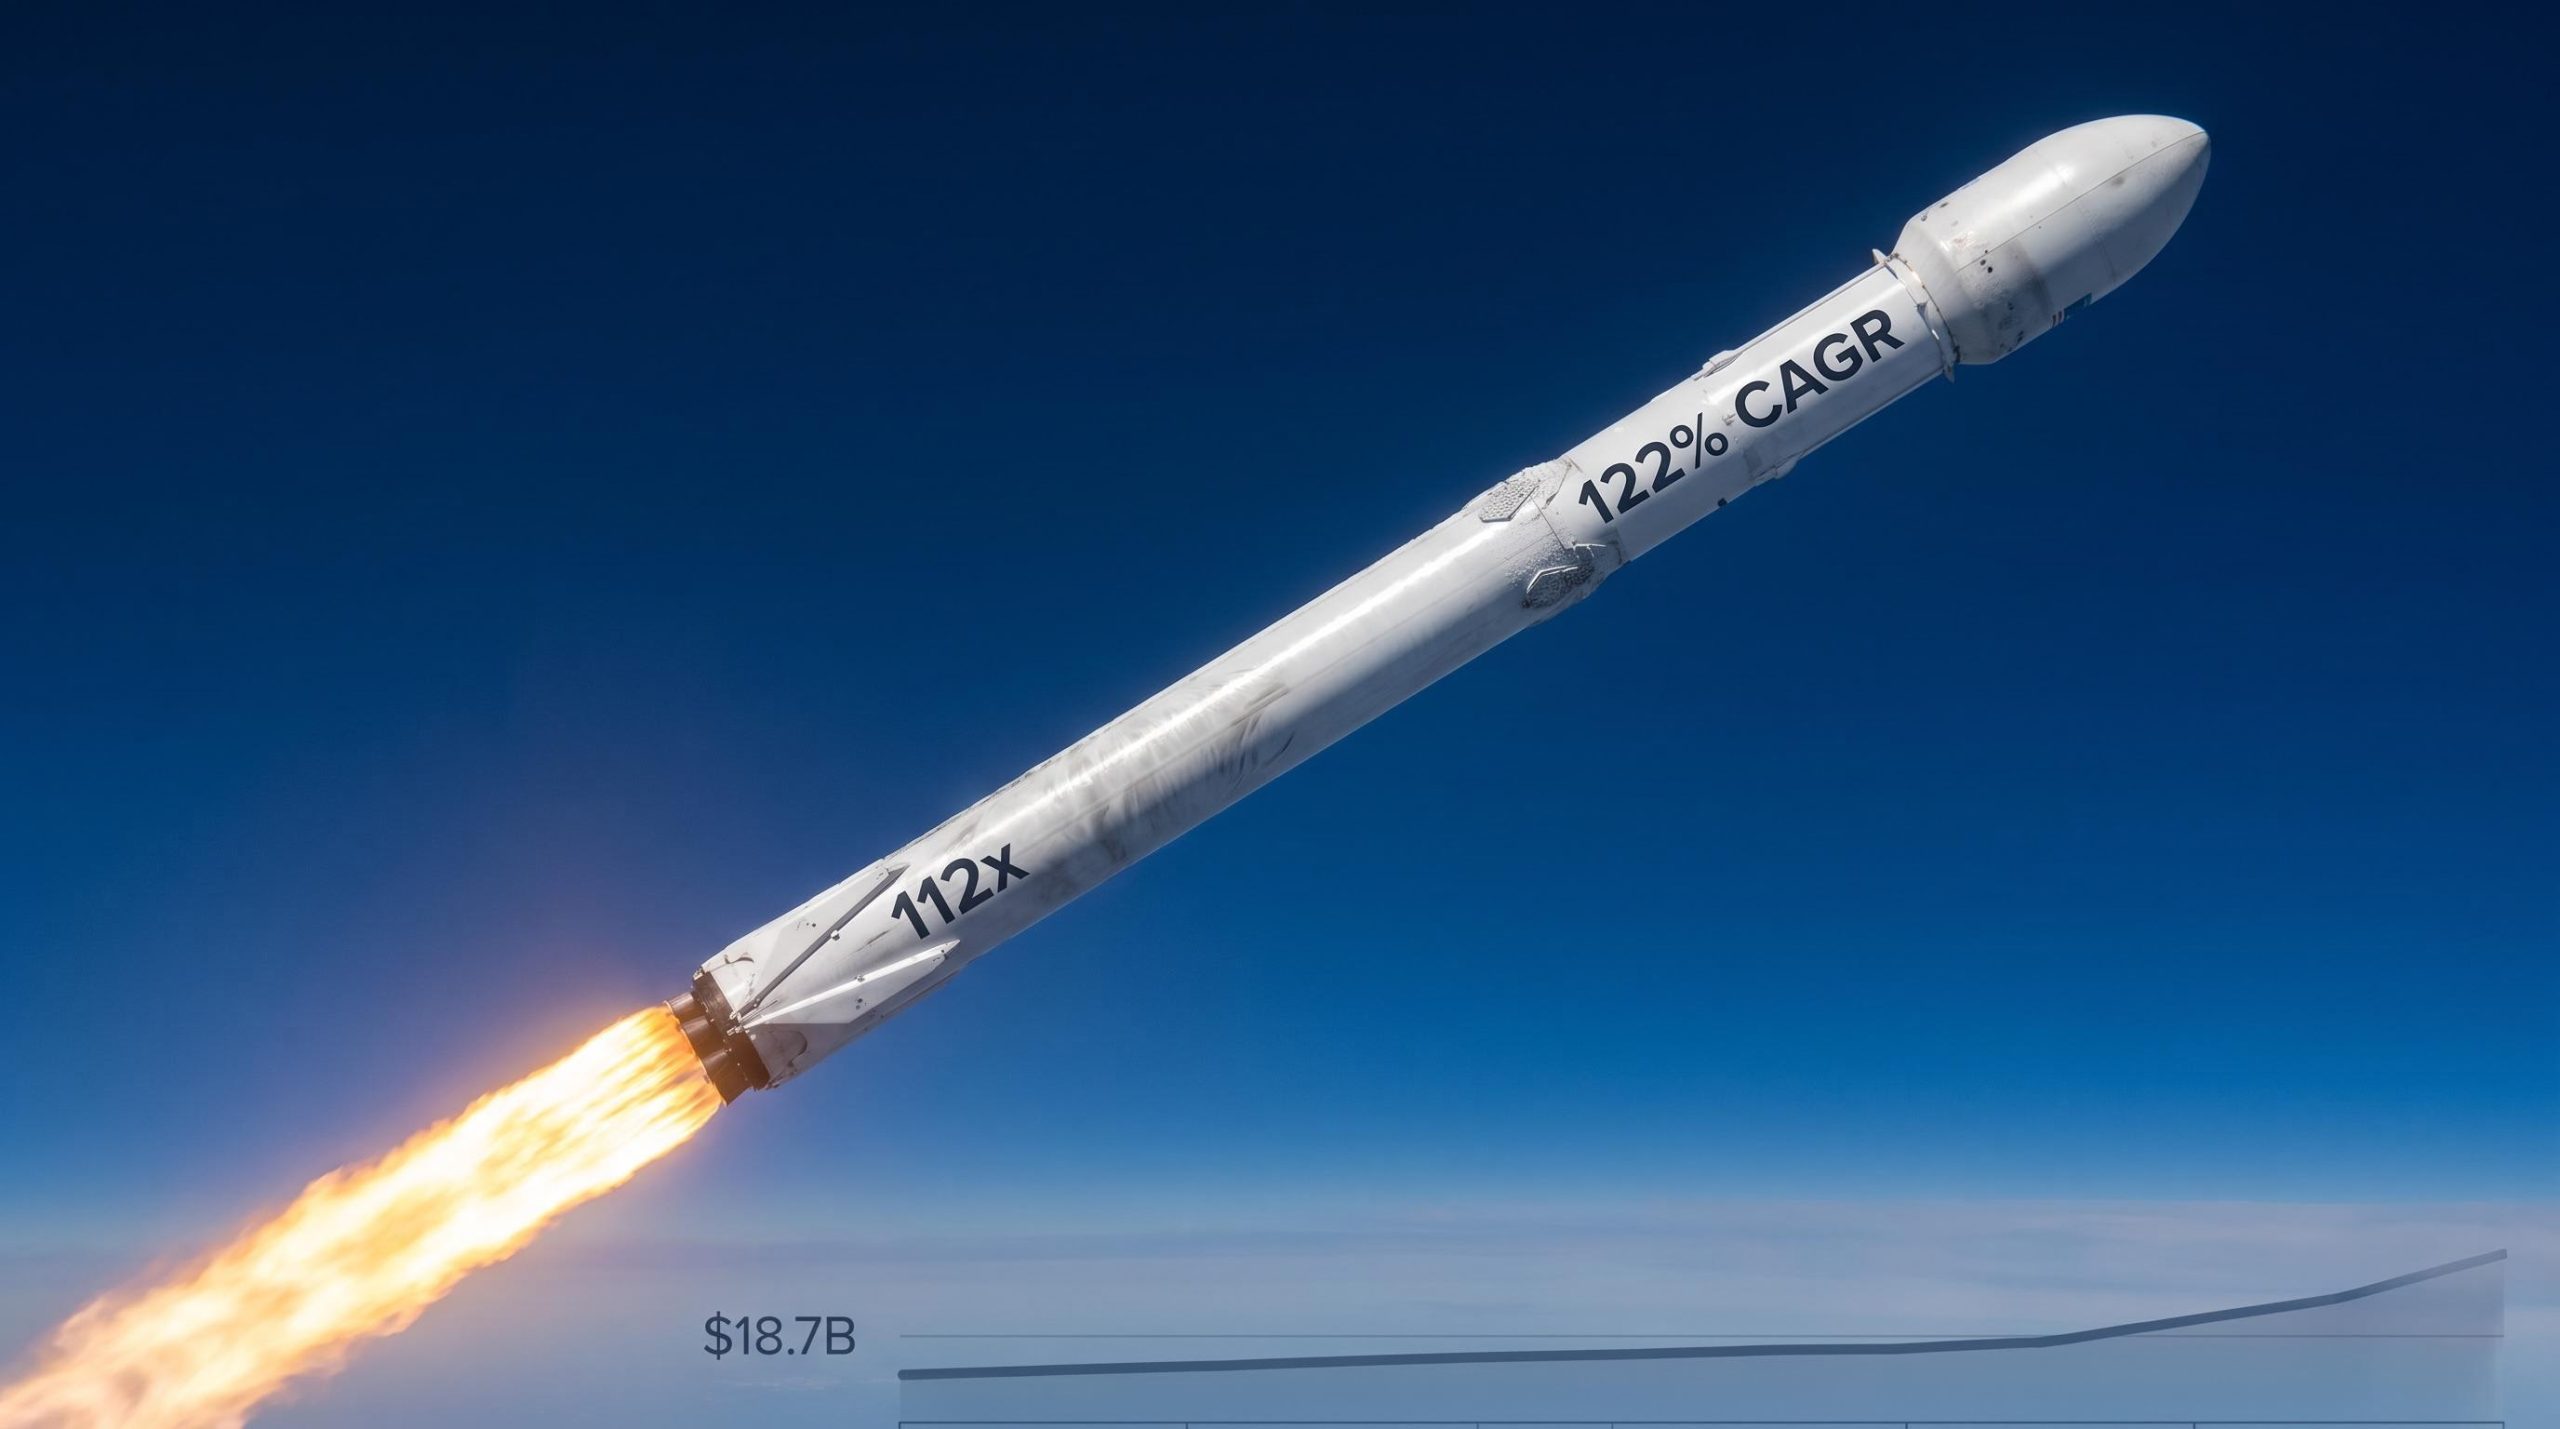
Reaching $1 trillion from $18.7 billion in five years requires a compound annual growth rate of approximately 122%.
That is not a bear case or a bull case. It is the growth rate that any investor paying today’s price is implicitly endorsing. The compound path looks like this:
| Year | Required Revenue | Year-on-Year Change |
|---|---|---|
| 2025 (actual) | $18.7 billion | 33% |
| 2026 | $41.5 billion | ~122% |
| 2027 | $92 billion | ~122% |
| 2028 | $204 billion | ~122% |
| 2029 | $453 billion | ~122% |
| 2030 | $1 trillion | ~122% |
The valuation is not necessarily irrational. It may, however, already reflect the full bull case, leaving minimal margin for the reality that even exceptional businesses miss targets. At 112x trailing sales, investors only generate strong returns if actual outcomes exceed those already optimistic expectations.
SpaceX’s record-setting debut on 12 June 2026 saw SPCX open at $150, hit an intraday high of $176.52, and close near $161, compressing five weeks of typical post-IPO price discovery into a single session and establishing the $2.1 trillion market cap figure that underpins every number in this analysis.
When big ASX news breaks, our subscribers know first
How that growth rate compares to every mega-cap that came before it
The 122% implied CAGR becomes more concrete when placed alongside the strongest sustained growth periods recorded by the largest companies on Earth.
Apple’s peak five-year revenue CAGR during the iPhone era, the most commercially successful product launch in corporate history, reached approximately 26%. Amazon’s comparable peak during the combined e-commerce and AWS expansion phase reached approximately 30%. Both achieved these rates from revenue bases that were already substantial.
The required SpaceX growth rate is roughly four times the historical mega-cap peak.
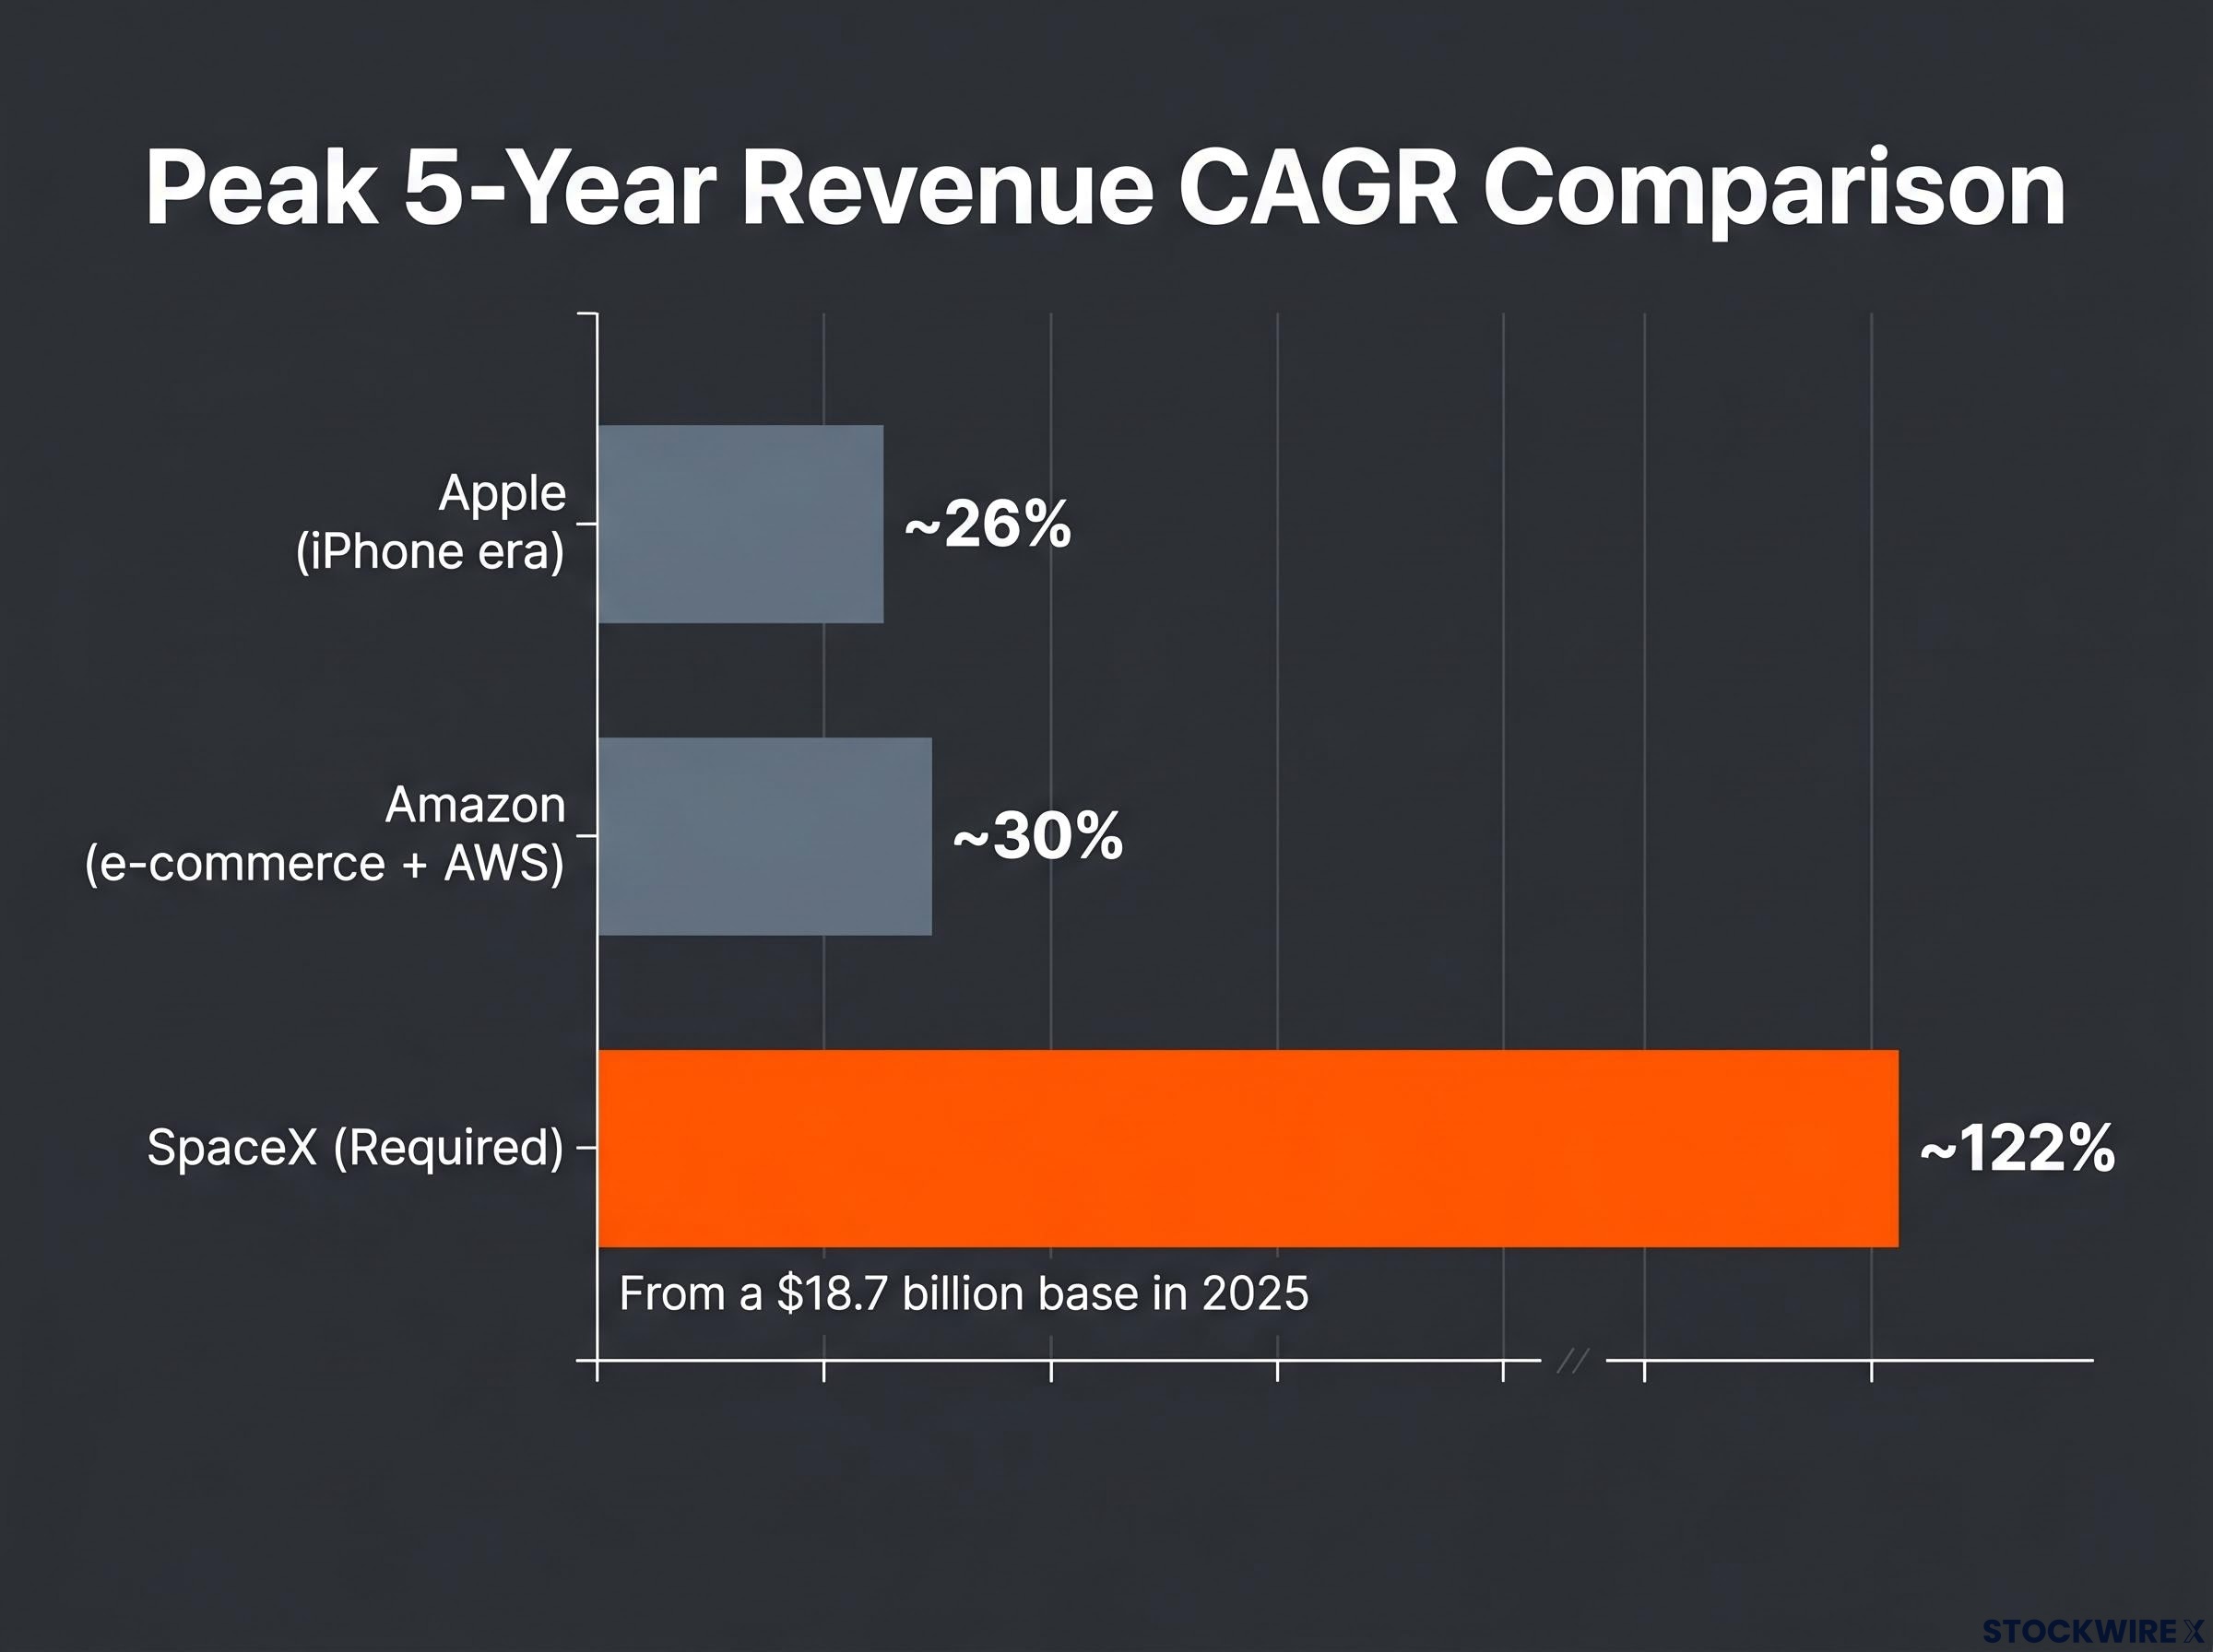
| Company | Peak 5-Year Revenue CAGR | Revenue Base at Measurement |
|---|---|---|
| Apple (iPhone era) | ~26% | Comparable large-cap scale |
| Amazon (e-commerce + AWS) | ~30% | Comparable large-cap scale |
| SpaceX (required) | ~122% | $18.7 billion (2025) |
No company with a revenue base approaching $20 billion has sustained anything resembling this rate. SpaceX is a genuinely extraordinary business; it reported an operating loss of $2.6 billion for full-year 2025 and $1.94 billion in Q1 2026 alone, meaning the revenue trajectory must be achieved while simultaneously reaching profitability. The gap between the required growth rate and any historical precedent is not a matter of degree. It is a difference in kind.
Investors wanting to stress-test the $2.1 trillion figure under different terminal multiple assumptions will find our full explainer on the reverse-engineered SpaceX valuation, which models how even Wall Street’s most optimistic forecasts from Goldman Sachs and Morgan Stanley still imply 77-91% annual revenue growth and fall far short of the Musk scenario.
The mechanical buying wave that is already pushing the price
There is a second force acting on SpaceX’s share price that has nothing to do with the fundamental debate. It is structural, it is mechanical, and it is already in motion.
When a company is added to a major stock index, every fund that tracks that index must purchase shares in proportion to the company’s weighting. This buying is not discretionary. Fund managers do not evaluate whether the price is attractive; they are contractually required to match the index. The purchases are concentrated around rebalancing and effective inclusion dates, creating a wave of demand that is both predictable in timing and indifferent to valuation.
SpaceX is listed on the Nasdaq under ticker SPCX. Its projected Nasdaq-100 weighting is approximately 0.5%. The mechanical demand peak is expected around early July 2026, when rebalancing windows for the Nasdaq-100 and Russell indices open. On 4 June 2026, S&P Global publicly confirmed that it would not create an accelerated inclusion pathway for SpaceX, meaning the S&P 500 remains off limits until the company meets the index’s GAAP profitability criteria. SpaceX reported a GAAP net loss of approximately $4.9 billion for full-year 2025.
Which investors are actually exposed to forced buying
The distinction matters for portfolio construction:
- S&P 500 fund holders (VOO-style products): Face no immediate forced-buying exposure. SpaceX cannot enter the S&P 500 until it demonstrates GAAP profitability, and S&P Global has declined to waive that requirement.
- Nasdaq-100 and Russell ETF holders: Their funds are required to purchase SpaceX upon index inclusion. These investors are indirectly positioned as non-discretionary buyers during the mechanical demand window, whether they realise it or not.
The practical question is straightforward: do you know which index products you hold, and do you understand which ones are making you a buyer?
Tesla’s S&P 500 inclusion shows what happens after the wave breaks
The closest publicly documented parallel is Tesla’s S&P 500 inclusion in late 2020. The sequencing is worth reconstructing in detail.
On 16 November 2020, S&P Dow Jones Indices announced Tesla would be added to the S&P 500. The effective inclusion date was set for 21 December 2020, five weeks later. Between the announcement and the inclusion date, Tesla’s share price appreciated by approximately 40%.
That 40% appreciation was driven substantially by forced buying from funds required to hold every S&P 500 constituent in proportion to its index weight.
Estimated forced purchases by S&P 500 tracking funds totalled between $50 billion and $80 billion. Tesla entered the index at a weighting of 1.69%. Active managers benchmarked to the S&P 500 contributed additional buying pressure beyond the mandatory fund purchases.
| Event | Date | Price Context | Forced Buying Magnitude |
|---|---|---|---|
| Inclusion announced | 16 November 2020 | Pre-announcement price | N/A |
| Effective inclusion | 21 December 2020 | ~40% above announcement | $50-$80 billion (estimated) |
| Post-inclusion normalisation | 2021 onward | Risk-adjusted underperformance | One-time flows absorbed |
Following the absorption of mechanical demand, Tesla’s risk-adjusted returns underperformed the broader market. The one-time forced flows normalised, and the price reflected fundamental expectations once again.
The Research Affiliates analysis of Tesla’s S&P 500 inclusion estimated forced passive fund purchases at approximately $78 billion and documented a 57% price appreciation in the month before effective inclusion, followed by sustained underperformance relative to the broader index once those one-time flows were absorbed.
SpaceX’s projected Nasdaq-100 weighting of 0.5% is smaller than Tesla’s 1.69% S&P 500 weight. But SpaceX is newly public with a far smaller free float relative to total shares outstanding due to the lockup structure. Each dollar of forced index demand plausibly has greater price impact for SpaceX than it did for Tesla, implying both that the inclusion-driven spike could be larger in amplitude and that the subsequent normalisation could be more pronounced.
The insider unlock schedule and why its timing matters
The forced-buying wave peaks around early July 2026. The first insider unlock opens on 21 August 2026. The sequencing is worth examining closely.
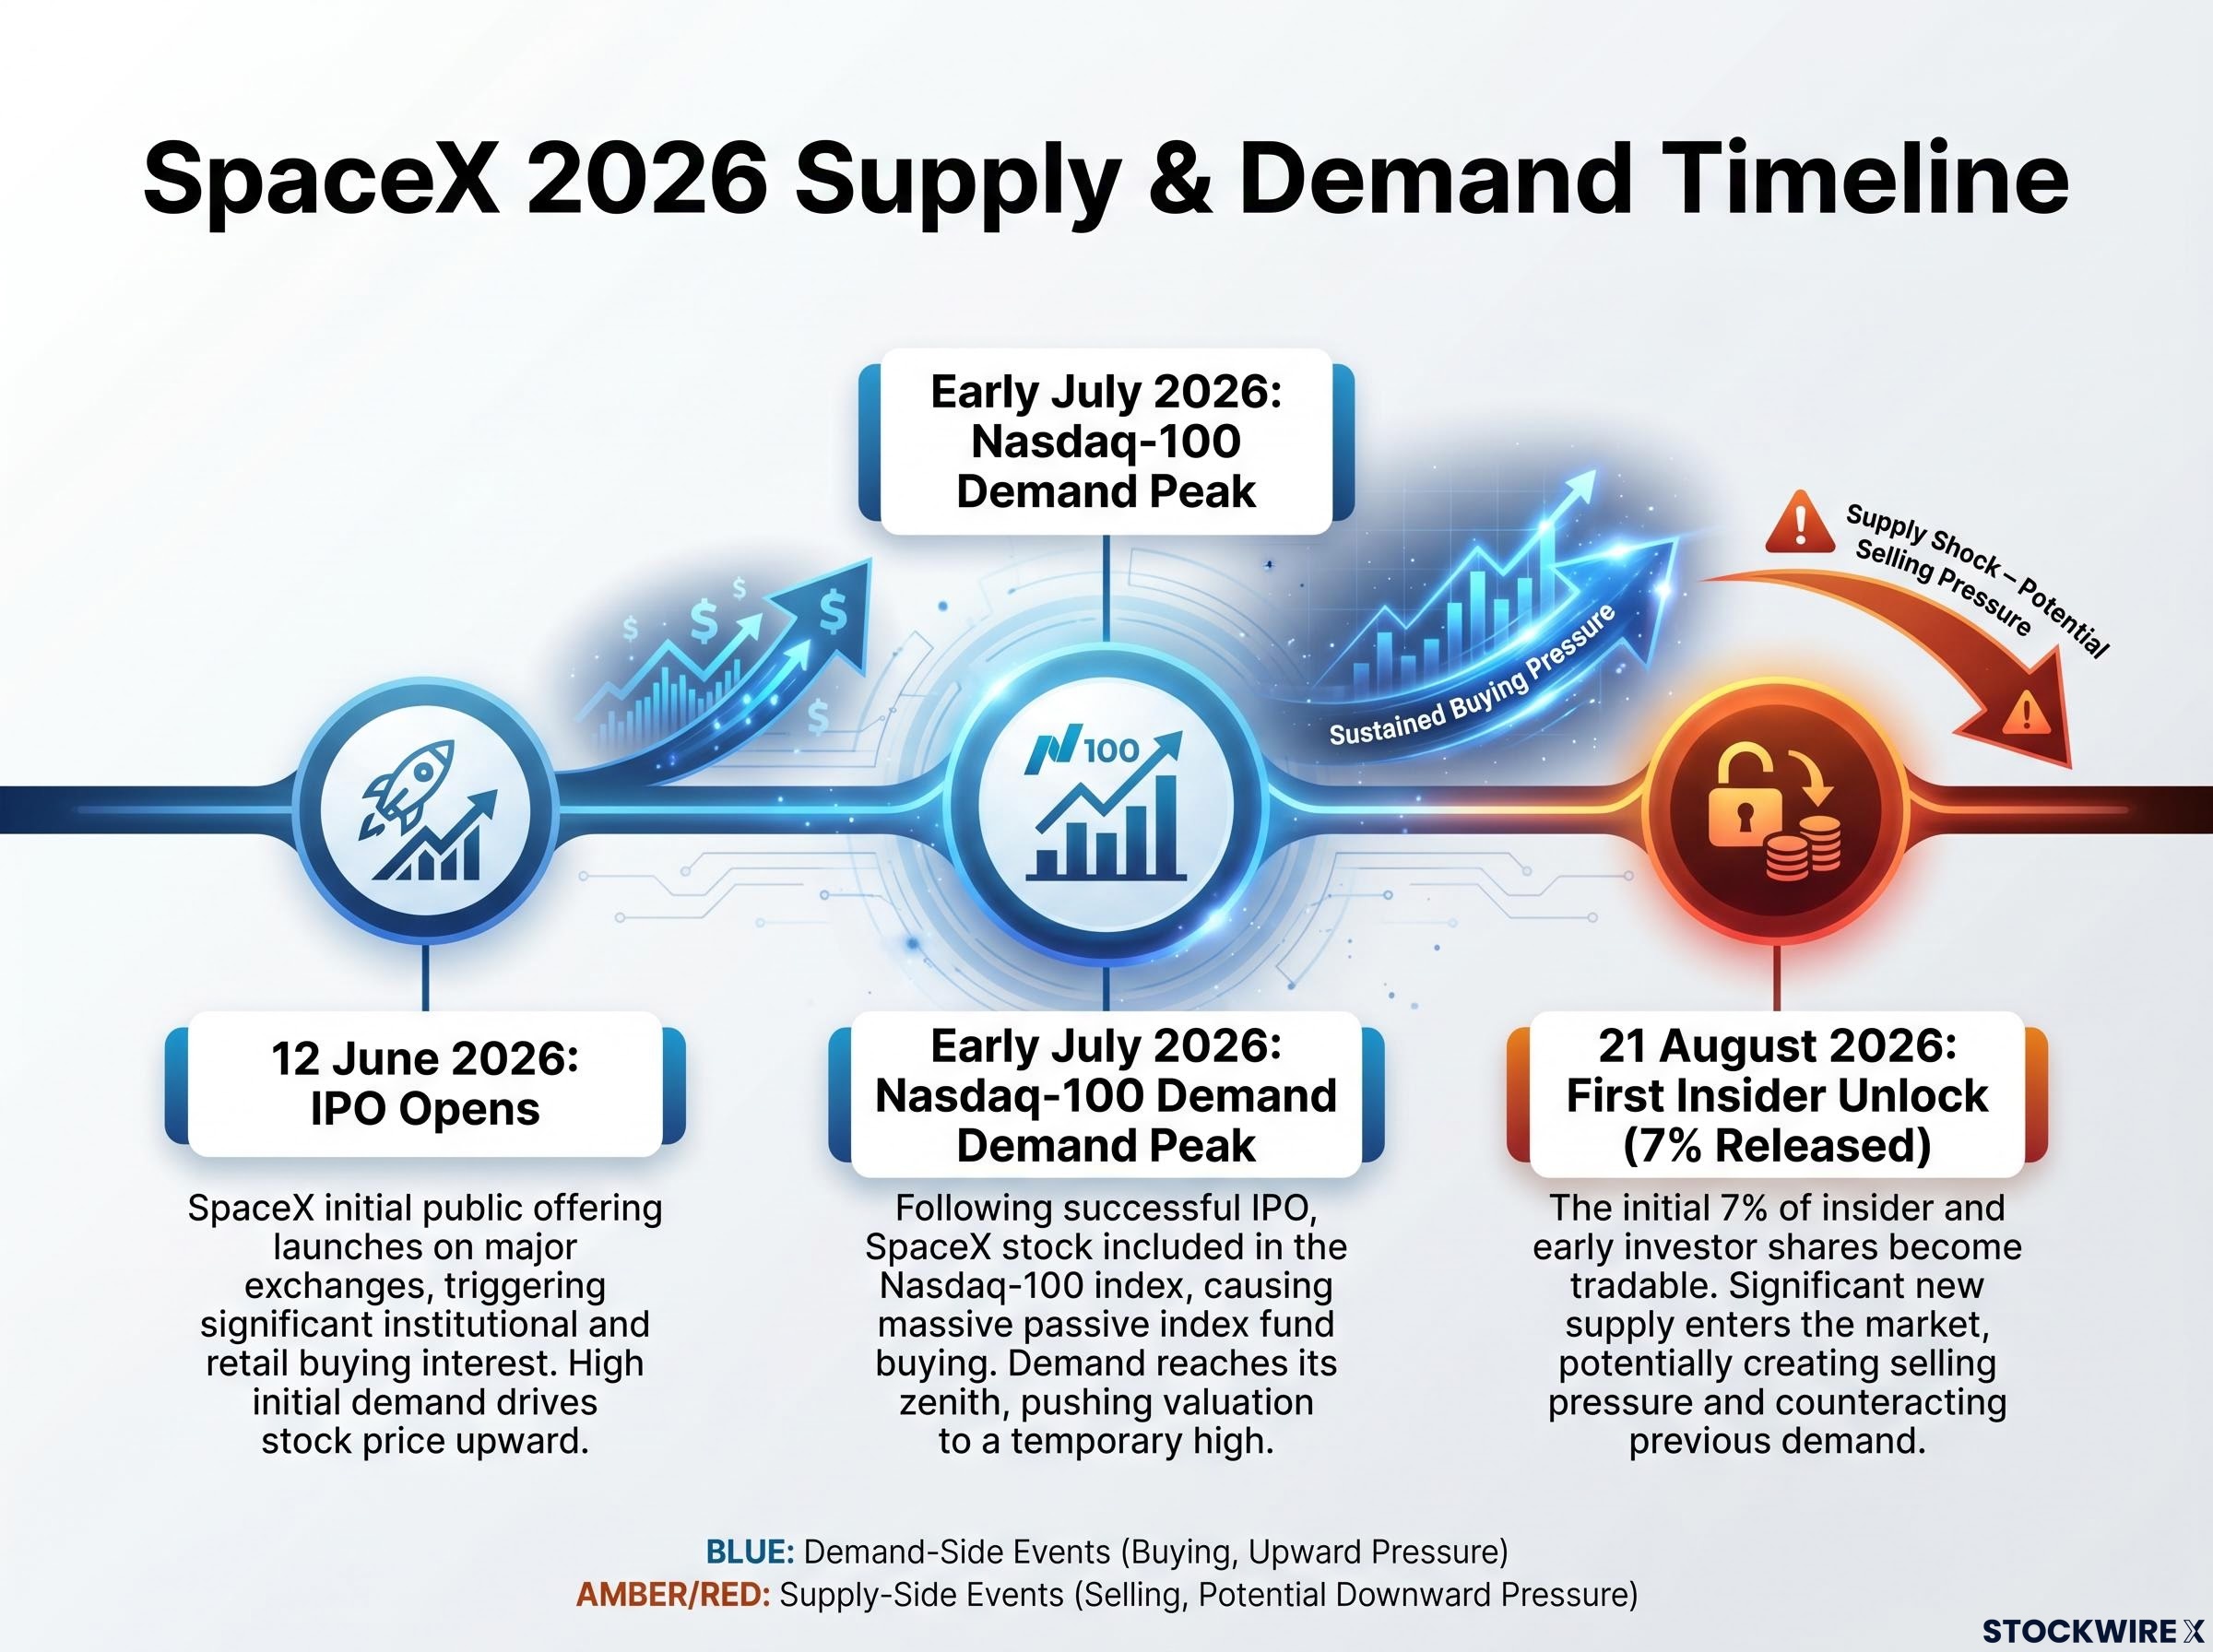
According to the SpaceX IPO prospectus, the insider lockup releases in staggered tranches:
The staggered lockup design is structured so that approximately 83% of eligible insider shares unlock before the standard 180-day expiration date of 9 December 2026, reframing that endpoint as a cleanup event rather than the primary supply moment and concentrating the most consequential sell windows in the August-to-October window.
| Tranche | Date or Trigger | Insider Shares Released | Cumulative Released |
|---|---|---|---|
| First unlock | 21 August 2026 | 7% | 7% |
| Four staggered tranches | Subsequent nine weeks | 28% | 35% |
| Q2 earnings release | Earnings-related | 20% | 55% |
| Performance trigger | Share price of $175.50 | Additional (prospectus terms) | Varies |
The structural asymmetry is specific: passive index fund holders are positioned as forced buyers near the demand peak in early July. Insiders are positioned as discretionary sellers into prices elevated by that same demand, beginning in late August. The two waves are sequenced such that each enables the other.
This is not unusual in IPO design. Staggered lockups are standard practice to avoid concentrated supply. But the dynamic is particularly pronounced when the magnitude of forced buying is large relative to the available float, and when the float itself is constrained by the lockup structure. The practical effect is that passive retirement account holders are positioned as liquidity providers at elevated prices, while insiders are given structured opportunities to sell into those prices over the subsequent weeks.
What the framework means for investors assessing SpaceX today
Three threads run through this analysis: the growth arithmetic, the mechanical demand dynamics, and the insider supply schedule. Each operates on a distinct logic. Together, they define the analytical terrain any investor needs to navigate before taking a position.
The questions to answer before buying or selling are specific and falsifiable:
Post-IPO return profiles vary sharply depending on entry timing: Cerebras Systems allocants at $185 held a 24% gain three weeks after listing while day-one open-market buyers at $350 sat on a 34% loss, illustrating that the same company can produce opposite outcomes for investors separated only by which side of the offering price they entered on.
- Can SpaceX sustain a 122% compound annual revenue growth rate from a $18.7 billion base, a rate roughly four times faster than the strongest sustained growth ever recorded by Apple or Amazon at comparable scale?
- Do you understand which of your index fund products are non-discretionary buyers of SpaceX during the mechanical demand window, and have you assessed whether that exposure aligns with your investment view?
- Does your price assumption account for the supply dynamics arriving from August 2026 onward, when insider lockup tranches begin releasing into what may be a post-peak demand environment?
The key data anchors for ongoing monitoring:
- Trailing price-to-sales multiple: approximately 112x
- First insider unlock: 21 August 2026
- S&P 500 inclusion: contingent on GAAP profitability, with no accelerated pathway confirmed
SpaceX may be the most important company of the next decade, and that is exactly the problem
SpaceX could achieve outcomes that justify today’s price. The business spans orbital launch, satellite broadband, and deep-space exploration, and it has no peer in any of those categories. The point of this analysis is not to predict failure. It is to identify precisely what would have to be true for today’s price to be correct, and to demonstrate that structural forces are operating on the share price independently of the fundamental story.
An extraordinary company and an extraordinary price are not the same thing. The strongest bull case for SpaceX the business and the strongest caution about SpaceX the stock are not in tension; they are the same argument. A price that already embeds the best-case scenario leaves no margin for the reality that even extraordinary companies miss targets. The 122% CAGR is the single number the investment thesis lives or dies on. The first insider unlock arrives on 21 August 2026, approximately ten weeks after listing.
Understanding structural supply and demand dynamics is not a substitute for a view on the business. It is a necessary complement to one.
This article is for informational purposes only and should not be considered financial advice. Investors should conduct their own research and consult with financial professionals before making investment decisions. Past performance does not guarantee future results. Financial projections are subject to market conditions and various risk factors.