The weakest payroll print in the research window did not dislodge the dollar. Nonfarm payrolls rose just 29,000 in September and unemployment ticked up to 4.2%, yet the US Dollar Index (DXY) sits near 102.20, a whisker below the yearly high of 102.54 set Monday.
That tension defines the US dollar DXY outlook heading into midweek. A softening labour market is colliding with a 10-year Treasury yield near 5.32%, just under the two-decade high of 5.35% reached Monday. The Federal Open Market Committee (FOMC) minutes arrive on Wednesday 7 October at 18:00, so positioning matters now.
Here is the picture: why the dollar is holding, where the technical lines sit, what could break the trend, and how to read the minutes yourself when they land.
Why is the dollar holding firm when jobs growth has stalled?
The September report looked weak on almost every line. Total payrolls rose 29,000, against an average monthly gain of 45,000 over the prior 12 months, and the unemployment rate climbed from 4.1% to 4.2%.
| Metric | September | Comparison |
|---|---|---|
| Nonfarm payrolls | +29,000 | 12-month average: 45,000 |
| Unemployment rate | 4.2% | 4.1% prior |
| Private payrolls | +46,000 | 89,000 in August; 85,000 consensus |
| Average hourly earnings | 0.1% m/m, 3.0% y/y | Both below consensus |
The dollar shrugged. It gained about 0.08% against the pound, 0.06% against the yen and Swiss franc, and 0.03% against the euro, while edging flat to slightly lower against the Australian dollar. The DXY measures the currency against six peers: the euro, yen, pound, Canadian dollar, Swedish krona and Swiss franc.
The resolution is that markets are pricing the Fed off inflation, not employment. Societe Generale’s Kenneth Broux framed it this way:
Weak payrolls reinforce a pullback in near-term tightening bets, but they do not change the Fed’s hawkish leaning, with inflation the main concern.
What this tells you is that a soft jobs report is not automatically a sell-dollar signal. Yields, not payrolls, are the main driver right now, and traders who treat a miss as bearish are using the wrong framework.
When big ASX news breaks, our subscribers know first
How inflation, real yields and the Fed keep the dollar bid
The policy anchor is the 15-16 September meeting, where the Fed raised rates by 25 basis points in a unanimous 12-0 vote, its first hike in more than three years. The statement said “inflation remains elevated,” and Chair Warsh put it bluntly: “inflation is too high and has been for too long.”
The projections back that up. The Fed’s Summary of Economic Projections lifted 2026 headline PCE inflation to 3.7% and core to 3.4%, from 3.6% and 3.3% in June.
The Fed’s policy tools extend beyond the headline rate, with balance sheet runoff acting as a second tightening lever that feeds into term premium and long-end yields alongside the 25 basis point hike.
Services data points the same way. The ISM Services PMI came in at 54.9, down from 55.4 but well above the 50 line separating expansion from contraction, and its employment sub-index recovered to 50.1 from 47.8. Strong price pressures there suggest inflation could linger into 2027.
The chain that turns this into dollar demand runs in five links:
- Inflation stays elevated, led by services.
- The Fed responds by holding policy restrictive.
- Real yields (yields after stripping out inflation) rise on US assets.
- Term premium, the extra yield investors demand for holding longer bonds, stays high.
- Foreign capital flows into US fixed income, creating dollar demand.
Pricing has moved with the story. CME FedWatch odds of an October hike jumped from 40% to 49% after Warsh’s press conference, then eased once the weak payrolls arrived.
Structural versus cyclical support
Two lenses explain the dollar’s bid. Structural support comes from reserve-currency status and deep, liquid markets, which make high US yields especially potent. Cyclical support comes from the current policy phase: inflation above target and a Fed that has resumed hiking.
Most commentary blends the two, with structural strength amplifying cyclical differentials. For you, the point is that the dollar’s support depends on how long restrictive policy lasts, so data that changes the duration of hikes matters more than a single payroll miss.
What the DXY chart says: strong trend, stretched momentum
On the daily chart, the index sits at 102.14, well above its 20-day exponential moving average (EMA) of 100.96. The EMA is an average that weights recent prices more heavily, so it tracks short-term trend. Price extended its advance after recovering the 100.00 area.
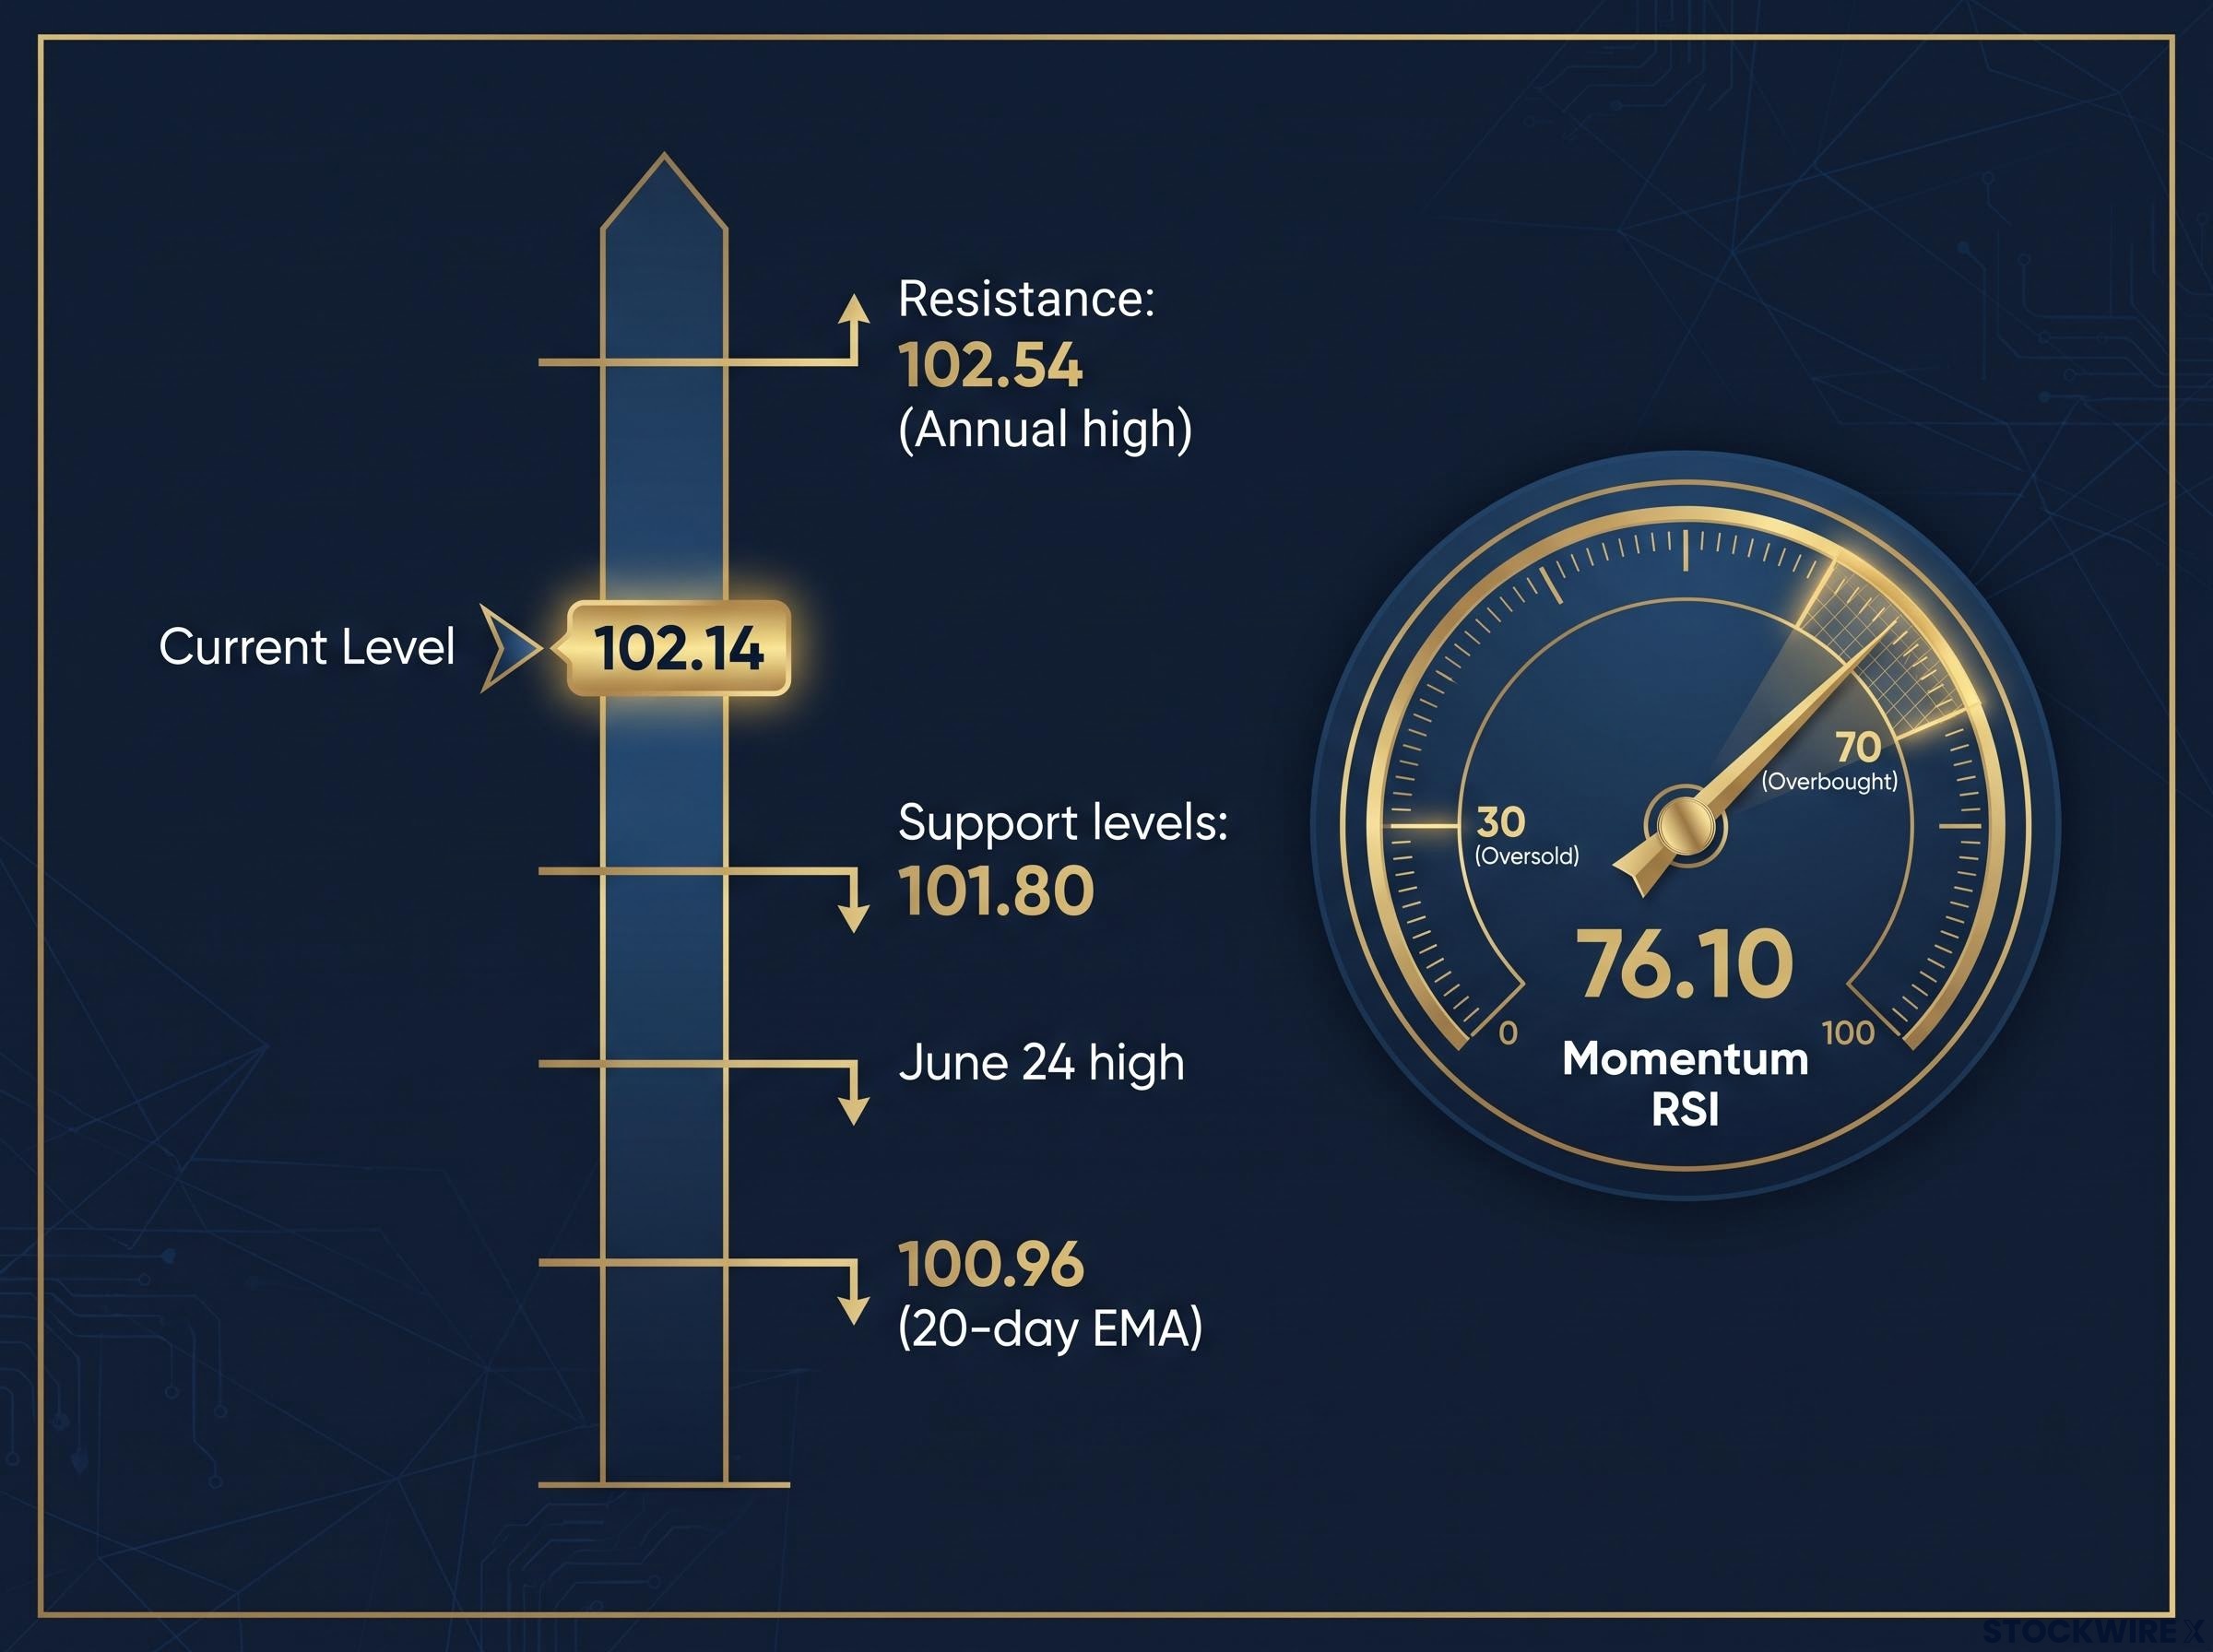
The unease comes from the Relative Strength Index (RSI), a momentum gauge running from 0 to 100. At 76.10, it sits above the 70 line that signals overbought conditions.
| Level | Type | Significance |
|---|---|---|
| 102.54 | Resistance | Annual high, key upside barrier |
| 101.80 | Support | Initial support |
| June 24 high | Support | Next support below 101.80 |
| 100.96 | Support | 20-day EMA |
The trend is bullish, and the momentum reading says the easy gains are likely behind it. You should weigh pullback risk before chasing a move into 102.54.
For readers wanting to apply the same framework themselves, our dedicated guide to DXY technical analysis with EMA and RSI shows how to tie chart signals to Fed policy.
What could knock the dollar off its high?
The most direct threats come from data. Four categories matter:
- Data: Payrolls of 29,000, unemployment at 4.2% and softer wages could push pricing toward earlier cuts, removing yield support.
- Services and inflation: The ISM services PMI slipped to 54.9 from 55.4, and cooler-than-expected July and August CPI readings were noted. A sharper slowdown would weaken the case for extended hawkishness.
- Positioning: An RSI of 76.10 often goes with speculative positioning skewed long, which leaves the market exposed.
- Communication: FedWatch moved from 40% to 49% on one press conference, showing how fast pricing shifts on tone.
A crowded, overbought dollar can fall faster on disappointment than it rises on confirmation.
The research found no references to foreign-exchange intervention. Still, rapid appreciation can draw policymaker attention, and the Fed may stress downside risks, indirectly capping gains.
How to read the FOMC minutes before Wednesday’s release
The minutes are a detailed record of the meeting, published about three weeks after a decision. This one lands Wednesday 7 October at 18:00. Unlike the policy statement, they show how the debate unfolded, though reaction can be delayed because outlets lack advance access.
Investors should also weigh the structural lag in FOMC minutes, since fresher data releases such as PCE and payrolls often overtake the debate the document records before it is even published.
Use this five-point checklist:
- Inflation language: Does the “inflation remains elevated” view look broadly shared, or do some argue it is moderating?
- Vote splits and dissent: The hike was 12-0, so any hint of emerging dissent is a new signal.
- Balance sheet and term premium: Is the rise in long yields treated as excessive, or as a justified response?
- Labour versus growth: Weak payrolls will likely be weighed against firm services activity.
- Historical pattern: Minutes have moved the dollar when they revealed a more hawkish consensus than expected, or exposed dovish concerns.
| Signal | Hawkish reading | Dovish reading |
|---|---|---|
| Inflation | Emphasis on upside risks | Talk of disinflation or overtightening |
| Dissent | Unanimity holds | Emerging disagreement |
| Long yields | Justified by fundamentals | Excess term premium or stress |
| Labour market | Described as stable | Fragility or recession risk |
If you hold a dollar-long view, dissent and overtightening language are the phrases that should make you reassess on Wednesday evening. The skill carries over to every future release.
Weighing trend against risk as the minutes approach
The dollar is supported by inflation-led Fed expectations and high yields. Stretched technicals and softening labour data leave little margin for error.
Three markers frame the decision: the 102.54 breakout level, the 101.80 support, and the minutes’ tone on inflation and dissent. A clean break above the high would confirm the trend, while a slip through support would suggest the overbought reading is resolving lower.
The minutes are the next test of the higher-for-longer thesis. These views are speculative and subject to change based on market developments, and past performance does not guarantee future results.
This article is for informational purposes only and should not be considered financial advice. Investors should conduct their own research and consult with financial professionals before making investment decisions.