The Smartphone Market Paradox: Volume Falls, Value Climbs
8 hrs ago

A fund advertising an 11% yield sounds like it should leave a 1.5% index fund in the dust. Over three years on the same $50,000, the maths should not even be close. Yet the numbers tell a different story. The high-yield private credit fund produced approximately $57,800 in ending wealth. The broad equity index fund produced approximately $78,300. The gap, more than $20,000, did not open because of a scam or a blowup. It opened because yield and total return are not the same thing, and income-focused investors routinely confuse the two. What follows is an examination of exactly how that wealth gap forms, how capital erosion hides behind a large distribution number, what redemption restrictions mean when an exit is needed, and how five questions can cut through any high-yield product pitch before capital is committed.
The comparison below uses a $50,000 starting investment in two vehicles: a high-yield private credit fund advertising an 11% annual yield and a broad equity index fund with an advertised yield of roughly 1.3-1.6%. Both assume full reinvestment of distributions over three years.
| Fund | Advertised Yield | Starting Value | Value After 3 Years | Annualised Return |
|---|---|---|---|---|
| High-Yield Private Credit Fund | 11% | $50,000 | ~$57,800 (~16% total gain) | ~5% |
| Broad Equity Index Fund | ~1.5% | $50,000 | ~$78,300 (~57% total gain) | ~16% |
More than $20,000 difference on the same $50,000 starting investment over three years.
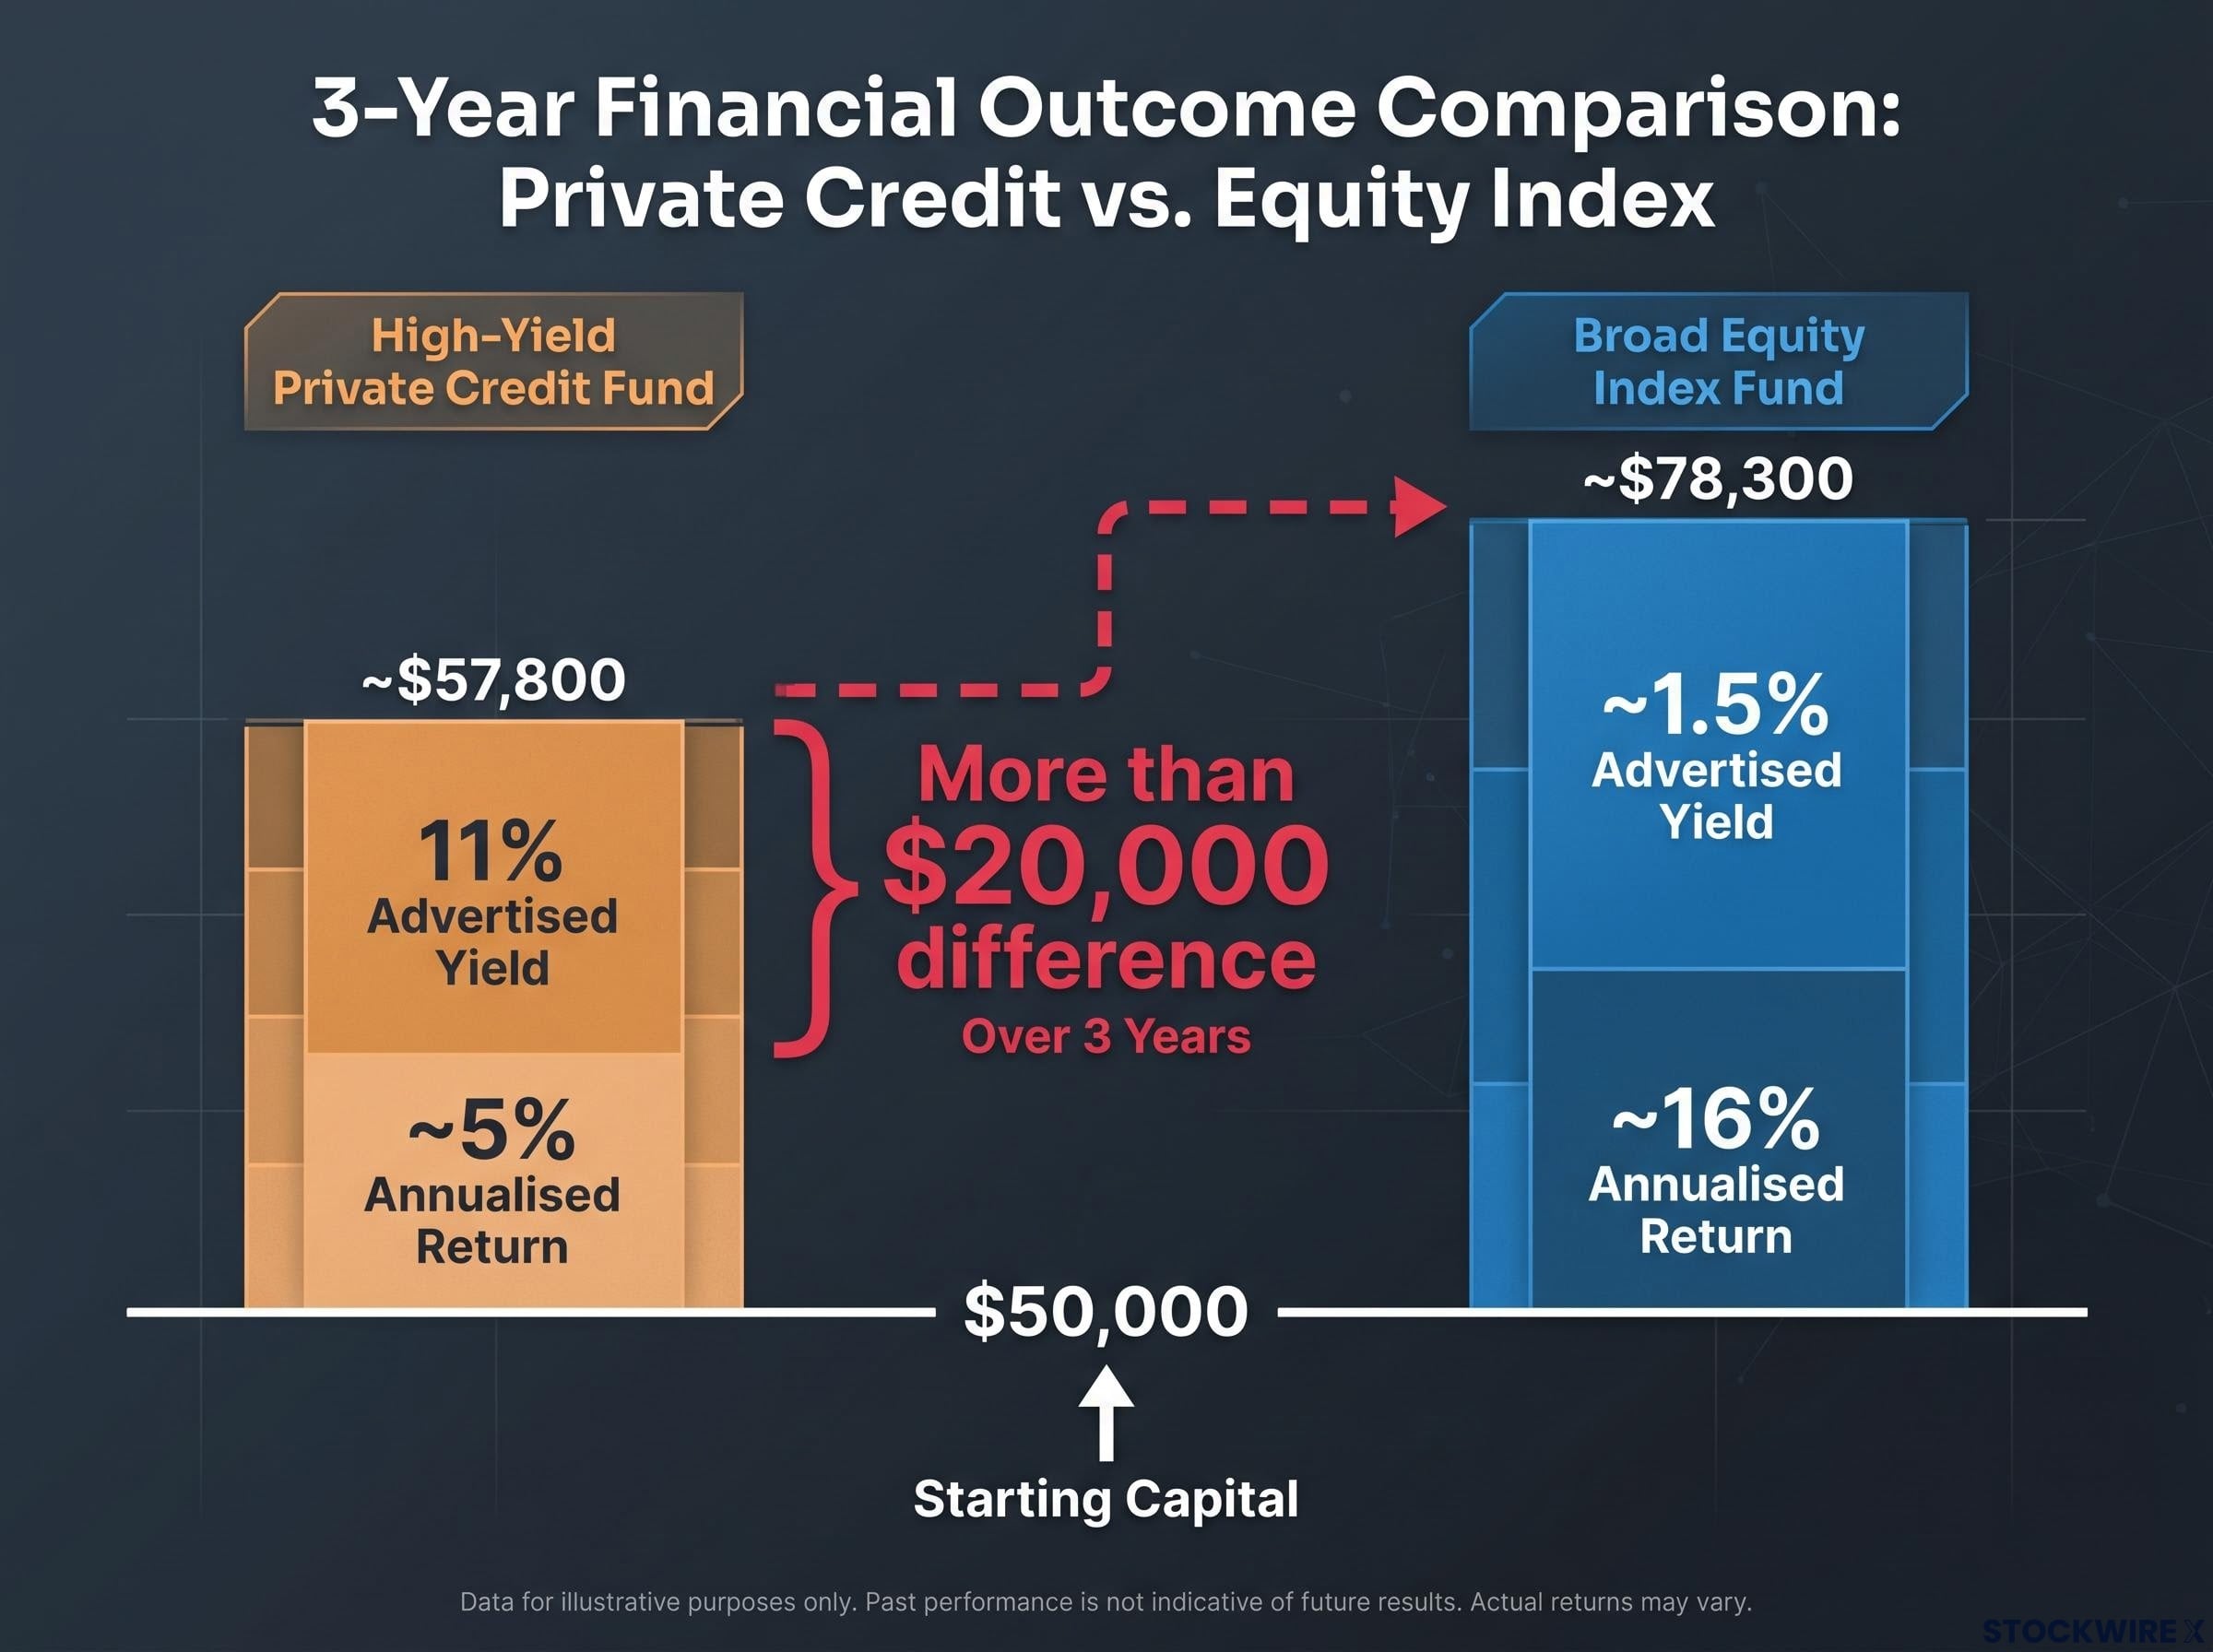
The fund that looked seven times better on a yield screen delivered roughly one-third of the total return. The reason is not a failure of disclosure. It is a predictable consequence of net asset value (NAV) decline partially offsetting the distributions the high-yield fund paid out.
The analytical error at the centre of this gap is straightforward: income investors compare 11% yield to 1.5% yield instead of comparing ~5% total return to ~16% total return. Once that comparison shifts to total return, the index fund wins by a wide margin, and the yield advantage disappears.
The compounding cost of choosing total return versus yield as the wrong primary screen shows up clearly in backtested data: a total market portfolio returned 10.49% annualised from 2016-2025 against 9.43% for a dividend-focused portfolio, a gap that converts to roughly $116,000 in additional wealth on a $100,000 investment over 20 years.
Yield is a cash-flow target. It describes what a fund aims to distribute to investors over a given period. It does not describe what the investor earns after accounting for changes in the value of the underlying portfolio.
The distinction matters because a distribution can represent two very different things. When a fund’s underlying assets hold their value and generate genuine income, the payout is a return on capital. When the portfolio’s value falls while the payout holds steady, part of that distribution is a return of capital: the investor’s own principal handed back in the form of a cheque.
Total return approximately equals distribution yield minus NAV decline.
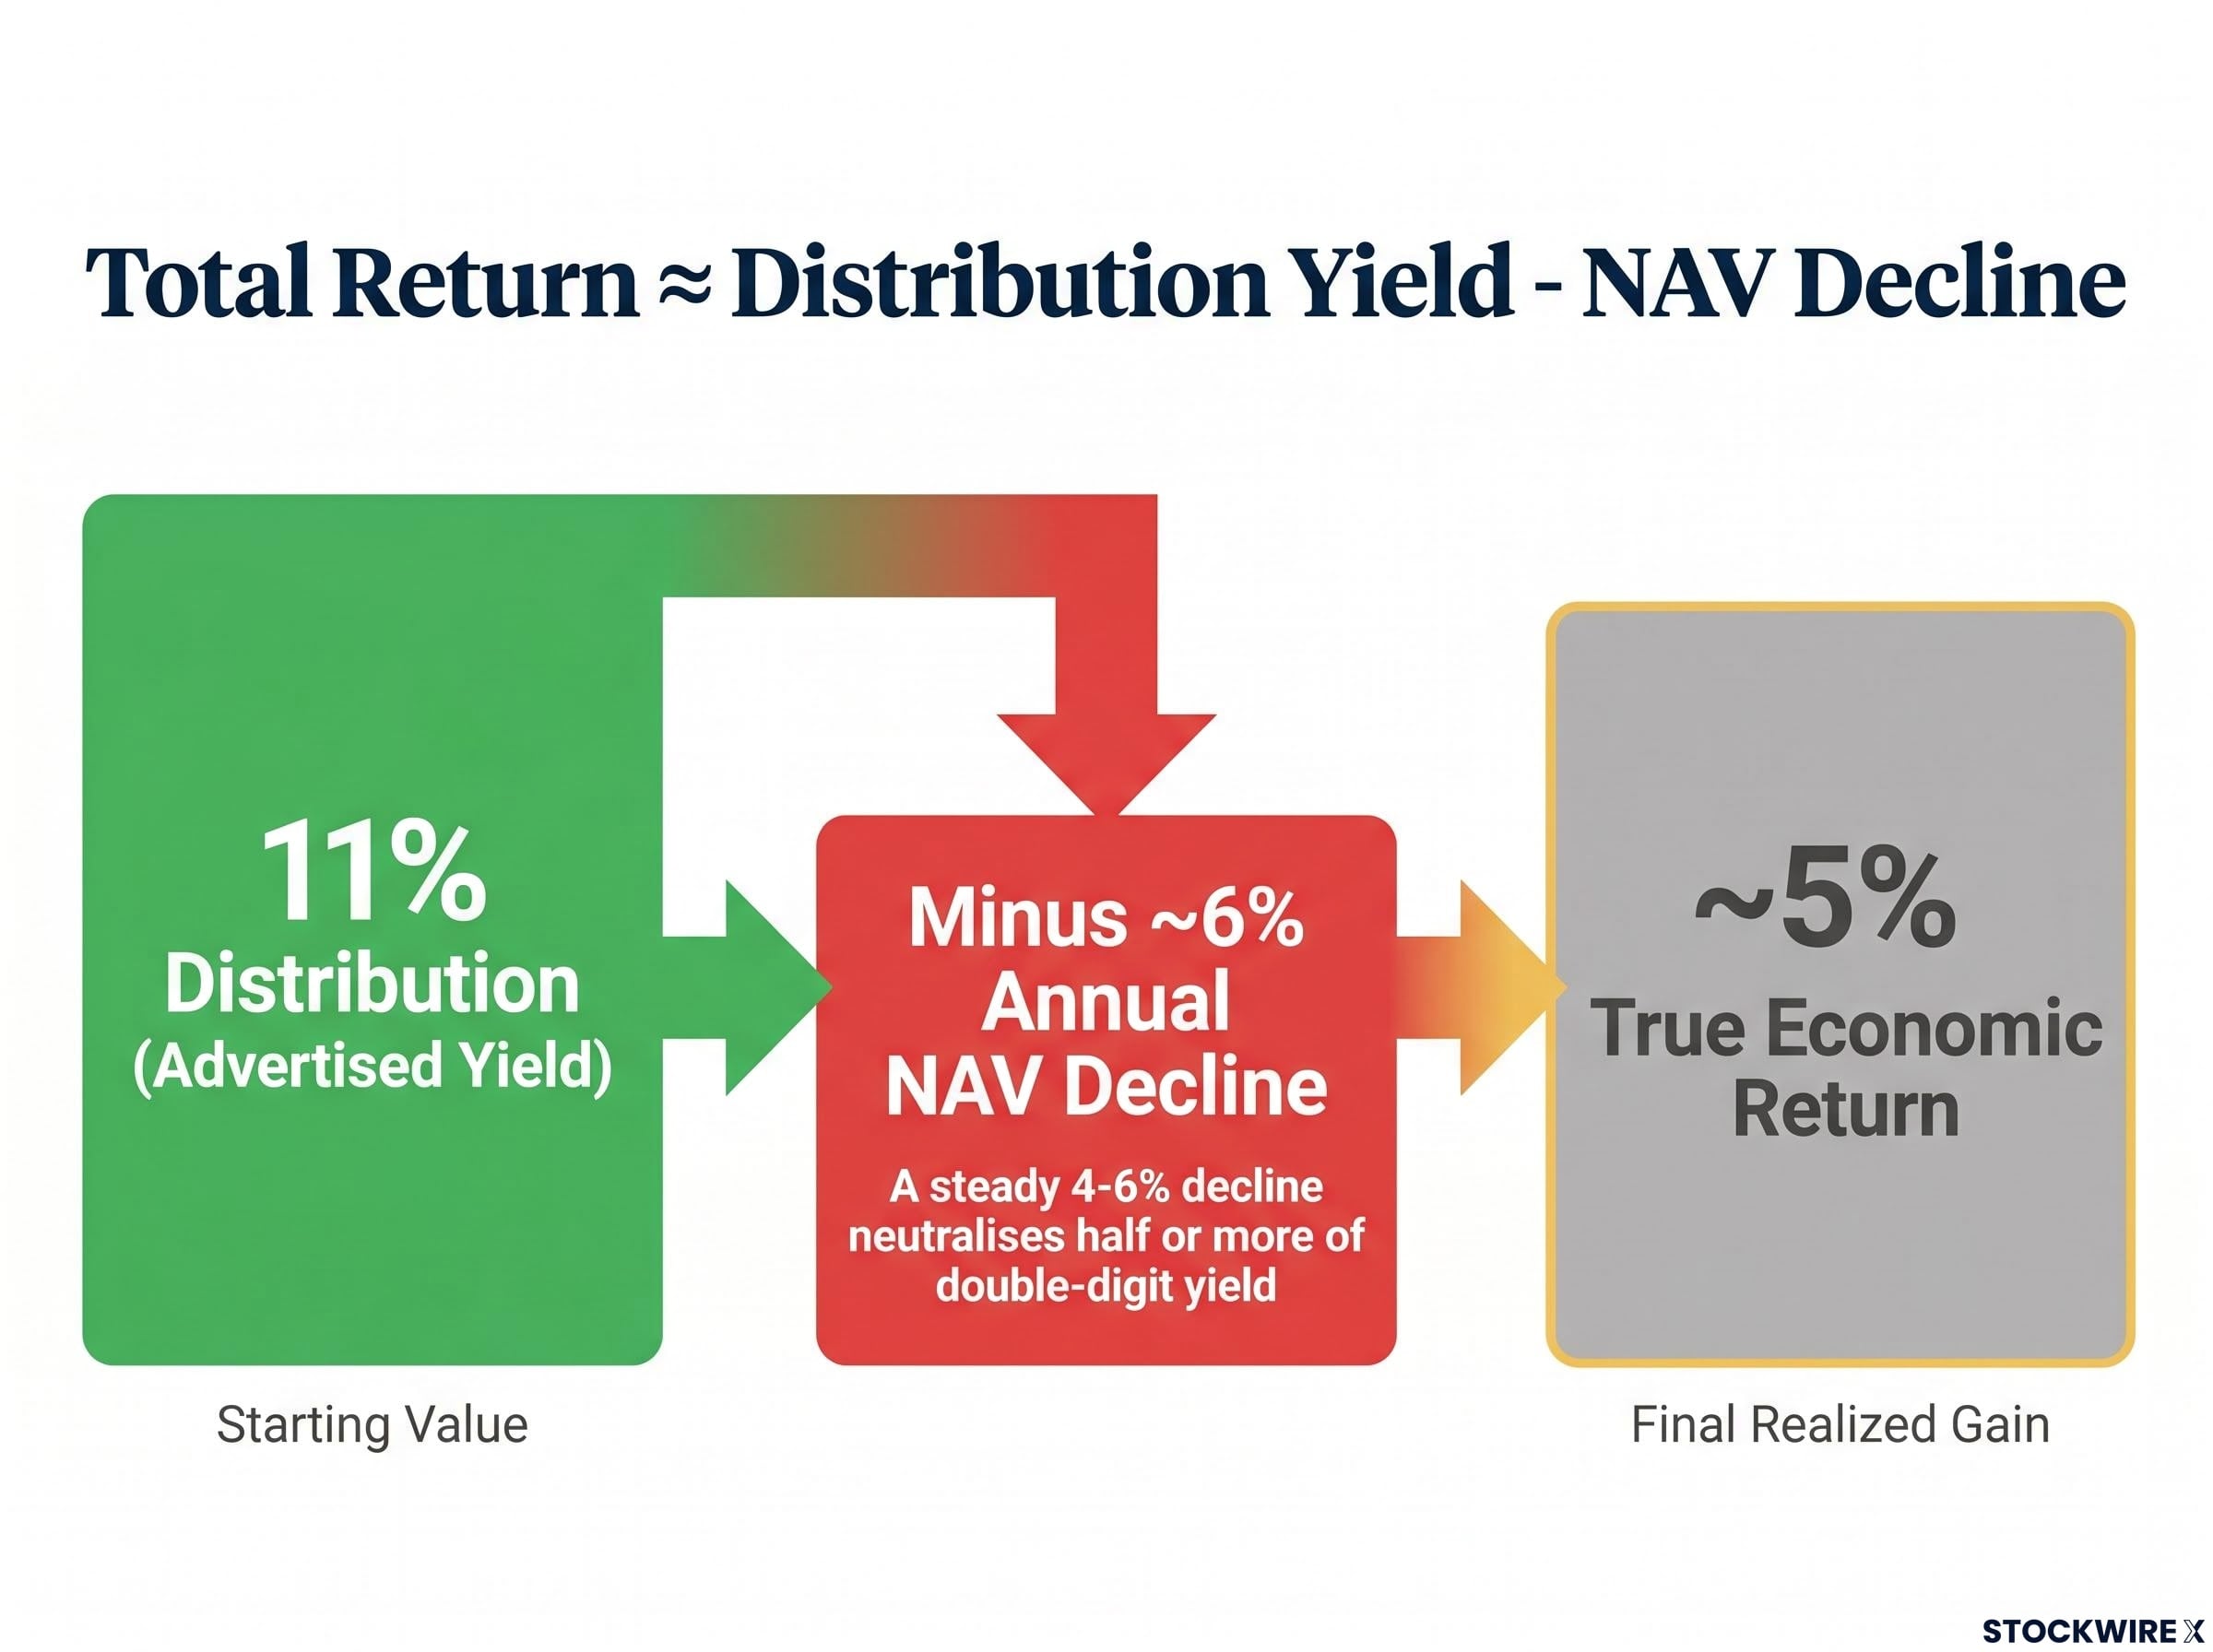
Applied to the high-yield fund: an 11% distribution minus a roughly 6% annual NAV decline produces an approximate 5% true economic return. The investor feels as though they are earning 11%. The account statement, over time, tells a different story.
A high advertised yield also functions as a market signal. The gap between a fund’s headline number and the broader market rate reflects the premium the market demands to compensate for credit risk, default risk, and structural complexity embedded in the portfolio. Treating yield size as a proxy for return quality misreads the signal entirely. Yield tells an investor what the fund wants to pay out. It says nothing about what remains after credit losses, NAV changes, and fees.
The arithmetic above explains the size of the gap. The three mechanisms below explain how the erosion occurs in practice, often without triggering any alarm on a fund’s marketing materials.
NAV erosion rarely arrives as a single dramatic event. More commonly, it takes the form of gradual downward markings in loan values as borrower credit quality weakens or secondary-market pricing adjusts.
When a fund maintains its distribution while its NAV declines, part of what the investor receives is their own principal returned to them.
Payment-in-kind (PIK) interest is a structure in which the borrower does not pay cash. Instead, the borrower adds to its outstanding debt balance, and the fund books this accrual as income.
All three mechanics can operate simultaneously. A fund can experience NAV drift from loan markdowns, distribute a portion of investors’ own capital, and report PIK-inflated income figures, all while maintaining an 11% headline yield on its fact sheet.
Cliffwater Direct Lending Index data for year-end 2025 recorded an estimated realised loss rate of 0.70% and a total return of 9.33% for the period, providing an industry-wide benchmark that illustrates how default drag and fee load compress the headline yield figure that investors typically see in product marketing.
The yield story and the liquidity story are separate risks. The problem is that they tend to converge at exactly the wrong moment.
“You may discover the yield is eroding precisely when the redemption cap prevents you from leaving.”
Most private credit funds are not exchange-traded. Redemptions are typically restricted to quarterly windows, capped at approximately 5% of total fund assets per quarter, and subject to proration if demand exceeds the cap.
In calm conditions, these restrictions may not bind. Under stress, when many investors attempt to exit simultaneously, the 5% cap activates. Redemptions are queued and prorated. Investors may wait multiple quarters for a full exit, during which time NAV can continue to fall and distributions can be reduced.
The private credit liquidity mismatch that regulators at the Federal Reserve, IMF, BIS, and OFR have formally flagged extends the risk described here beyond the individual investor: when funds facing mass redemptions cannot sell illiquid loans quickly, they may be forced to liquidate public equities, transmitting stress into markets that hold no direct private credit exposure.
Recent data illustrates the shift in sentiment. During early 2026, net new inflows into these fund structures declined by roughly 40%. Some funds have already reduced the dividend payments that originally attracted investors.
The contrast with a liquid alternative is stark:
Liquidity risk is the dimension income investors most consistently underweight at the point of entry. Stress-testing the exit, not just the entry yield, is where the evaluation should begin.
The mechanics above convert into a structured evaluation framework. These five questions apply to any high-yield income product, not only the private credit structures discussed here.
Private credit default rates provide the empirical floor under the borrower quality question in the five-question framework: Proskauer’s Private Credit Default Index reached 2.73% in Q1 2026, with Fitch projecting 4.5%-5.0% for leveraged loans across 2026, figures that are directly relevant when assessing whether a fund’s headline yield genuinely compensates for its underlying credit risk.
If the total return comparison produces an unattractive answer, the headline yield is not compensating adequately for the risk and illiquidity being accepted.
The $50,000 comparison is not the result of a scam. It is the predictable outcome of compounding the consequences of capital erosion, fees, and restricted liquidity over time against a benchmark that benefits from four structural advantages: broad market appreciation, dividend reinvestment, low fees, and daily liquidity.
High-yield products are not inherently fraudulent or worthless. Some deliver on their total return promise over full market cycles. The problem is that they are routinely mis-evaluated by investors who compare yield to yield instead of total return to total return, and who underweight exit restrictions until those restrictions bind.
The yield-as-safety narrative faced a direct empirical test in early 2026, when the MSCI World High-Dividend Yield Index fell approximately 7.6% peak to trough while the broader index recovered to all-time highs by mid-April, leaving yield-focused investors with both the downside and the lagging recovery.
Yield tells an investor what a fund wants to pay out. It says nothing about what the investor will earn after credit losses, NAV changes, fees, and liquidity frictions have run their course. The five-question framework above, applied before capital is committed, converts that number from a marketing headline into a starting point for genuine evaluation.
“What matters is not how large the distributions look. It is how much wealth remains, and how freely you can access it, after time, risk, and compounding have done their work.”
This article is for informational purposes only and should not be considered financial advice. Investors should conduct their own research and consult with financial professionals before making investment decisions. Past performance does not guarantee future results. Financial projections are subject to market conditions and various risk factors.
Yield measures the cash distributions a fund pays out as a percentage of its value, while total return measures the actual change in investor wealth including both distributions and any rise or fall in the fund's underlying net asset value (NAV). A fund can advertise an 11% yield while delivering only a 5% total return if its NAV is declining.
When a fund's net asset value falls each year, that capital loss offsets the distributions paid to investors. For example, an 11% distribution yield combined with a 6% annual NAV decline produces an approximate true economic return of only 5%, even though the income payments look attractive on paper.
Most high-yield private credit funds restrict redemptions to quarterly windows capped at around 5% of total fund assets, meaning investors who want to exit during a stress period may face multi-quarter queues while NAV continues to fall and distributions are reduced.
Payment-in-kind (PIK) interest is a structure where a borrower adds to its outstanding debt instead of paying cash, and the fund records this accrual as income. This can inflate a fund's reported yield without any real cash being received, and if the borrower's finances deteriorate, the accrued balance can be written down, reducing the portfolio's value.
Investors should compare total return (NAV change plus distributions, net of fees) over the same time period rather than comparing headline yields. Based on the analysis in this article, a $50,000 investment in a high-yield private credit fund produced roughly $57,800 after three years versus approximately $78,300 for a broad equity index fund, despite the credit fund advertising a far higher yield.