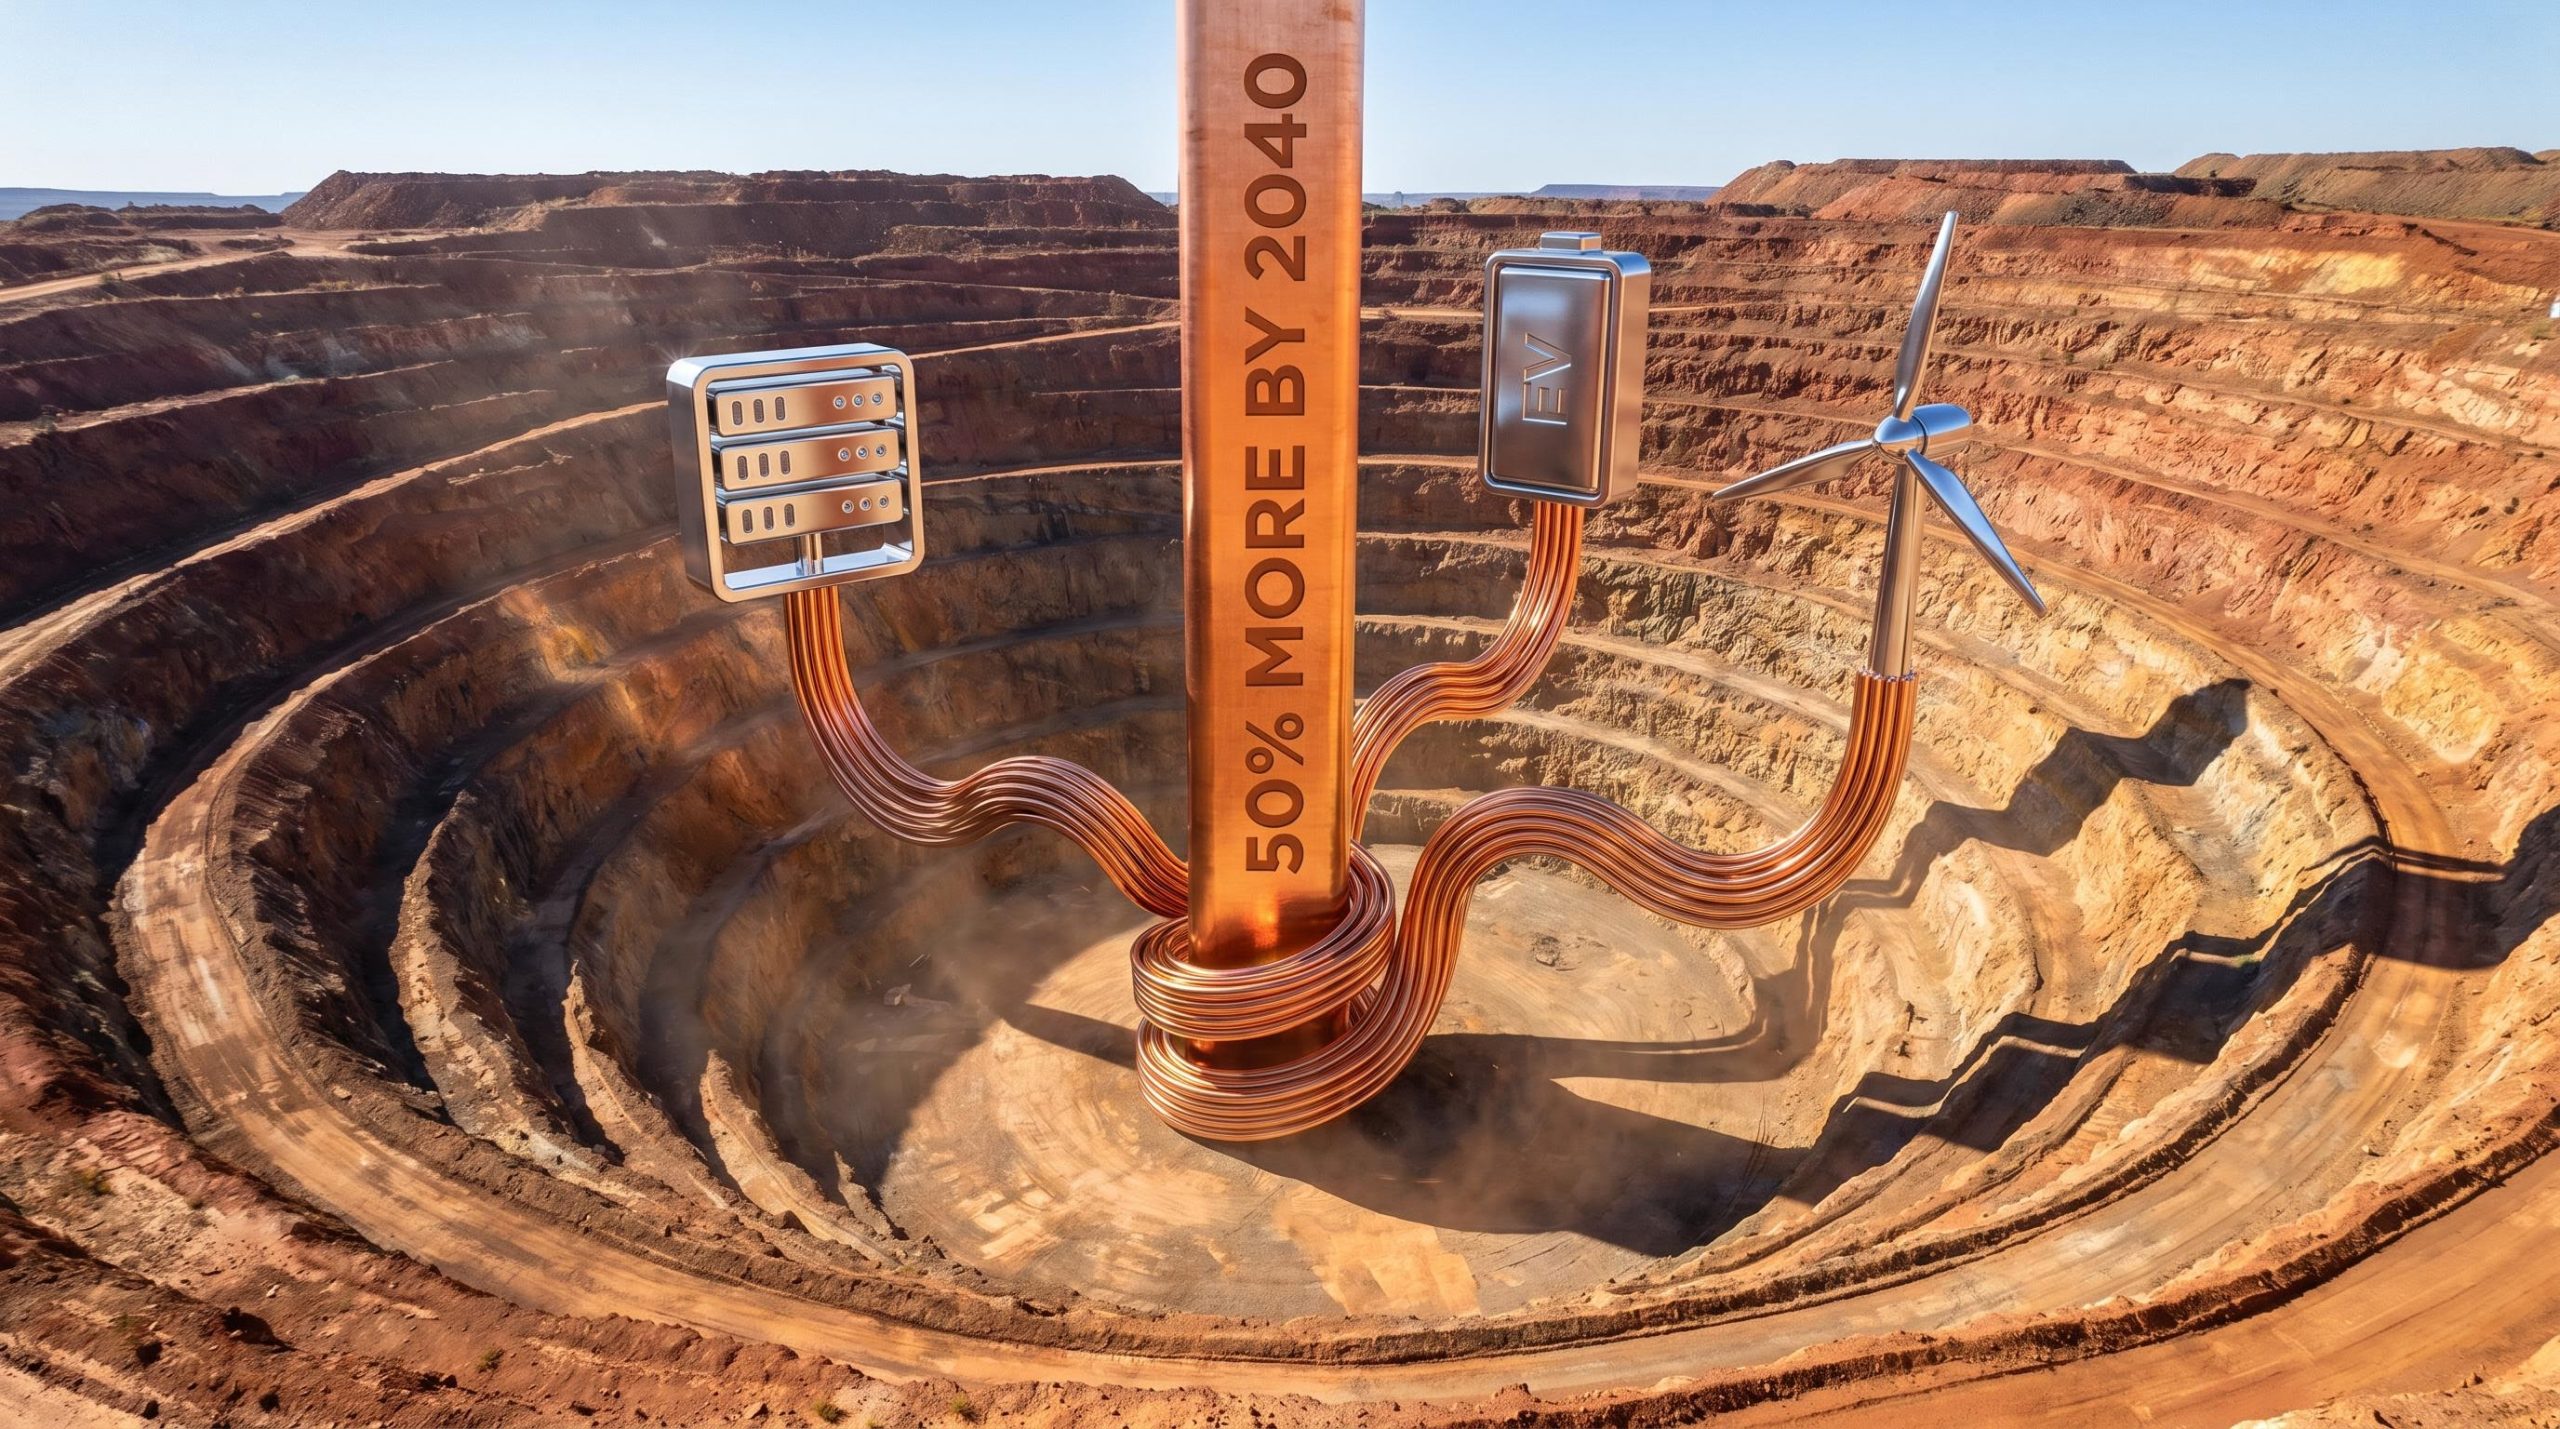
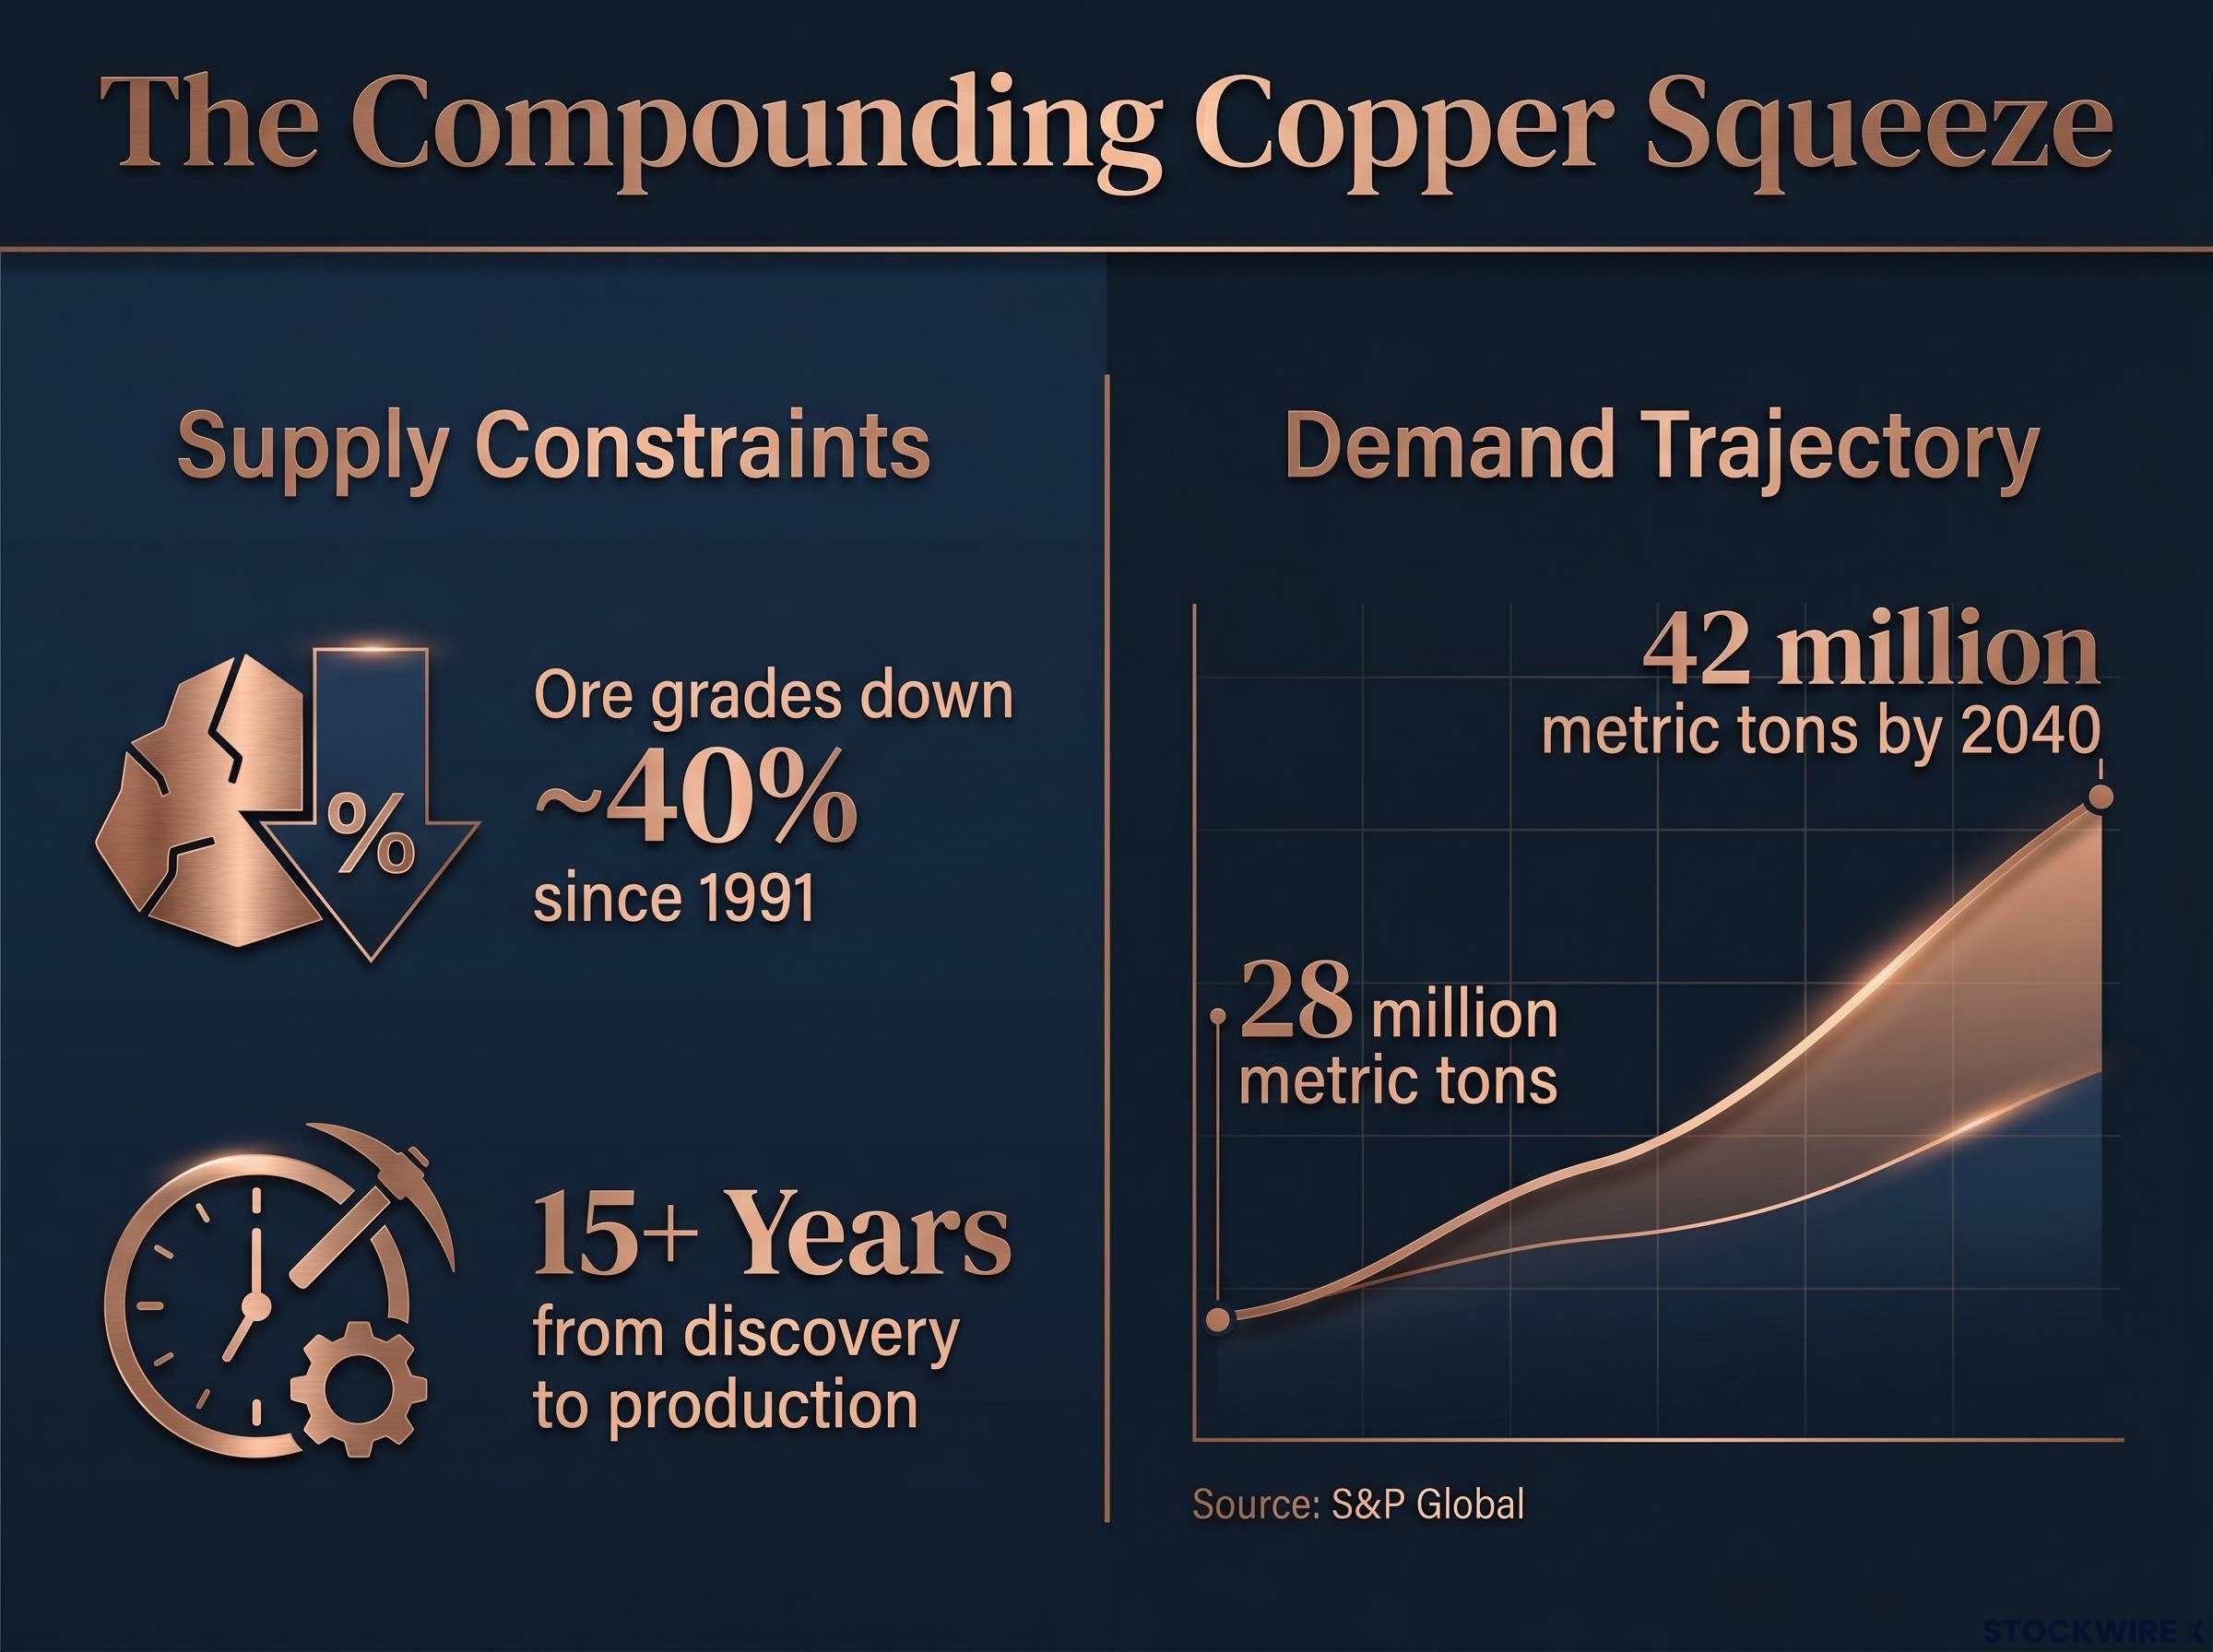
Copper is a 10,000-year-old material. It is also the single most important physical input for the two defining technology bets of the 2020s: artificial intelligence infrastructure and electrification. That combination would be unremarkable if supply were keeping pace, but it is not. Three historically independent demand streams, AI data centre construction, electric vehicle (EV) adoption, and grid-scale energy storage, are now drawing simultaneously on the same small set of metals. Copper ore grades have fallen roughly 40% since 1991. New greenfield projects take more than 15 years from discovery to production. Global copper demand is projected to rise approximately 50% by 2040, from around 28 million metric tons to around 42 million metric tons. What follows is a framework for understanding why copper and battery metals are being reclassified from cyclical commodity bets to infrastructure plays, and how to think about positioning across the value chain.
The shrinking supply pipeline that no commodity cycle has fixed
The supply problem facing copper markets is not a single variable waiting for higher prices to solve it. It is three compounding forces operating at once:
- Declining ore grades: Average copper grades have fallen approximately 40% since 1991, meaning substantially more rock must be processed per tonne of output. Costs rise even when headline capacity appears stable.
- Extended lead times: Greenfield mine development from discovery to production routinely exceeds 15 years, making supply-side corrections structurally slow relative to the pace of demand acceleration.
- Chronic underinvestment: Capital allocation toward new copper projects has remained subdued since the last supercycle, leaving the development pipeline at decade-low activity levels.
Each force alone would tighten the market. Together, they create a deficit that forward projections from major consultancies and banks consistently show persisting into the 2030s.
BHP has publicly stated its view that copper will face structural undersupply before the end of the decade, a position that has informed billions in targeted capital allocation toward copper assets.
Why acquisitions, not construction, signal the depth of the problem
If the supply gap were a conventional cycle, major miners would be building. Instead, BHP and Rio Tinto have pursued acquisitions of existing copper assets rather than committing to greenfield construction. The logic is straightforward: when the economics and timeline of new mine development are prohibitive at current market conditions, buying operational capacity is the faster path to supply. This is a market-structure signal. When the largest producers in the world choose to acquire rather than build, the message is that new capacity is not arriving on a normal cycle.
The BHP production commitment to 2 million tonnes of attributable copper output per annum by 2035, announced alongside LME copper clearing US$14,000 per tonne, underscores why the world’s largest diversified miner has concluded that acquisition of operating assets is the faster path to scale than waiting on greenfield timelines.
When big ASX news breaks, our subscribers know first
What copper has to do with AI, and why it is not a small footnote
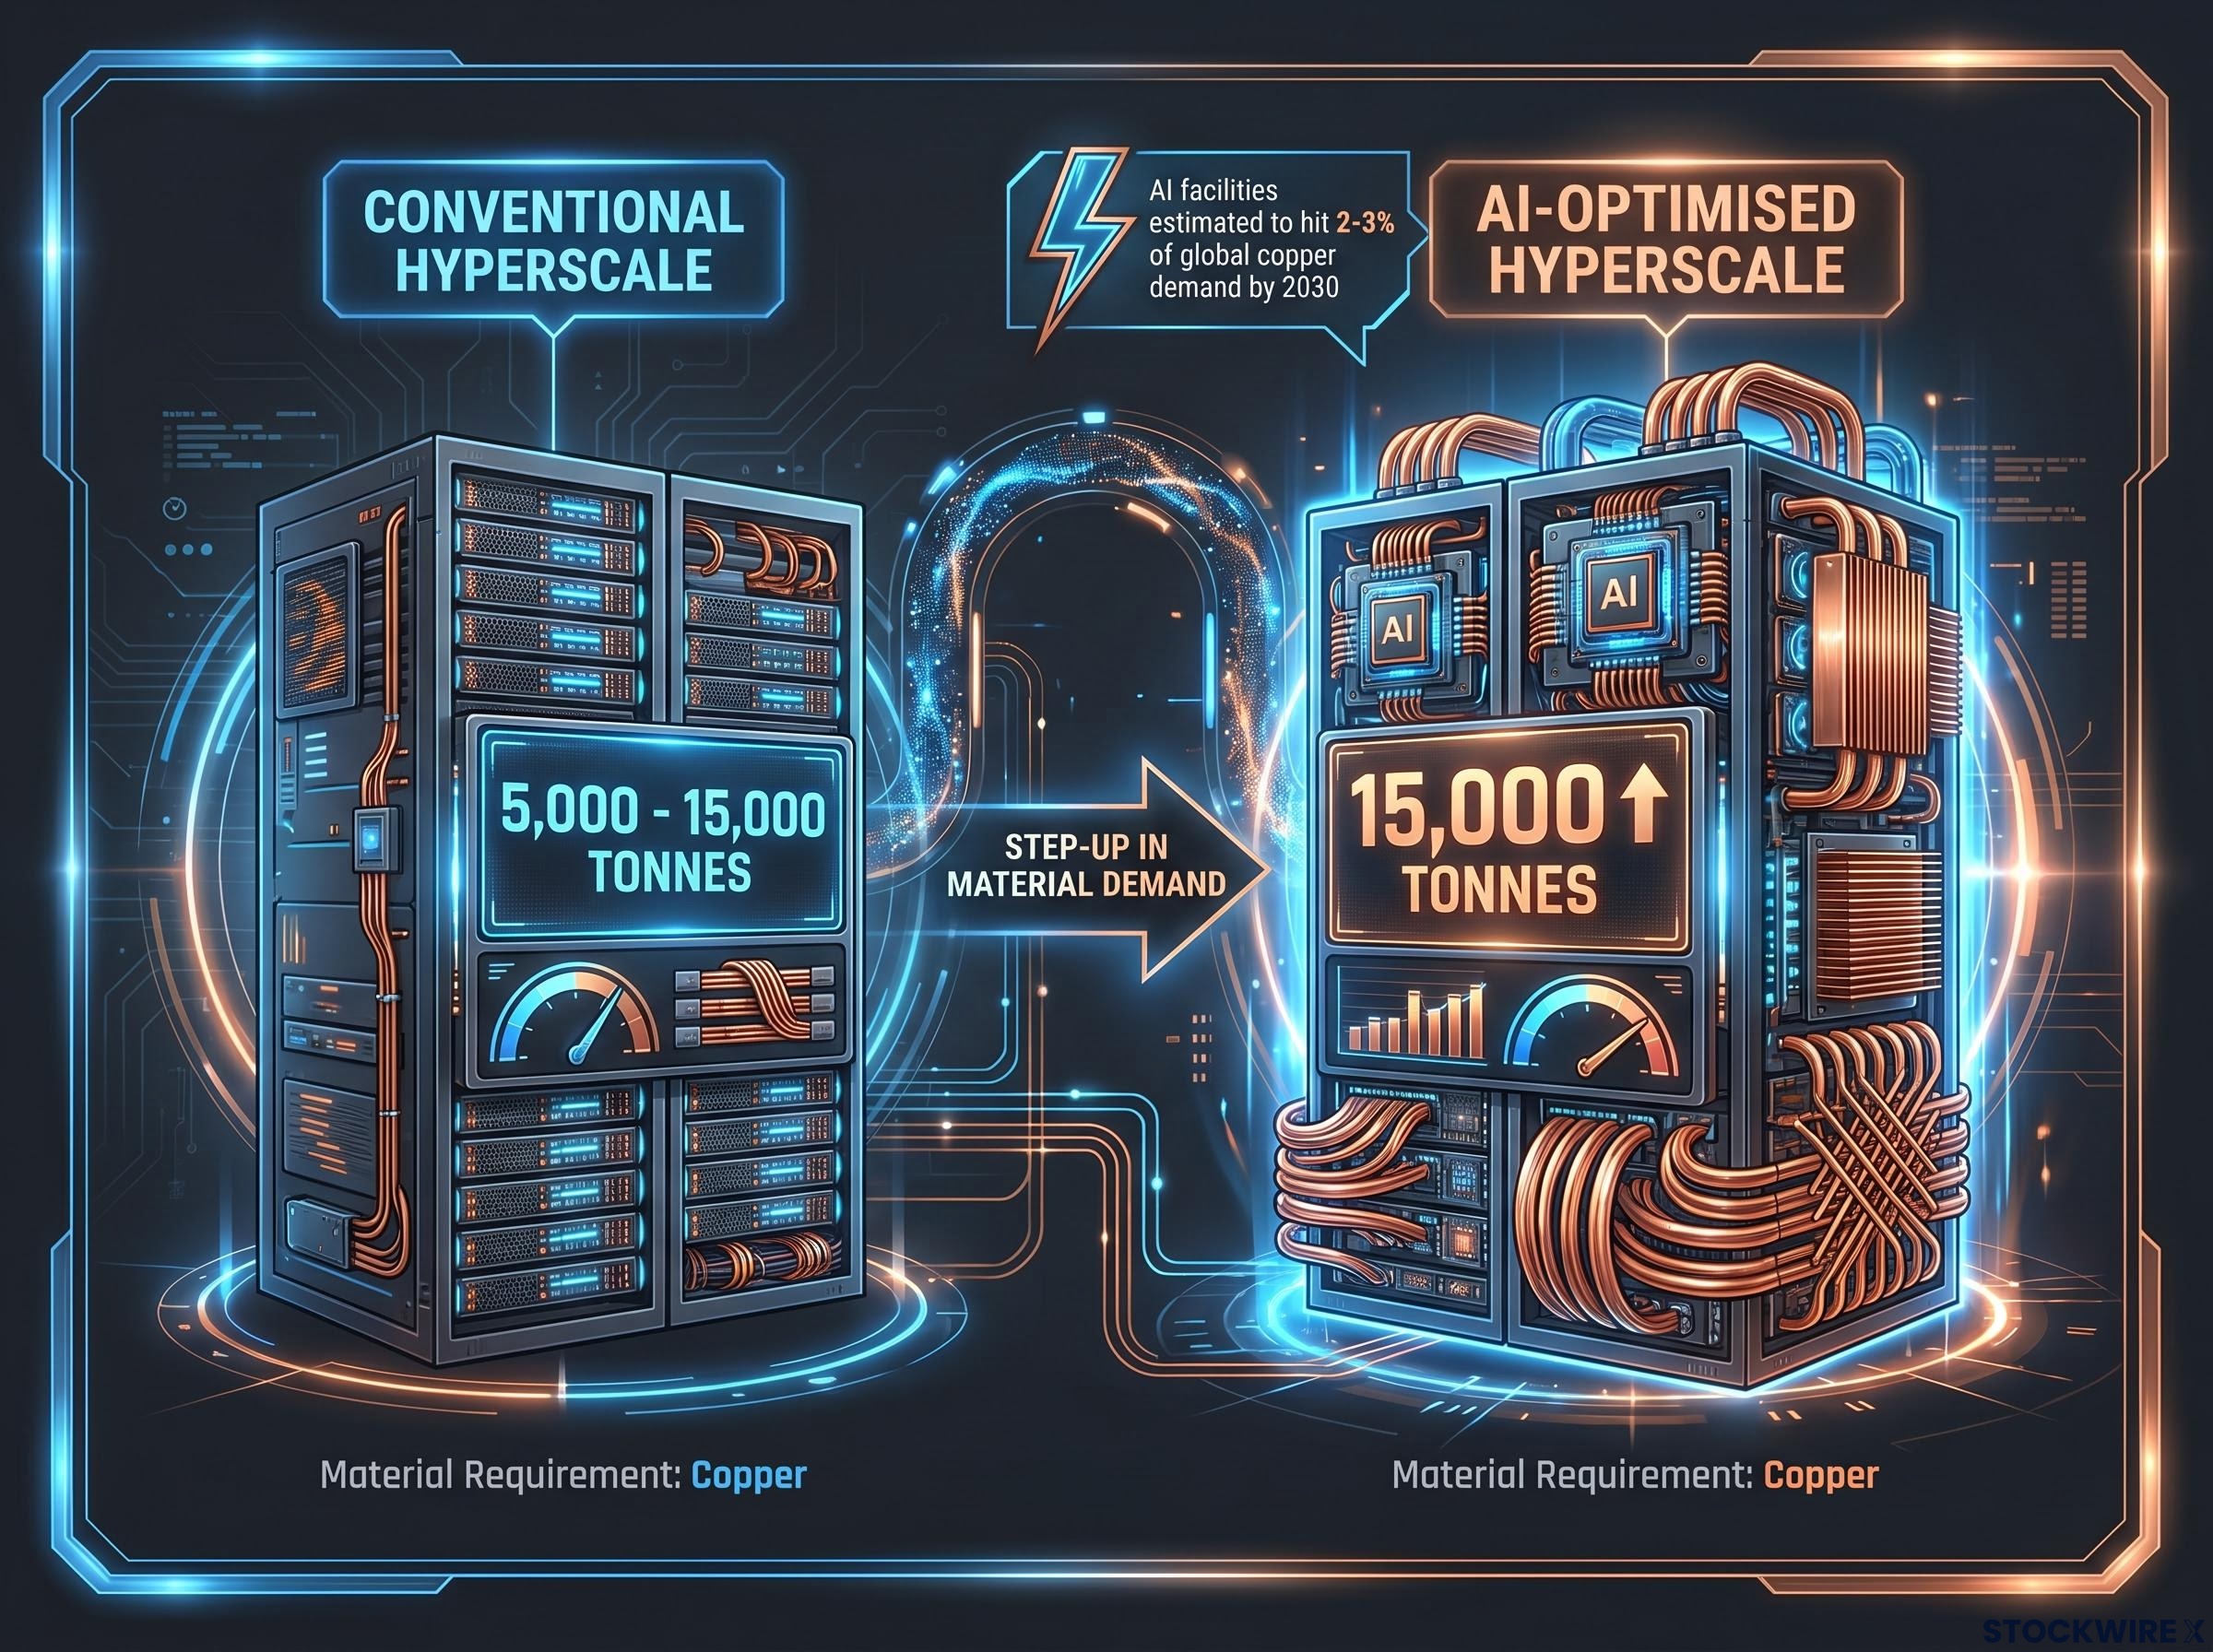
A single conventional hyperscale data centre requires 5,000-15,000 tonnes of copper in power cables, busbars, transformers, switchgear, and cooling systems. AI-optimised facilities, which carry substantially higher power densities and thermal loads, are expected to sit at or above the upper end of that range.
| Facility type | Copper per facility (tonnes) | Primary copper use cases | Demand cycle driver |
|---|---|---|---|
| Conventional hyperscale | 5,000-15,000 | Power distribution, cooling, switchgear | Cloud computing capex cycles |
| AI-optimised hyperscale | 15,000+ | High-density power ingestion, advanced thermal systems | Multi-year AI infrastructure commitments |
S&P Global projects global copper demand reaching approximately 42 million metric tons by 2040, with AI data centres contributing meaningfully to that trajectory. Directional estimates suggest AI-related facilities could account for 2-3% of global copper demand by 2030, though this figure remains unverified and should be treated as indicative.
The AI commodity supercycle is creating a parallel pricing anomaly that institutional analysts at Goldman Sachs, J.P. Morgan, and Bernstein have each flagged: resource equities are trading at roughly 14 times forward earnings against the NASDAQ 100 at approximately 25 times, a valuation gap that reflects the market’s continued habit of treating commodity exposure as a cyclical trade rather than an embedded infrastructure input.
Why AI demand is structurally different from industrial GDP demand
Once a hyperscale build is approved and underway, copper procurement is locked into a multi-year capex commitment cycle tied to technology investment plans. This demand does not contract when manufacturing PMI readings weaken or housing starts fall. It is structurally distinct from GDP-correlated industrial demand, and that distinction matters for how investors should model the forward copper balance.
Battery metals and why their demand base is unusually wide
Battery metals occupy a genuinely unusual position in the commodity investment universe. Three demand streams that are normally uncorrelated are all pulling on the same materials simultaneously:
- AI infrastructure: Data centres require battery storage systems at scale for both power buffering and grid independence.
- Clean energy transition: Wind and solar intermittency creates a structural floor under battery storage demand that is policy-reinforced and growing.
- Geopolitical energy security: Nations without significant domestic fossil fuel reserves face policy urgency to accelerate renewable alternatives, reinforcing storage deployment.
Approximately 95% of lithium produced globally is consumed by either EVs or battery energy storage systems, making lithium almost purely a function of the structural adoption curves for those two technologies.
U.S. battery energy storage system (BESS) additions reached 57 GWh in 2025, with annual deployments projected to continue growing through the late 2020s as renewables expansion and data centre power loads increase. Rising prices for lithium, copper, and aluminium are already feeding into higher BESS costs, embedding these metals in the economics of infrastructure that governments treat as non-discretionary.
The two jobs batteries do inside an AI data centre
AI data centres deploy batteries in two distinct configurations. Short-duration systems provide approximately 30 minutes of backup capacity to smooth demand spikes without stressing the grid. Large-scale on-site storage systems sustain 2-5 hours of full facility operation, paired with gas generators, hydrogen systems, or solar installations to create effectively self-contained energy precincts. Both configurations consume lithium and related materials, meaning data centre growth adds battery demand through two independent channels simultaneously.
How the EV recovery changes the floor under demand, not just the ceiling
Early EV adoption underperformed expectations for specific, identifiable reasons. Those reasons have materially weakened:
- Fuel price normalisation reduced the immediate financial incentive to switch from internal combustion engines after the 2022 oil price spike. That incentive has since reasserted as fuel price volatility is increasingly perceived as a permanent feature of transport costs.
- Range anxiety constrained appeal outside early-adopter segments. Battery technology from CATL and BYD now supports ranges of up to approximately 1,500 km (battery electric) and up to 2,000 km (plug-in hybrid) in Chinese market applications.
- Infrastructure gaps limited mainstream adoption. Charging network density has expanded substantially, though residual gaps persist in some markets.
The cost argument has migrated from environmental conviction to financial self-interest. A 10-year total cost of ownership analysis, including purchase price, home charging infrastructure, and running costs, suggests EV drivers could be approximately $10,000 better off than equivalent petrol vehicle owners.
The second-hand market as a structural demand floor, not a growth story
The developing second-hand EV market broadens access to lower-income buyers as early adopters sell used vehicles at lower prices. This dynamic raises the overall utilisation rate of installed battery capacity across the vehicle fleet lifecycle. The result is a structural floor under lithium and battery materials demand that operates independently of new vehicle sales cycles.
Understanding the structural supply risk that most models do not price
Two specific scenarios illustrate the asymmetric tail risk sitting beneath the structural thesis.
The African copper belt, encompassing the DRC and Zambia, accounts for approximately 20% of global mined copper supply (DRC at approximately 3.5 million metric tons annually, Zambia at approximately 0.89 million metric tons). Copper extraction in this region depends heavily on sulfuric acid sourced from Middle Eastern exporters. Sulfuric acid inventories at these mine sites typically last approximately three to four months. A prolonged Strait of Hormuz disruption could restrict acid exports and threaten extraction across the region.
Separately, approximately 50% of the world’s visible copper inventory is currently held in the United States, compared with a historical norm of less than 5%. This shift was driven by Section 232 tariff frontloading, and the accumulated inventory has found sufficient domestic end-uses to reduce re-export incentives, durably tightening ex-U.S. availability.
The White House Section 232 copper import proclamation formalised the finding that copper imports threaten U.S. national security, providing the legal basis for tariffs that drove the inventory frontloading now concentrated domestically and tightening ex-U.S. availability.
In a structurally tight market, a 2-3% supply shortfall can translate into a 20-30% price spike due to inelastic marginal supply once surplus capacity is exhausted.
| Risk scenario | Supply region affected | Estimated impact scope | Buffer timeline | Current market pricing |
|---|---|---|---|---|
| Strait of Hormuz disruption | African copper belt (DRC, Zambia) | ~20% of global mined supply | 3-4 months acid inventory | Limited; low baseline probability |
| Section 232 tariff inventory redistribution | Ex-U.S. global markets | ~50% of visible inventory concentrated in U.S. | Ongoing; likely durable | Partially priced; redistribution underappreciated |
Positioning across the value chain without concentrating the wrong risk
The structural thesis produces different return profiles depending on where in the value chain an investor holds exposure. Upstream miners (copper producers, lithium miners, graphite producers) benefit when commodity prices are high. Downstream manufacturers (EV original equipment manufacturers, battery cell makers) benefit when input prices fall and end-market volumes grow.
| Segment | Example instruments | Performs when | Risk factors | Time horizon fit |
|---|---|---|---|---|
| Upstream miners | Copper/lithium producers, Global X Copper Miners ETF (WIRE) | Commodity prices high; supply constrained | Operational disruptions, grade decline | Multi-year to decade |
| Downstream manufacturers | Battery cell makers, EV OEMs | Input costs fall; end-market volumes grow | Demand cycle timing, margin compression | Medium-term (3-5 years) |
This barbell dynamic creates natural internal hedging. When lithium prices were depressed in 2023, downstream manufacturers benefited from lower input costs, partially offsetting weakness in the mining segment. Neither position alone captures the full structural story.
Why ETF-level copper exposure can be structurally superior to single-stock concentration
Copper miners held within an ETF benefit from a counterintuitive dynamic. A supply disruption at one miner raises copper prices, benefiting the remaining holdings and potentially lifting overall fund value even as the affected stock falls. Idiosyncratic operational risk is partially transformed at the portfolio level into positive beta to scarcity. The Global X Copper Miners ETF (WIRE) has grown to approximately $900 million in assets under management, reflecting institutional recognition of this structural property.
The time horizon is explicitly multi-year to decade-long, with the near-term tariff inventory dynamic providing a potential 12-24 month catalyst window within the longer structural arc. Mine lead times exceeding 15 years mean supply-side corrections arrive slowly relative to demand acceleration.
How markets are pricing copper’s transition from GDP barometer to constrained strategic input
Investors are beginning to treat copper and battery metals as embedded in multi-decade capex programmes underwritten by sovereign policy and technology deployment curves, rather than as GDP-cycle trades. The U.S. Inflation Reduction Act, the EU Critical Raw Materials Act, and equivalent Asian policy frameworks reinforce domestic supply incentives while also raising project economics complexity.
The shift in how markets value copper, from a barometric GDP indicator to a strategically constrained infrastructure input, is underway but not yet fully reflected in either the commodity or the equities.
Institutional commodities allocation frameworks are shifting at speed: Societe Generale lifted its commodities weighting from 5% to 20% of a model portfolio in a single step on 18 June 2026, a move the bank anchored in quantitative portfolio construction logic showing commodities and gold improve long-run efficiency in higher macro-volatility regimes.
Material risks remain known and quantifiable:
- Aluminium substitution for copper in certain power transmission and wiring applications, though the scale of demand growth across AI, electrification, and storage means significant substitution still leaves substantial unmet requirements.
- Lithium iron phosphate (LFP) chemistry reduces cobalt and nickel requirements in battery production.
- Sodium-ion batteries could reduce lithium intensity at the lower end of the energy density spectrum.
These substitution pathways represent credible caps on upside scenarios rather than fatal objections to the structural thesis. The gap between when supply constraints become acute and when markets fully price in the reclassification is wide. That gap is where the investor decision lives.
Why the next decade may be the wrong frame for this thesis
Three converging structural forces, AI infrastructure, clean energy transition, and geopolitical energy security, are simultaneously drawing on the same physical materials. All three are policy-reinforced and technology-driven, a combination that is unusual in commodity history. Copper’s role as a barometric GDP indicator is giving way to its role as an infrastructure input, and that transition is not yet fully priced.
The thesis requires sustained policy support, continued AI capex, and no sudden mine supply surge to remain intact. A decade-long structural view demands regular reassessment as those conditions evolve. What does not change easily is the physics: copper conducts electricity better than almost any alternative at scale, lithium remains the energy-dense backbone of modern battery chemistry, and mine lead times measured in decades mean the supply response will lag the demand signal for years to come.
This article is for informational purposes only and should not be considered financial advice. Investors should conduct their own research and consult with financial professionals before making investment decisions. Past performance does not guarantee future results. Financial projections are subject to market conditions and various risk factors.