Why the S&P 500 Earnings Surge Is Narrower Than It Looks
2 hrs ago
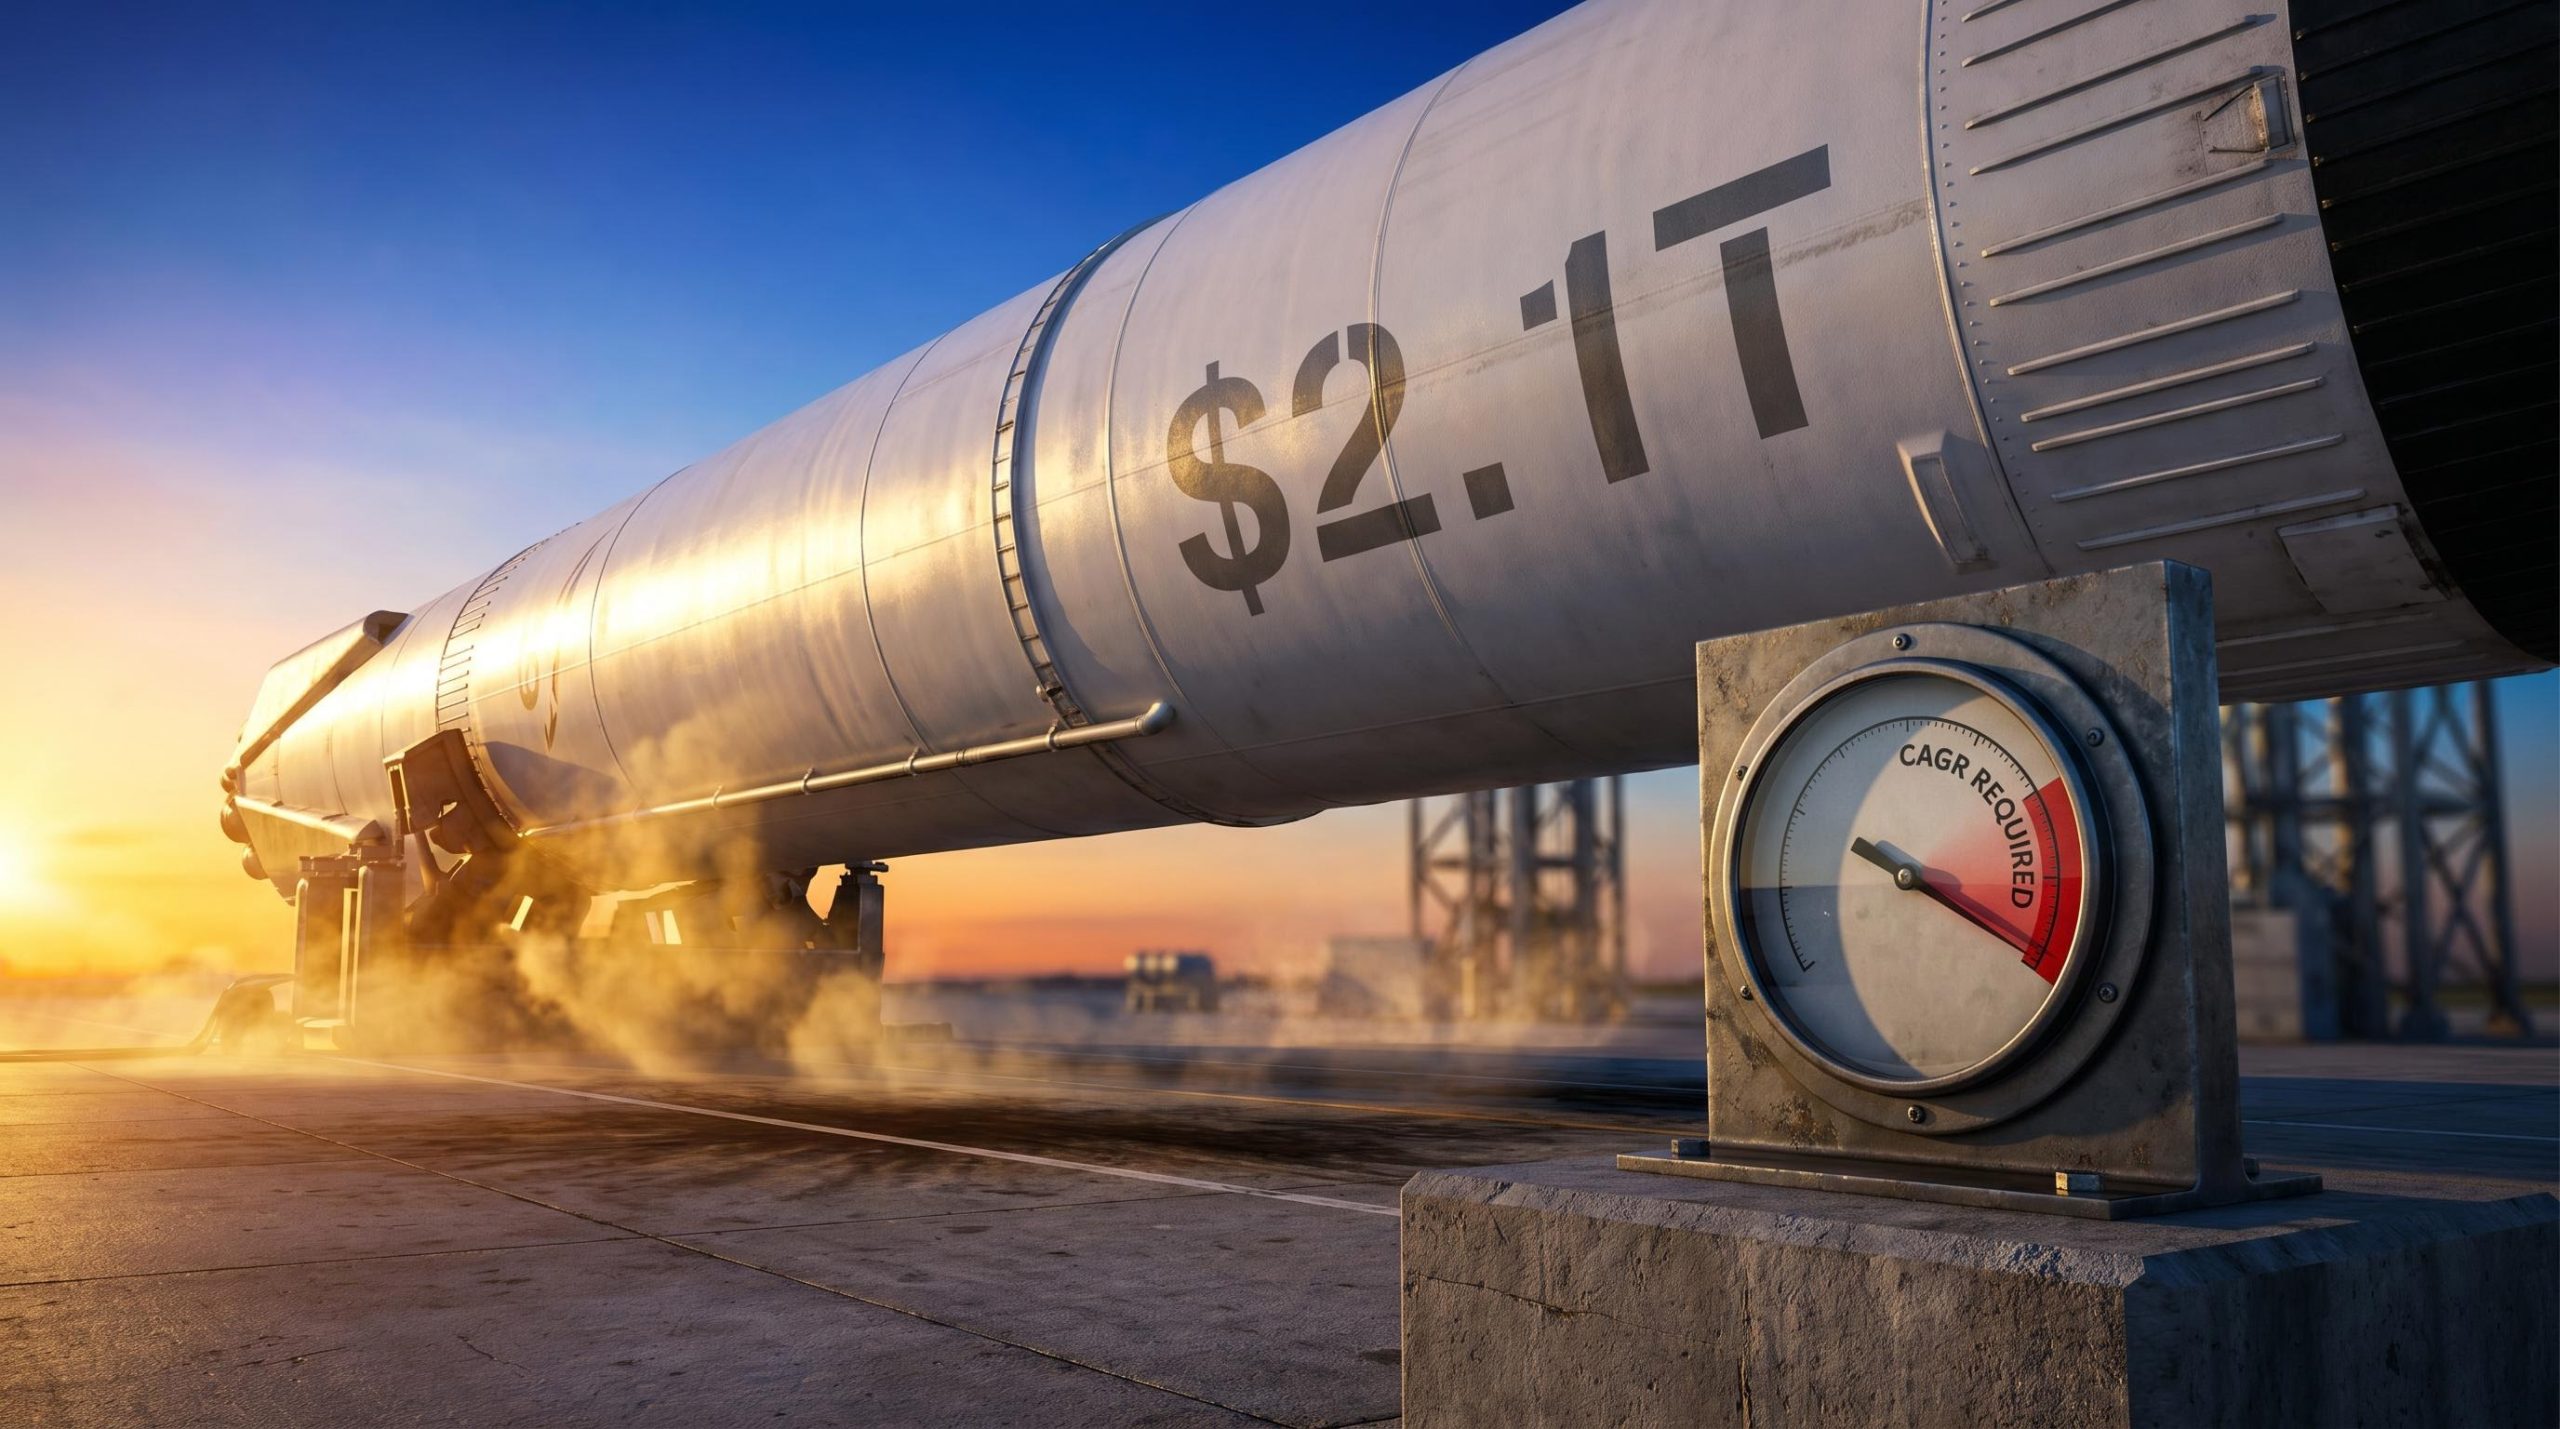
SpaceX closed its first trading day as a public company at $160.95 per share on 12 June 2026, implying a market capitalisation of approximately $2.1 trillion. Within days, Elon Musk publicly projected revenues exceeding $1 trillion by 2030 or 2031. Those two data points, placed side by side, define the question every investor must answer before acting: does the current price represent opportunity, or does it already price in a level of success that has no precedent in corporate history?
This analysis works through the compound growth mathematics required to reach Musk’s revenue targets, compares the implied rates against the strongest sustained growth episodes ever recorded by mega-cap companies, and reverse-engineers what the $2.1 trillion valuation already demands from the business. The result is a numbers-driven framework, not a narrative judgement, for assessing the risk embedded in SpaceX’s opening price.
SpaceX generated $18.7 billion in revenue during 2025, spread across three segments:
Starlink dominates the revenue mix, accounting for more than 60% of the total. Launch and AI split the remainder roughly evenly. Year-over-year growth from 2024 to 2025 came in at approximately 33%, based on Reuters’ reporting of 2024 revenue at roughly $14 billion. (Some private-market analyses place 2024 revenue slightly lower at approximately $13.1 billion, which would push the growth rate closer to 40-45%; the discrepancy does not change the conclusions that follow.)
That 33% growth rate is strong. It is also the starting point from which every projection in this analysis must compound.
Revenue alone does not tell the full story. Capital intensity in rocket manufacturing, satellite constellation refresh, and launch infrastructure means the path from revenue growth to equity value creation is not linear.
Despite $18.7 billion in 2025 revenue, SpaceX posted a net loss of approximately $4.9 billion.
A $4.9 billion net loss against nearly $19 billion in revenue is a structural data point, not a growing-pains footnote. Investors anchoring only to the $1 trillion destination without absorbing where the company stands today risk misjudging the distance and probability of the journey entirely.
SpaceX’s Q1 2026 loss profile, approximately $4.28 billion on $4.69 billion in quarterly revenue, confirms that the full-year 2025 net loss is not an anomaly but a structural feature of a business where AI infrastructure and orbital compute remain cash-flow negative while Starlink carries the profitability burden.
A compound annual growth rate (CAGR) measures the average rate at which a value must grow each year over a set period to move from one figure to another. It is the single most useful tool for stress-testing a revenue projection against reality.
Starting from $18.7 billion in 2025 and reaching $1 trillion in 2030 requires five years of compounding. The formula is straightforward:
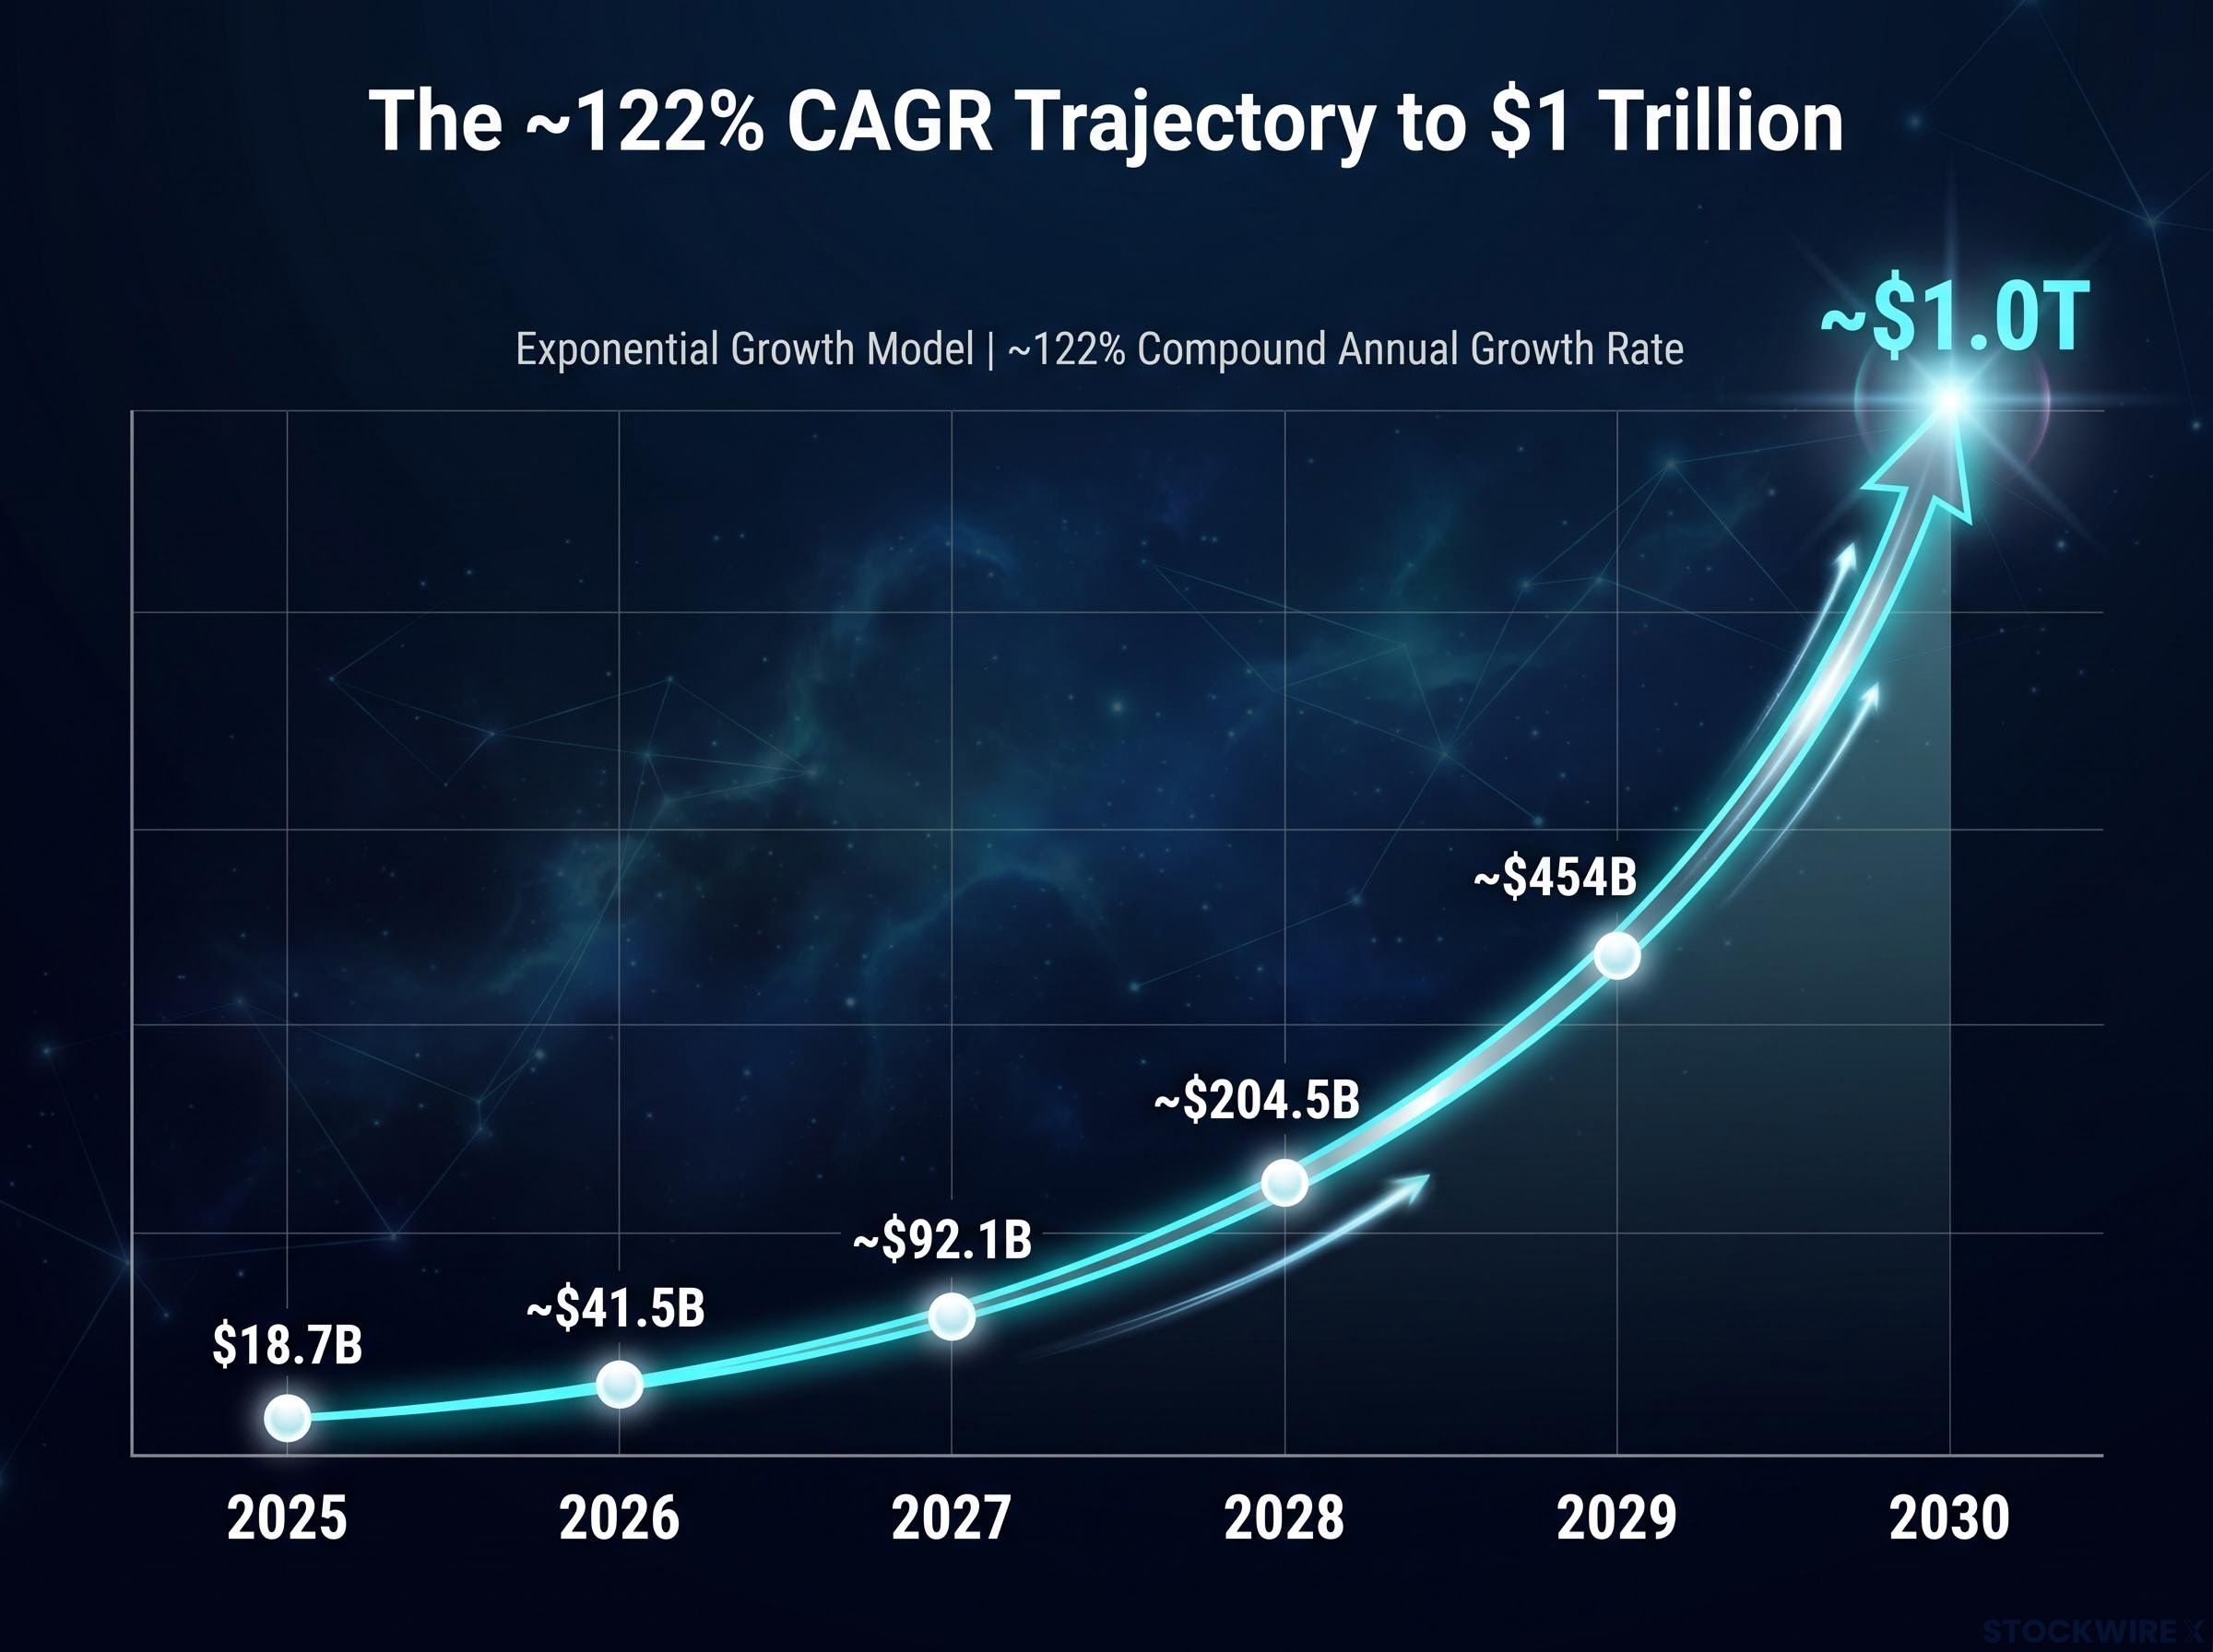
CAGR = (1,000 / 18.7)^(1/5) – 1 ≈ 122%
At 122% annual growth, the year-by-year trajectory looks as follows:
| Year | Revenue |
|---|---|
| 2025 | $18.7B |
| 2026 | ~$41.5B |
| 2027 | ~$92.1B |
| 2028 | ~$204.5B |
| 2029 | ~$454B |
| 2030 | ~$1.0T |
By 2028, three years from now, the trajectory demands roughly $205 billion in annual revenue. By 2029, it requires $454 billion, a figure larger than Amazon’s total 2024 revenue.
Adding one extra year, targeting $1 trillion by 2031 instead of 2030, does not reduce the burden as much as intuition suggests.
The 2031 target still requires approximately 94% annual revenue growth, not 70%.
The corrected six-year calculation produces a CAGR of approximately 94%. A 70% CAGR from the $18.7 billion base would take roughly 9 years, reaching $1 trillion around 2034. The distinction between 94% and 70% is not cosmetic; it determines whether an extended timeline reads as moderately ambitious or categorically unprecedented.
Historical precedent provides the calibration anchor. Apple and Amazon are the appropriate benchmarks: both achieved their peak sustained revenue CAGRs while operating at tens to hundreds of billions in revenue, making them the closest available comparisons for a company scaling from SpaceX’s current base.
The SpaceX scenarios, at 94-122% CAGR, require growth approximately four times faster than the highest sustained rate any mega-cap has previously achieved. The base revenue scale makes the comparison even less favourable: sustaining triple-digit growth gets harder, not easier, as absolute revenue climbs.
The implied growth rate applied to mega-caps produces counterintuitive verdicts: Tesla’s current price implies approximately 29% annual revenue growth against a trailing rate of roughly 2%, while Nvidia’s implied 20% requirement is currently exceeded by 73% trailing growth but would require achieving historically unprecedented revenue scale from a $200 billion-plus base.
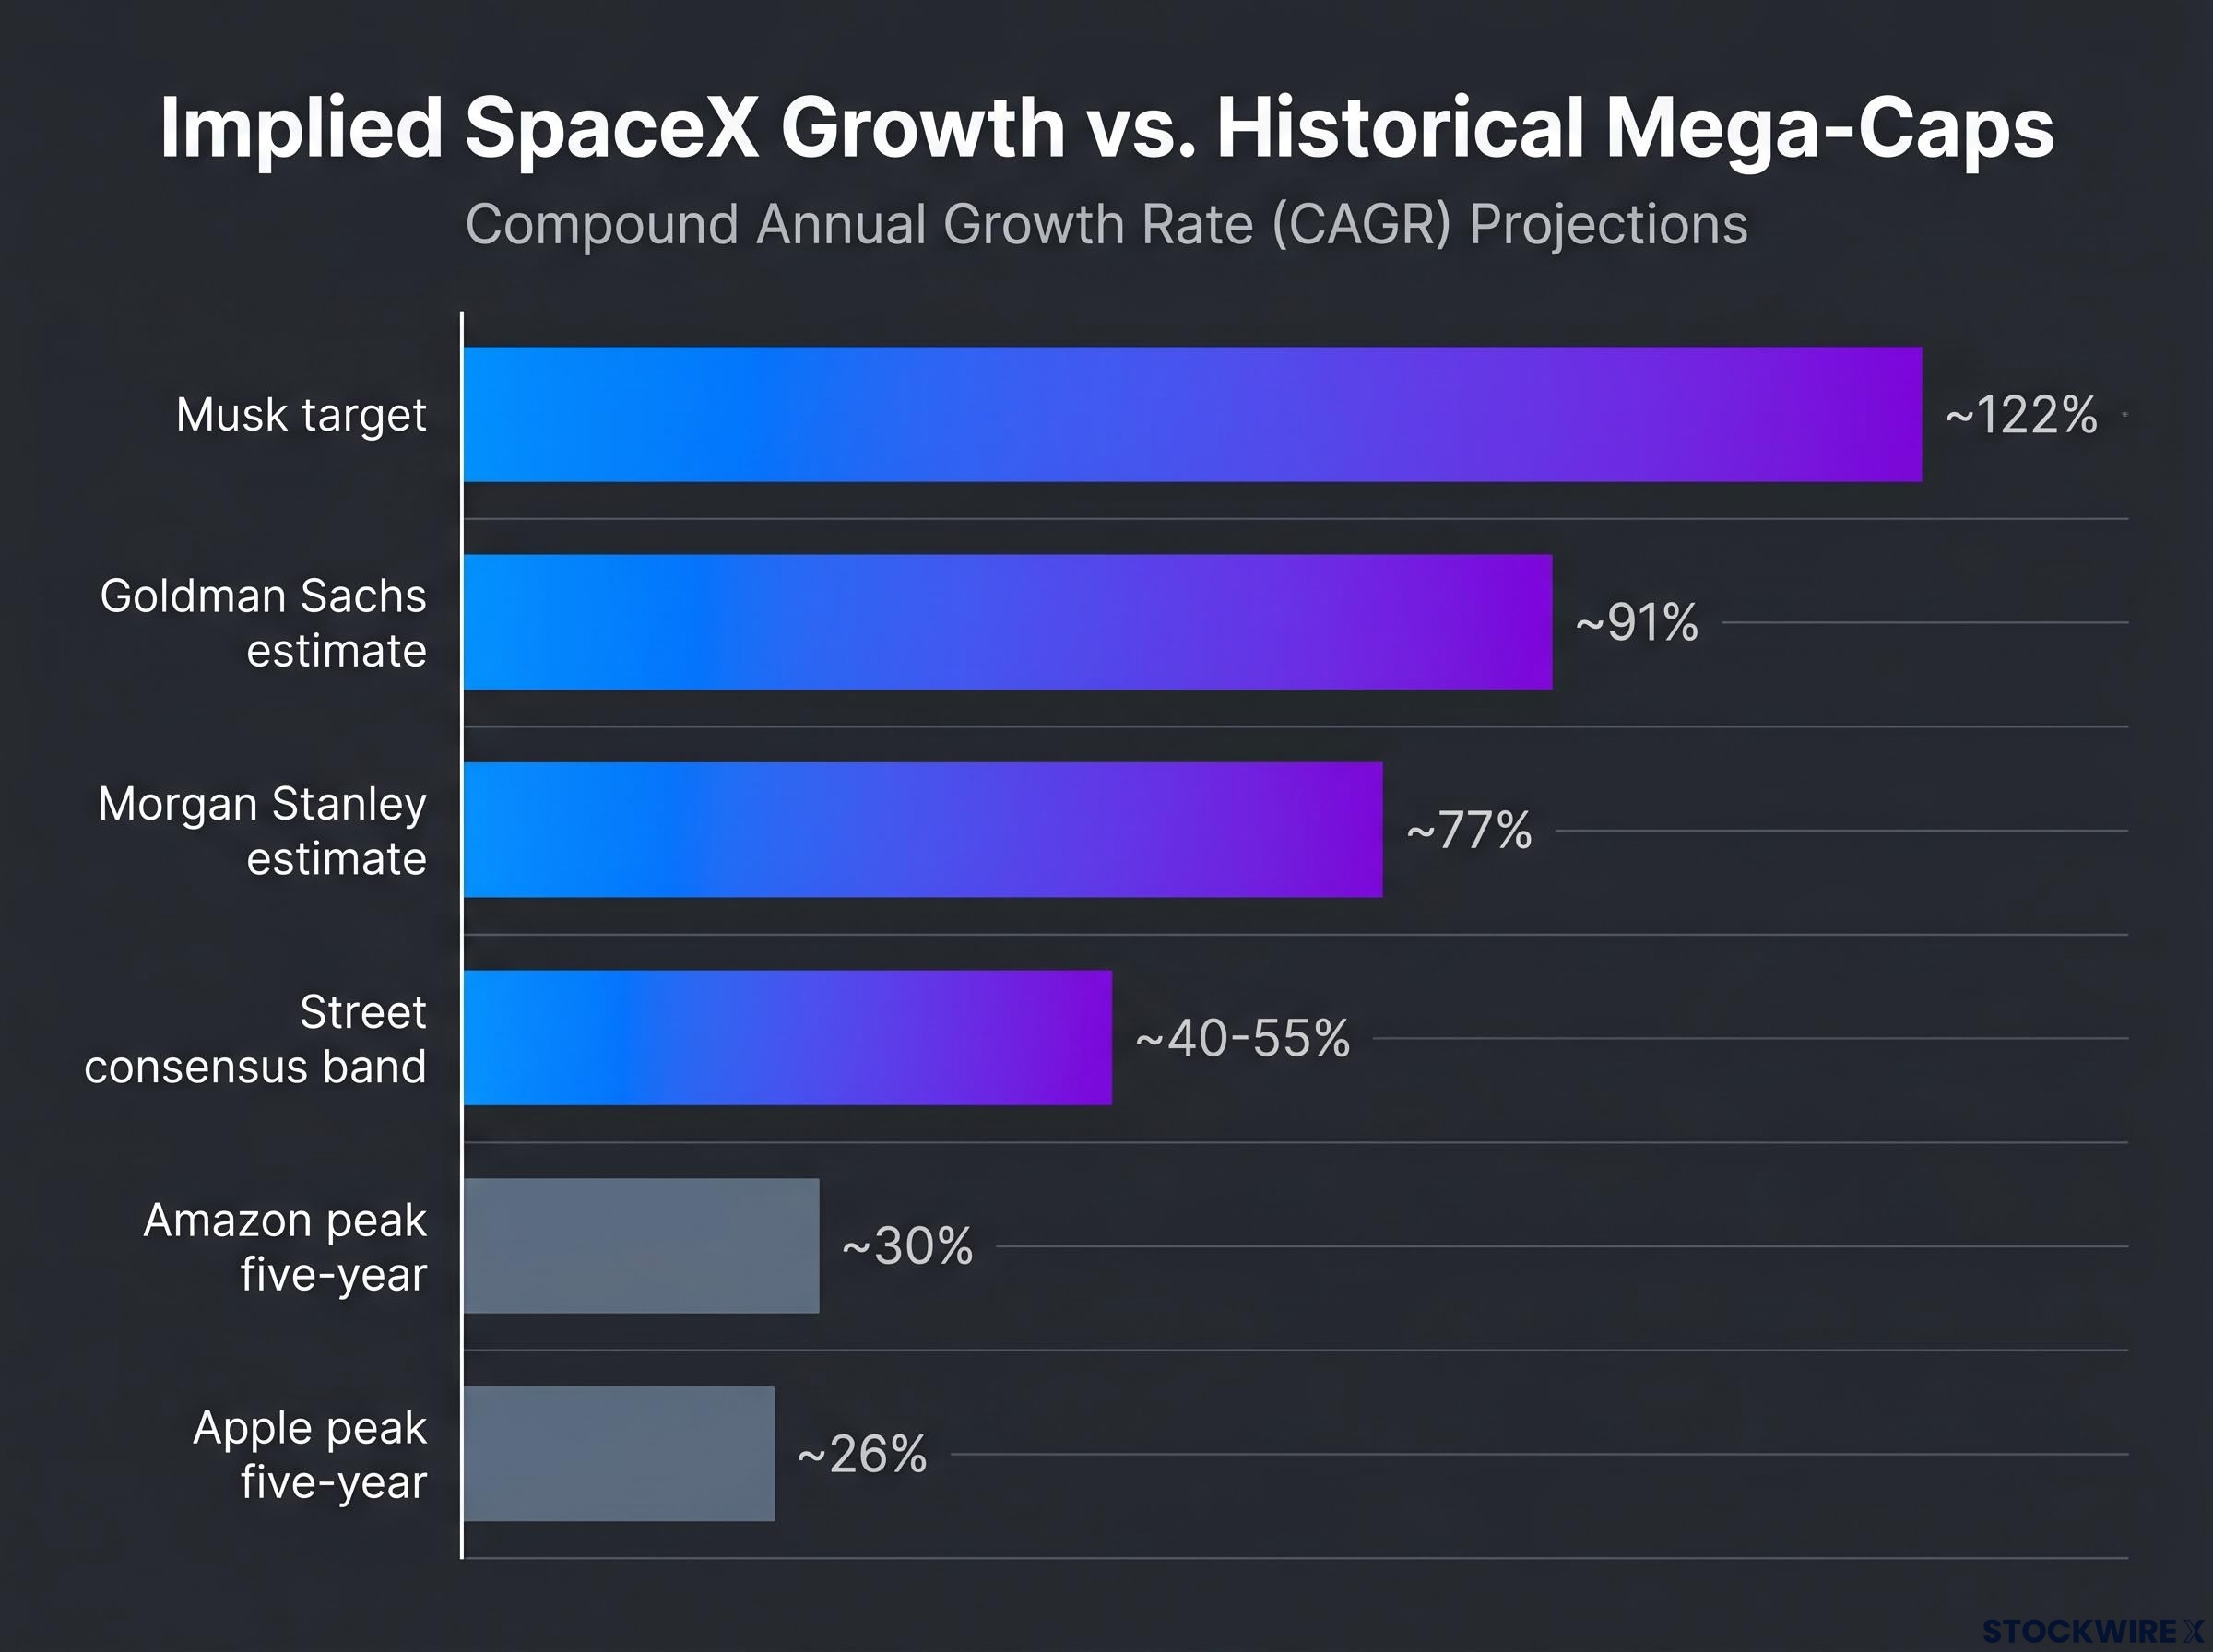
Even Wall Street’s most optimistic public forecasts sit far below Musk’s target. According to Reuters, Goldman Sachs has modelled SpaceX revenue exceeding $470 billion by 2030, while Morgan Stanley projects nearer $330 billion.
| Source | 2030 Revenue Estimate | Implied 5-Year CAGR from $18.7B |
|---|---|---|
| Elon Musk | $1,000B | ~122% |
| Goldman Sachs | ~$470B | ~91% (derived) |
| Morgan Stanley | ~$330B | ~77% (derived) |
| Street consensus band | $300-500B | ~40-55% |
Note: the Goldman Sachs and Morgan Stanley implied CAGR percentages are analytical derivations from reported revenue targets, not figures directly stated by those institutions. The Street consensus band of $300-500 billion implies roughly 40-55% CAGR, still historically staggering but approximately half of what the Musk scenario demands.
The most useful way to read a valuation is backward. Rather than asking what SpaceX could be worth, the question is: what minimum performance does the current $2.1 trillion price already require?
The implied growth rate framework converts any share price into a forward revenue demand using five inputs: current market cap, trailing revenue, target return, holding period, and exit price-to-sales multiple, producing the single number that standard brokerage platforms never display and that the reverse-engineering in this analysis approximates.
Working backward from plausible terminal revenue multiples to the minimum revenue SpaceX must generate to justify the current price produces the following:
| Terminal Multiple | Implied Terminal Revenue | Required 10-Year CAGR from $18.7B | Comparable Benchmark |
|---|---|---|---|
| 8x revenue | ~$260B | ~30% | Amazon’s peak multi-year rate, but sustained for a full decade |
| 5x revenue | ~$420B | ~36% | Above Apple and Amazon’s best five-year stretches, sustained for twice the duration |
Even the more generous 8x multiple scenario demands ~30% annual revenue growth sustained for an entire decade. Amazon’s peak five-year CAGR was approximately 30%, but sustaining that rate for ten consecutive years from a $20 billion base has no precedent.
These are not aggressive upside scenarios. They are the minimum performance thresholds already baked into the opening valuation. An investor purchasing at $160.95 is not buying optionality on an optimistic outcome; the price already demands historically extraordinary execution as its base case.
One additional nuance: with a small free float relative to total market capitalisation, near-term price action reflects market mechanics (index flows, supply-demand imbalances) as much as fundamental conviction. The current price is a noisy intrinsic value signal, which makes the reverse-engineered minimums even more important as an analytical anchor.
A structured scenario set converts an open-ended growth narrative into a set of testable propositions:
| Scenario | Implied Revenue | CAGR Required | Key Assumption Required |
|---|---|---|---|
| Musk by 2030 | $1T | ~122% | All segments compound at unprecedented rates simultaneously |
| Musk by 2031 | $1T | ~94% | One extra year materially eases path (it does not) |
| 70% CAGR | ~$1T by ~2034 | ~70% | High-double-digit growth sustained for 9 years |
| Street consensus | $350-500B by 2030 | ~40-55% | Substantial but not total market capture |
| Conservative | Mega-cap comparable | 20-30% | Physical constraints impose growth ceilings |
The Street consensus band, the middle case, still implies growth that would rank among the most extraordinary sustained revenue expansions in corporate history. This is not a story of aggressive versus moderate growth. It is a story of extreme versus extraordinary.
Revenue projections are only half the analytical equation. The $4.9 billion net loss in 2025 signals that capital intensity in this business is a structural feature, not a temporary growth-phase drag.
The specific capital demands that do not disappear with higher revenue include:
Extraordinary revenue growth does not guarantee equity value creation when capex, launch costs, and constellation refresh cycles remain structurally heavy.
Revenue growth and equity value creation decouple when capital expenditure requirements scale alongside revenues. Investors must model margin expansion assumptions explicitly rather than assuming high revenue automatically translates into high equity value. The aerospace and satellite sector has physical constraints (launch cadence, manufacturing throughput, orbital slot availability) that do not apply to software businesses, making historical software-company CAGR comparisons even less applicable as SpaceX scales.
Without a credible path from high revenue to meaningful free cash flow, the $2.1 trillion equity value has no mechanism to be realised by shareholders.
Three analytical layers converge on a single conclusion. The CAGR requirements show that the $1 trillion-by-2030 scenario requires 122% annual growth; the $1 trillion-by-2031 scenario requires 94%, not 70%. The historical benchmarks show that both rates sit approximately four times above the strongest sustained growth any mega-cap has achieved. The valuation reverse-engineering shows that even under generous terminal multiples, the current $2.1 trillion price demands 30-36% CAGR sustained for a decade, a rate with no ten-year precedent from a $20 billion base.
None of this proves SpaceX will fail to grow. The point is more precise: “probably grows a lot” is already in the price. The question is whether “grows at a historically unprecedented rate for a decade” is also in the price.
The orienting question for any investor considering a position at current levels:
What probability do you assign to sustained 30%+ annual revenue growth for ten consecutive years from a $20 billion base, and is that probability already reflected in what you would pay at $160.95 per share?
The answer to that question, supported by the mathematics rather than by narrative conviction, determines whether SpaceX at $2.1 trillion represents opportunity or priced-in perfection.
For investors new to evaluating first-day public market prices, our full explainer on IPO structural mechanics covers how retail investors typically enter after institutional allocation, why the expectations gap means strong business performance can still produce negative public-market returns, and what Professor Jay Ritter’s longitudinal dataset reveals about IPO cohort underperformance over five-year horizons.
This article is for informational purposes only and should not be considered financial advice. Investors should conduct their own research and consult with financial professionals before making investment decisions. Past performance does not guarantee future results. Financial projections are subject to market conditions and various risk factors.
CAGR, or compound annual growth rate, measures the average annual rate at which a value must grow to move from one figure to another over a set period. For SpaceX valuation analysis, it is the critical tool for stress-testing whether Elon Musk's $1 trillion revenue target by 2030 is mathematically plausible from the $18.7 billion 2025 baseline.
Starting from $18.7 billion in 2025 revenue, SpaceX would need to compound at approximately 122% per year for five consecutive years to reach $1 trillion by 2030. That rate is roughly four times higher than the strongest sustained revenue growth ever recorded by a mega-cap company such as Apple or Amazon.
Goldman Sachs has modelled SpaceX revenue exceeding $470 billion by 2030, while Morgan Stanley projects closer to $330 billion. Both figures fall substantially short of Elon Musk's $1 trillion target and still imply historically extraordinary annual growth rates of approximately 77-91% CAGR from the 2025 base.
Reverse-engineering the $2.1 trillion market capitalisation using plausible terminal revenue multiples shows that the current price already demands approximately 30-36% annual revenue growth sustained for a full decade, even under generous assumptions. This means historically extraordinary execution is the base case, not the upside scenario, at the opening price.
Apple's strongest five-year revenue CAGR over the past two decades was approximately 26%, and Amazon's peak five-year rate was approximately 30%. The SpaceX scenarios of 94-122% annual growth require a rate approximately four times higher, and the comparison becomes even less favourable as SpaceX's absolute revenue base grows larger with each passing year.


