What a $10,000 CBA Investment Is Actually Worth After 5 Years
33 mins ago

KB Securities analyst Euntaek Lee has drawn a line between today’s AI-driven equity market and 1999, but not the line most investors expect. In a note published this month, Lee argued that the current concentration of returns in AI-linked stocks mirrors the terminal phase of the dot-com bubble, a phase that, historically, preceded further upside rather than an immediate collapse. The parallel challenges one of the most commonly cited warning signs in equity markets: narrowing breadth. As AI names command a growing share of capital flows while sectors with strong earnings, such as financials and healthcare, sit on the sidelines, the conventional read is that the market is fragile. Lee’s framework suggests the opposite. What follows is a breakdown of that framework, why the dot-com comparison cuts differently than most assume, and what the historical pattern implies for how investors should interpret concentration signals in the current phase of the AI rally.
Lee’s comparison to 1999 is not a broad gesture at the dot-com era. It is a phase-specific structural observation, mapped to the terminal period of the bubble rather than the multi-year arc from 1995 to 2000.
The structural match he identified is precise. AI-linked equities are commanding disproportionate capital flows while fundamentally sound, earnings-producing sectors are sidelined. According to Lee’s note, financials and healthcare “posted strong, earnings-driven gains in 2025 but have been left out of the rally simply because they are not AI plays.” He characterised the current dynamics as “largely the same” as those observed in 1999.
KB Securities expects this leadership concentration to deepen rather than rotate into a broad sector advance. Lee’s framework identifies three structural parallels:
One distinction matters. Lee is speaking primarily about Korean equities and the KOSPI, with the historical analogy drawn from the U.S. market. This geographic gap is material to how readers outside Korea should apply the framework.
Index concentration beyond dot-com levels is now documented across both Korean and U.S. markets, with the top five U.S. companies controlling roughly 30% of total U.S. equity market capitalisation, a figure that exceeds even the late-1990s peak and gives Lee’s structural parallel more empirical grounding than a purely historical analogy.
The mechanism behind the concentration pattern is not subtle. In the current environment, AI association alone is acting as a price catalyst, independent of whether a company has current or near-term earnings from AI-related activity.
Lee’s note offered a specific illustration. According to KB Securities, certain stocks are “skyrocketing on news of a visit by Jensen Huang, or a hint of forays into AI/robotics, despite the absence of related earnings.” The parallel to 1999 is direct: during the dot-com era, announcing internet-related business initiatives was sufficient to drive sharp price increases regardless of underlying financials.
KB Securities’ observation: Stocks are “skyrocketing on news of a visit by Jensen Huang, or a hint of forays into AI/robotics, despite the absence of related earnings.”
Lee is not calling these moves irrational in a short-term context. He is identifying them as historically consistent with the pattern of late-stage speculative rallies, where narrative becomes the operative variable rather than earnings.
The distinction between the two regimes matters for investors evaluating AI-adjacent equities:
Recognising which regime is driving a given stock’s performance is the first step toward evaluating whether the move has fundamental support or is riding the narrative alone.
Mainstream technical analysis treats expanding market participation as confirmation that a rally is durable. When gains spread across sectors and capitalisation tiers, the interpretation is that economic fundamentals are supporting a broad recovery rather than a narrow speculative advance. By the same logic, narrowing breadth, where fewer and fewer stocks drive the index higher, is treated as a warning sign of fragility.
This heuristic is widely held. It underpins rotation strategies, breadth-thrust indicators, and a substantial body of market commentary warning that concentrated markets are vulnerable markets.
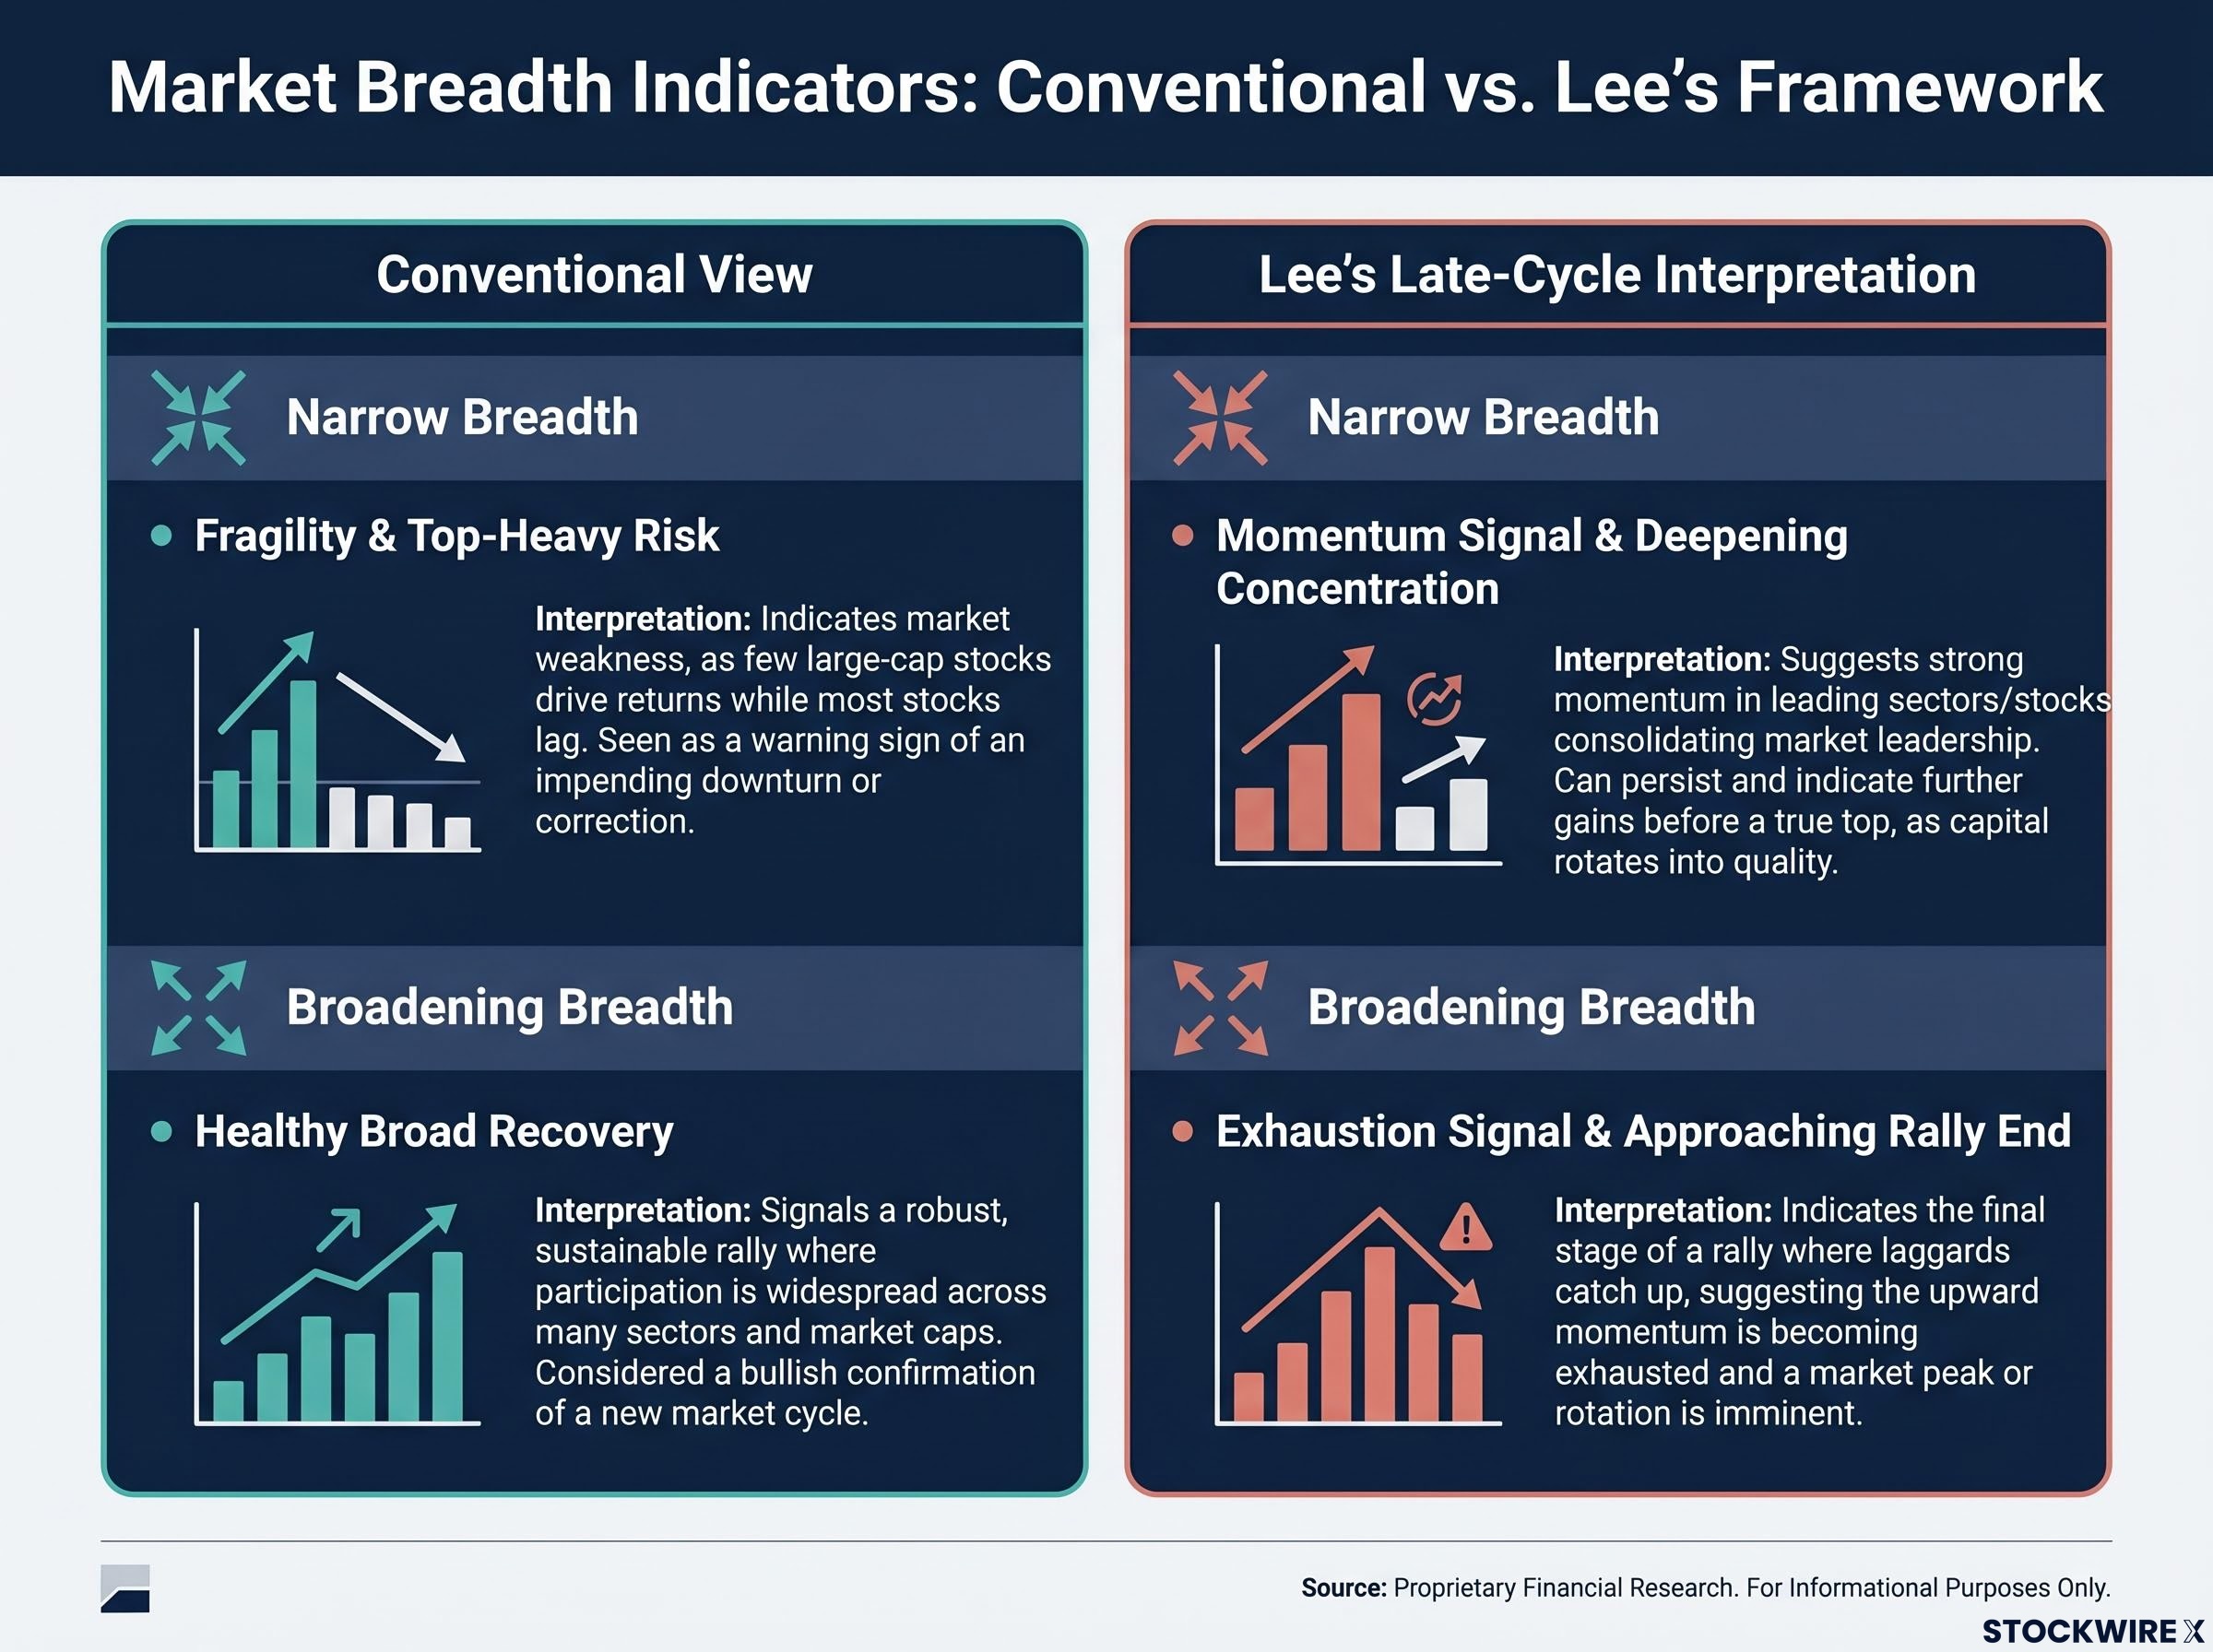
Lee challenges this logic directly. According to his note, “history shows that, in many cases, rising concentration indicates that the market still has momentum” in the late stages of speculative rallies. The signal’s meaning, in his framework, depends entirely on what phase the market is in.
He goes further. Lee argued that broadening of the rally “is not necessarily healthy” and “may be a sign that the rally is approaching its end.” The reasoning is counterintuitive but internally consistent: when capital rotates away from the dominant theme and breadth expands, it may reflect narrative exhaustion rather than renewed market health.
The phase-dependency is the critical caveat. Early in a cycle, narrow leadership can signal crowding and genuine fragility. Late in a cycle, according to Lee, it often coincides with the final powerful leg up.
| Dimension | Early-cycle interpretation | Late-cycle interpretation (Lee’s framework) |
|---|---|---|
| What narrow breadth looks like | Few stocks leading; most sectors lagging | Same pattern, but concentrated in the dominant theme |
| Conventional read | Fragility; rally lacks broad support | Fragility; market is top-heavy |
| Lee’s framework | Genuine warning; crowding risk is real | Momentum signal; concentration deepens before the final leg |
Misreading breadth signals in a late-stage rally can lead to premature exits or misplaced confidence in rotation plays. Lee’s framework suggests the signal investors should watch for is not further concentration but its opposite: a broadening that signals the AI narrative is losing its hold on capital flows.
Market breadth deterioration is measurable in real time: as of mid-May 2026, only about 51% of S&P 500 constituents were trading above their 200-day moving average, down from above 70% in March, providing a concrete data point for investors trying to locate where the current rally sits within Lee’s phase-specific framework.
Lee’s argument rests on the idea that today’s market sits in the “late stage” of a speculative cycle. For readers less familiar with how such cycles have historically unfolded, the distinction between phases matters.
Speculative cycles tend to move through three broad phases:
Lee’s framing: “Bubbles do not collapse simply because prices have risen sharply.”
This distinction matters because many retail investors conflate identifying a market as “late stage” with predicting an imminent collapse. Lee’s framework separates bubble identification from collapse timing. In his view, a serious breakdown would typically require a clear trigger, such as a sharp rise in interest rates or a major economic-cycle downturn, conditions KB Securities sees as unlikely over the next 3-6 months.
The dot-com bubble itself illustrates the point. The Nasdaq delivered some of its strongest returns in 1999, well after concentration and narrative-driven pricing were visible to market observers. The terminal phase persisted for a meaningful period before the break arrived.
This article is for informational purposes only and should not be considered financial advice. Investors should conduct their own research and consult with financial professionals before making investment decisions.
Lee’s analytical framework translates into a specific market call for Korean equities. KB Securities raised its 2026 KOSPI year-end target to 10,500, up from a prior target of 7,500, an upgrade of approximately 40%. The note carrying this call is titled “Kospi 10,500, the Ceiling Is Open” (May 2026).
The bullish case centres on three companies Lee characterises as “scarce strategic assets” whose value rises as AI investment expands:
| Company | Sector | Role in AI cycle | KB Securities’ characterisation |
|---|---|---|---|
| Samsung Electronics | Memory semiconductors | Infrastructure supplier for AI compute | Scarce strategic asset |
| SK Hynix | Memory semiconductors | High-bandwidth memory for AI training | Scarce strategic asset |
| Hyundai Motor (Boston Dynamics) | Robotics | Physical AI and robotics applications | Scarce strategic asset |
KB Securities also notes that earnings estimates for many KOSPI companies are being revised upward faster than the index itself, which in their view eases valuation concerns even as prices climb.
The structural case for Samsung Electronics and SK Hynix rests partly on documented HBM supply chain constraints in 2026, where SK Hynix’s dominant position as a high-bandwidth memory supplier creates the kind of scarcity that underpins KB Securities’ characterisation of these names as irreplaceable assets in the AI compute buildout.
The call is not a blanket endorsement. Lee’s own framework implies that the greatest asymmetric risk sits with narrative-only AI plays: stocks surging on AI branding, management visits, or vague pivot announcements without earnings to support the move. The distinction between the two categories is where the practical implication sits:
Forward-looking statements regarding KOSPI targets and earnings revisions are subject to change based on market developments and economic conditions. Past performance does not guarantee future results.
Lee’s framework does not end with a bull call. It specifies what would signal the end of this phase.
Three exit conditions emerge from his analysis, listed in the order an investor would most likely encounter them:
KB Securities sees the conditions for collapse as absent over the next 3-6 months. That is a near-term window, not an indefinite all-clear.
For investors wanting to stress-test the late-stage momentum thesis against alternative forecasts, our full explainer on the S&P 500 melt-up debate examines BCA Research’s case for a further 27% rally toward 9,200, Goldman Sachs’ more measured 7,600 year-end target, and the specific triggers — including AI monetisation guidance and Federal Reserve signals — that analysts say could stall or sharply reverse the current advance.
The practical takeaway is a monitoring framework rather than a verdict. Lee has specified what to watch for: breadth signals, catalyst conditions, and the durability of the earnings revision story. Investors who understand this signal set are better positioned to make informed decisions about their own timing and exposure rather than reacting to price moves alone.
Lee’s framework is neither a crash prediction nor an endorsement of current valuations. It is a phase-specific reading of market structure that changes what the standard warning signs mean in the current environment.
The dot-com parallel is instructive rather than deterministic. Lee’s own analysis identifies the conditions under which his reading would be proven wrong: if breadth broadens into neglected sectors, if a macro catalyst arrives, or if the AI earnings revision cycle stalls. Each of those conditions is observable and measurable.
What matters now, according to this framework, is not the price level of the index. It is whether capital continues to concentrate or begins to rotate, whether a trigger emerges, and whether the companies at the centre of the AI trade continue to deliver upward earnings revisions. Those are the signals worth watching in a market that, if history rhymes, may not be finished yet.
An AI stock bubble refers to a period where AI-linked equities attract disproportionate capital flows and price gains driven by narrative rather than earnings, mirroring the late 1990s dot-com era when internet-related stocks surged on thematic association rather than financial performance.
According to KB Securities analyst Euntaek Lee, narrowing breadth in a late-stage rally often signals continued momentum rather than fragility, because concentration in the dominant theme deepens before the final leg up; it is broadening breadth that may actually signal the rally is approaching its end.
KB Securities raised its 2026 KOSPI year-end target to 10,500, up approximately 40% from its prior target of 7,500, identifying Samsung Electronics, SK Hynix, and Hyundai Motor (Boston Dynamics) as scarce strategic assets central to the AI investment cycle.
KB Securities identifies three exit signals: capital rotating into neglected sectors like financials and healthcare (indicating narrative exhaustion), a macro catalyst such as a sharp rise in interest rates or economic downturn, and a stalling or reversal of upward earnings revisions for AI-linked companies.
Earnings-led AI plays show revenue directly tied to AI infrastructure, upward earnings revisions, and a structural supply chain role, while narrative-only plays move on thematic association, management hints about AI ambitions, or proximity to industry figures like Jensen Huang without any current AI-related revenue to support the valuation.