BofA Double-Upgrades Intel to Buy With a $135 Street-High Target
1 hr ago

The S&P 500’s aggregate return on equity reached 22% in Q1 2026, an all-time record. The number rests almost entirely on seven companies whose profitability metrics run at roughly double the index average. A Goldman Sachs report circulated among market strategists in mid-June 2026 put precise figures on both the peak and the coming decline, projecting that the same mega-cap tech cohort driving the record will see ROE fall by an average of seven percentage points in the year ahead as AI infrastructure costs lock in future depreciation charges that no revenue line can immediately offset. What follows separates confirmed historical fact from Goldman Sachs forward modelling, explains the specific mechanism through which compression will arrive, and addresses why a seven-point decline does not signal distress, and why the accounting story and the economic returns story may be telling different things at the same time.
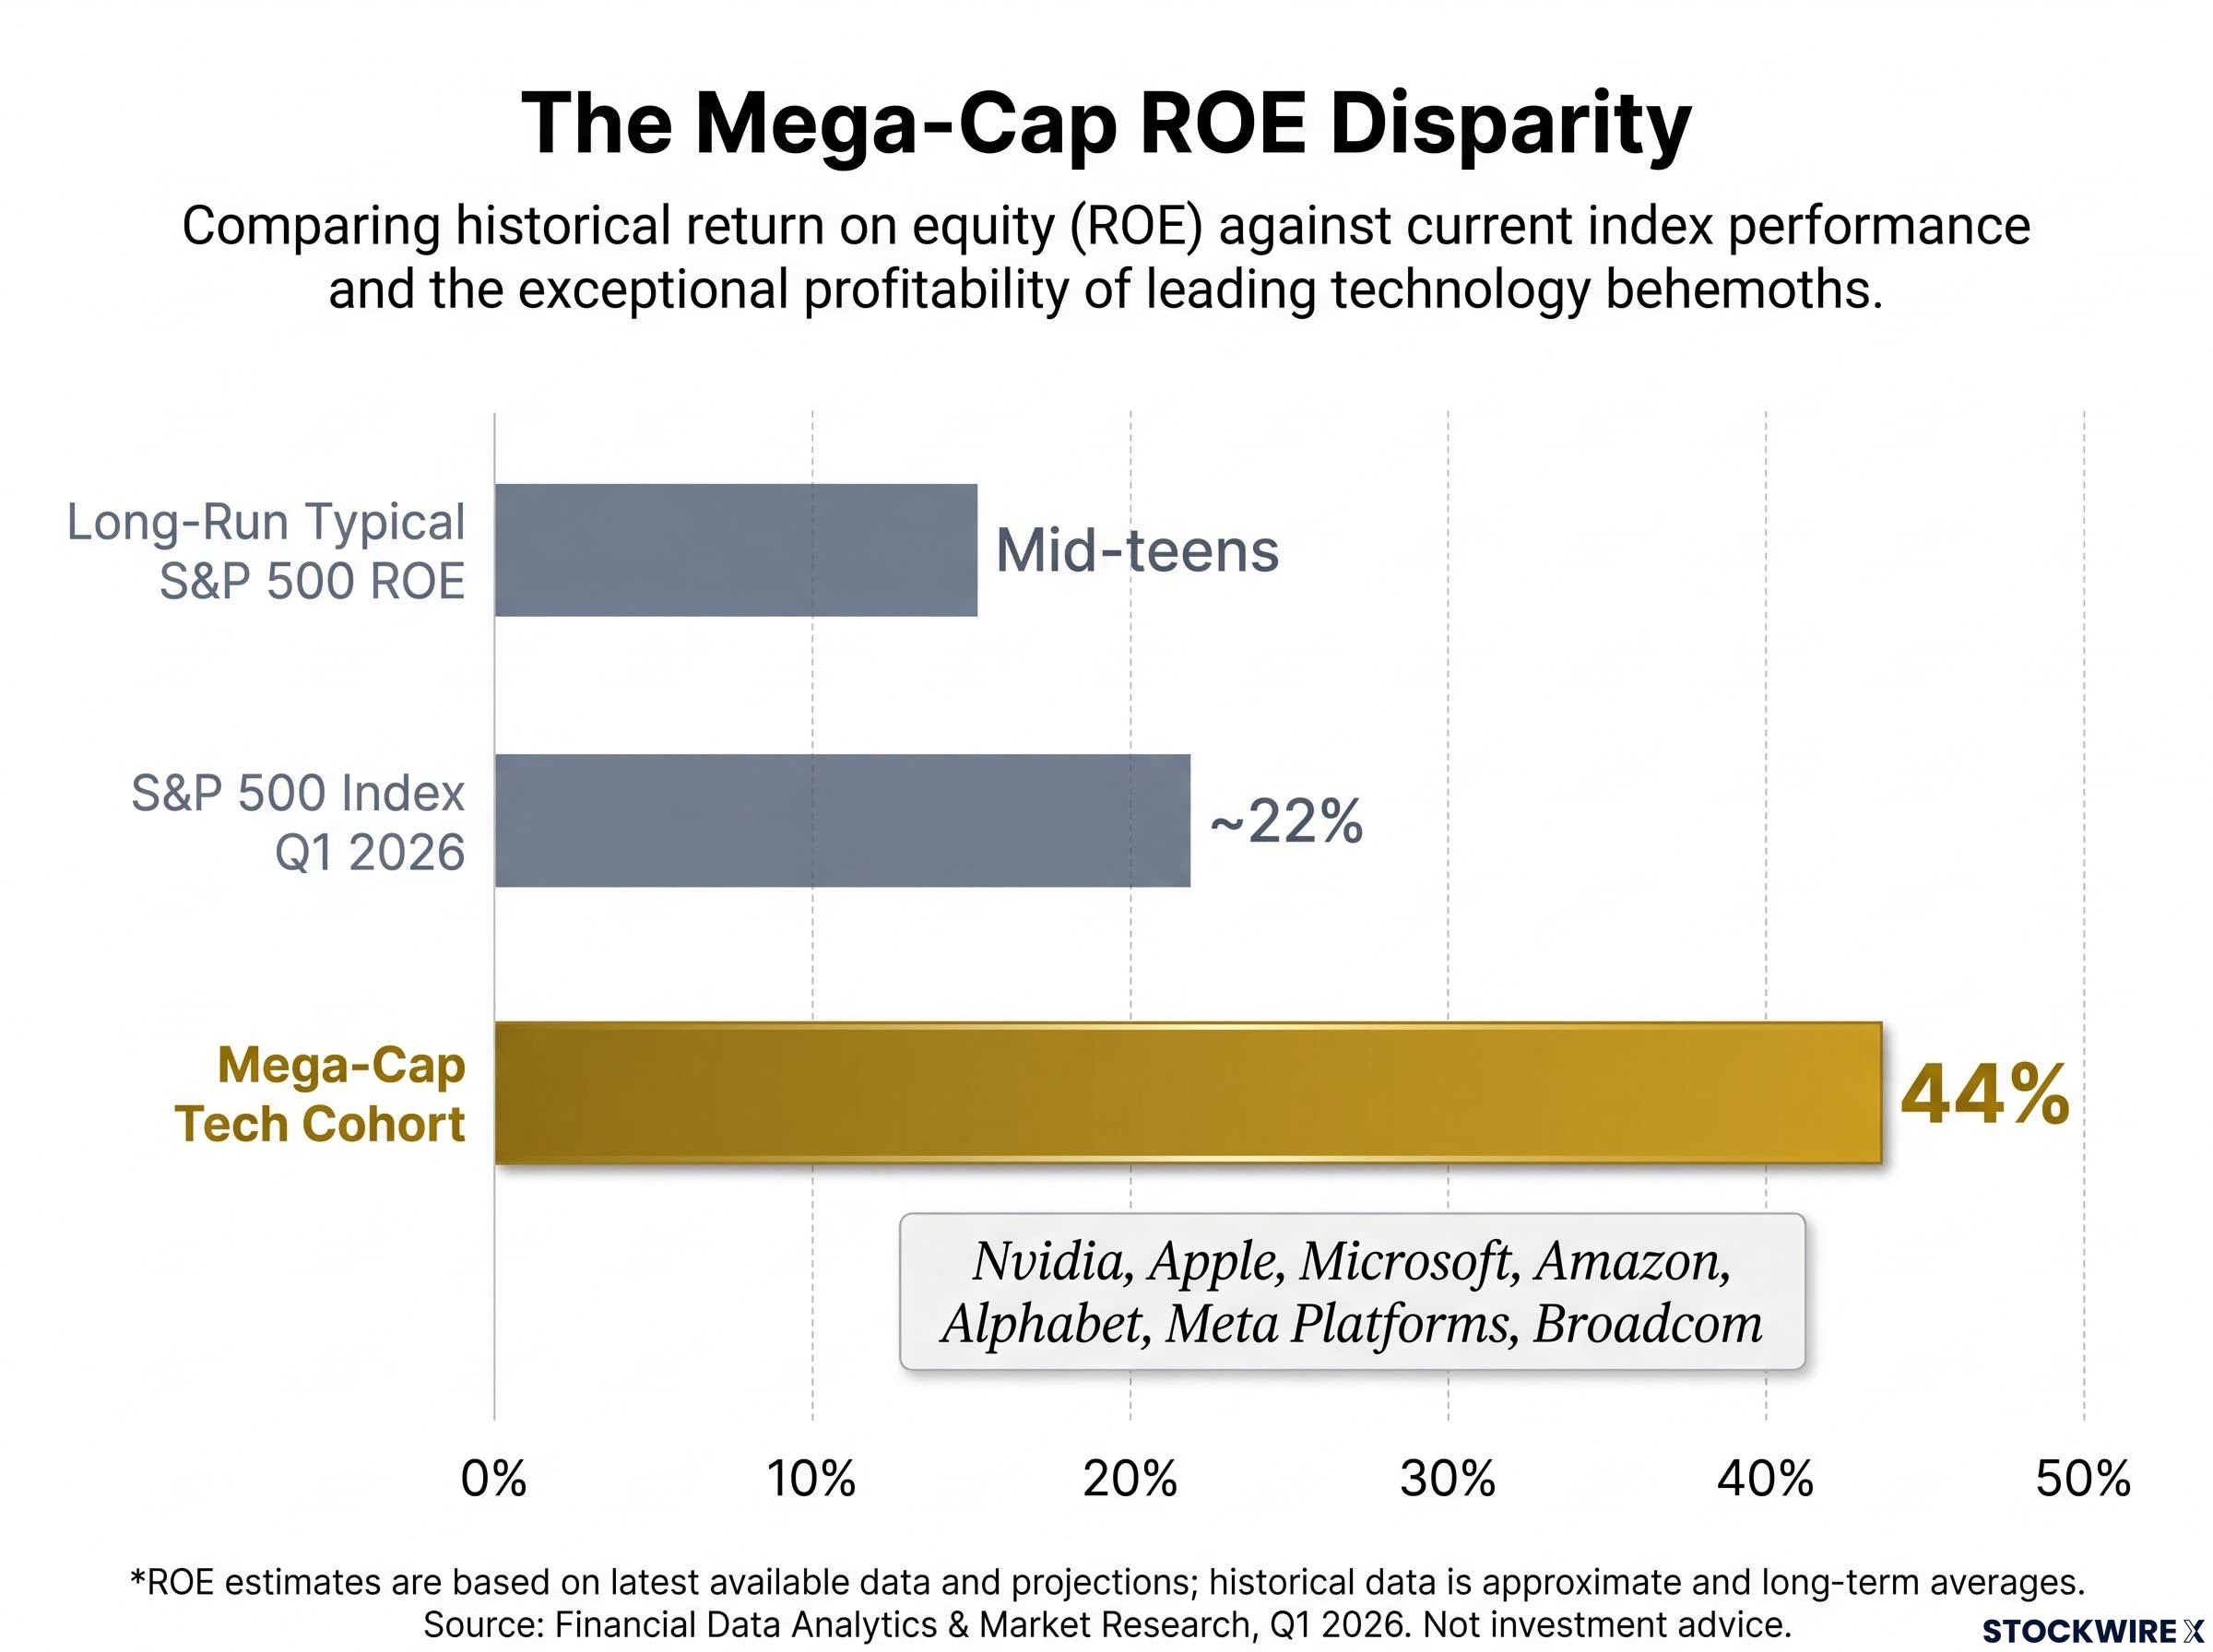
Record reading: The S&P 500 trailing four-quarter return on equity reached approximately 22% in Q1 2026, surpassing the previous peak set in 2021.
That figure substantially exceeds the long-run typical range, which has resided in the mid-teens across multiple market regimes. The gap between the current reading and the historical norm is wide enough to warrant scrutiny of what is driving it.
The answer matters. A profitability record built on rising financial leverage carries different implications from one built on operating margins. Leverage-driven ROE inflates the numerator through debt without improving the underlying business economics. Margin-driven ROE reflects genuine pricing power and cost efficiency.
DuPont decomposition of ROE components confirms that margin-driven improvements represent more durable profitability than leverage-driven gains, because profit margin expansion reflects genuine pricing power and operating efficiency rather than a mechanical increase in the debt-to-equity ratio that can reverse when refinancing conditions tighten.
Standard DuPont decomposition breaks ROE into three components: profit margins, financial leverage, and asset turnover. Goldman Sachs research and independent market commentary confirm that the margin component is doing the work in the current reading. Asset turnover has been stable. Leverage ratios have not expanded meaningfully.
This makes the record a more credible foundation for the index valuations built on top of it. It also means that any cost pressure on the margin component, the kind analysed in the sections that follow, threatens the headline figure directly. A margin-driven peak is high-quality, but it is also exposed.
The headline 22% is not a broad-based achievement. It is a weighted average pulled upward by a small cohort running at nearly double that rate.
Goldman Sachs defined a mega-cap tech grouping centred on the AI capital expenditure theme, comprising seven companies:
This cohort held a combined ROE of 44%, according to Goldman Sachs composite estimates, as cited by Investing.com. That figure is approximately double the index average. The cohort’s ROE increased by nine percentage points over the preceding three years, a rate of improvement that no other segment of the index matched.
| Metric | S&P 500 Index | Mega-Cap Tech Cohort |
|---|---|---|
| Current ROE | ~22% | 44% |
| Three-year ROE change | Modest | +9 percentage points |
| Primary ROE driver | Margin expansion (broad) | Margin expansion (software, platforms, semiconductors) |
The S&P 500 is a market-capitalisation-weighted index, which means these seven companies’ profitability flows through to the headline figure with amplified effect. The ex-mega-cap portion of the index shows lower and less volatile ROE, reinforcing the argument that concentration, not a generalised profitability surge, is the primary driver. Investors relying on the headline figure as a signal of broad corporate health may be misreading the index.
Market concentration at record levels means the headline S&P 500 ROE figure carries less information about the broad economy than it did in prior cycles; with five companies controlling roughly 30% of total US equity market capitalisation, the index has become a direct proxy for the profitability trajectory of a handful of technology platforms rather than a representative sample of corporate America.
Before the Goldman Sachs projection lands, the mechanism through which compression will arrive needs to be clear. ROE measures net profit divided by shareholder equity. Using the DuPont framework, it decomposes into profit margin (how much of each dollar of revenue becomes profit), asset turnover (how efficiently the company uses its assets to generate revenue), and financial leverage (how much of the asset base is financed by debt versus equity).
DuPont decomposition separates ROE into its three constituent drivers, profit margin, asset turnover, and financial leverage, allowing analysts to identify which component is doing the work in any given period and, critically, which component is most exposed to a change in business conditions.
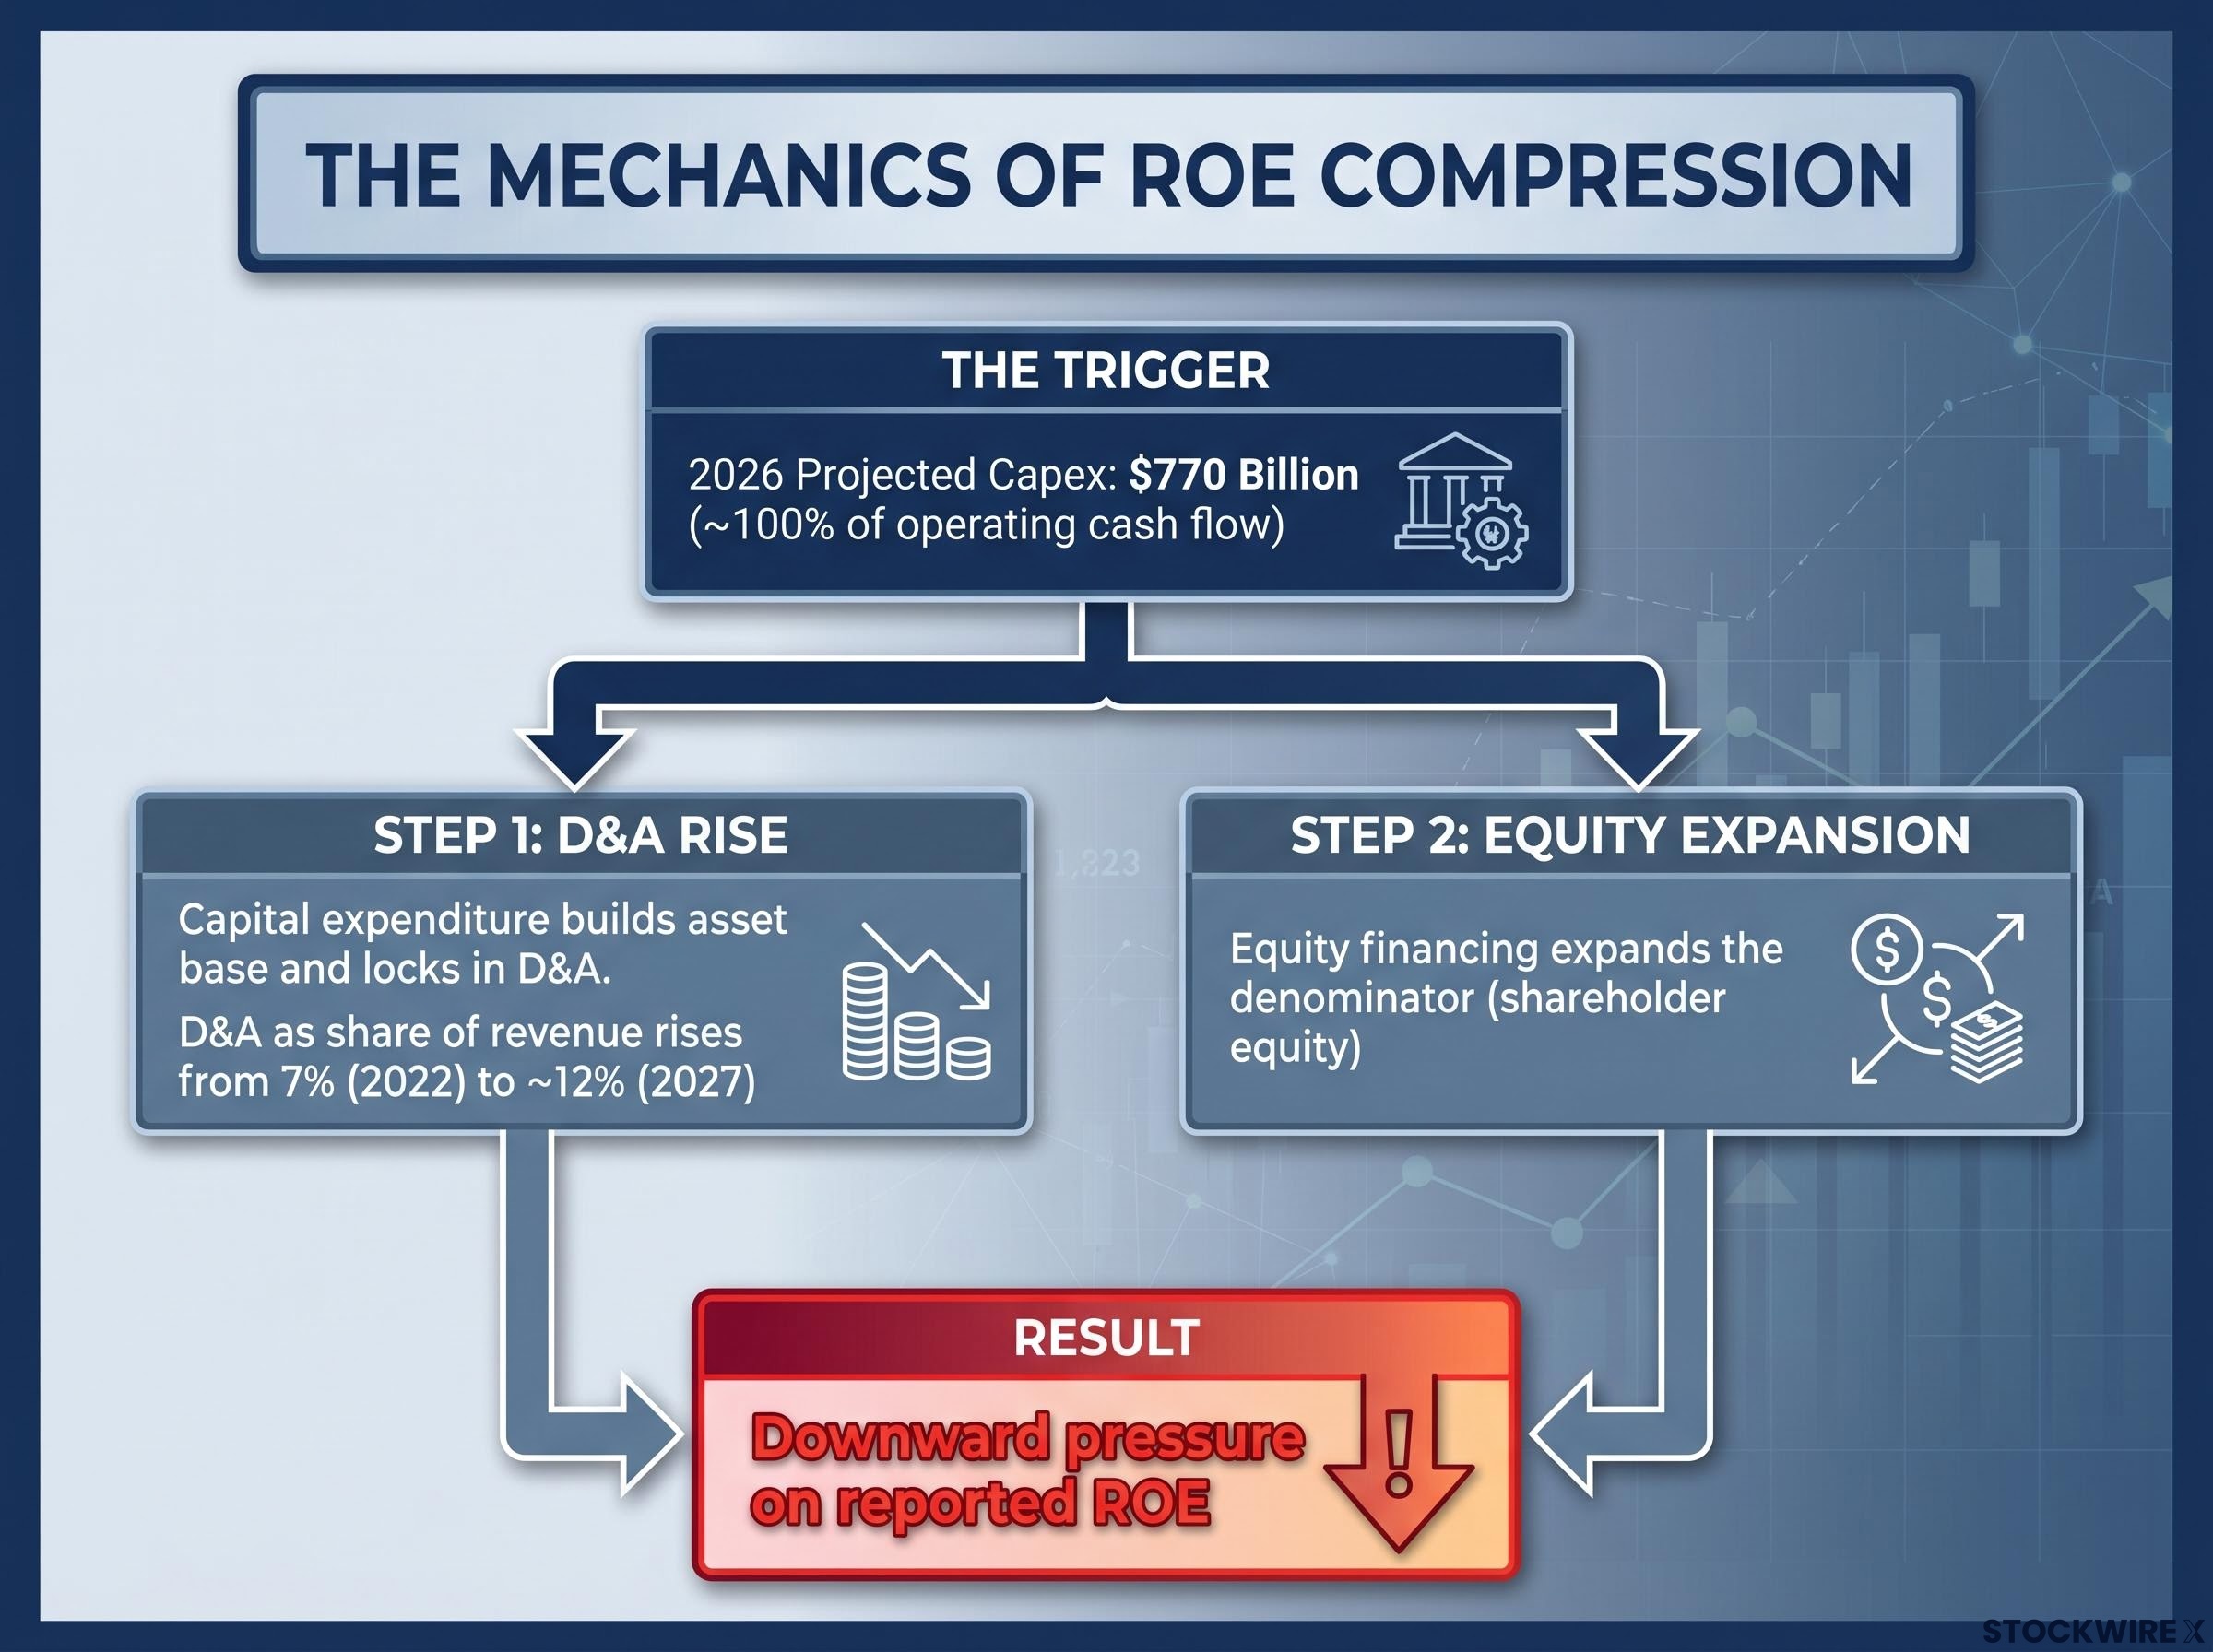
The compression Goldman Sachs projects is not a revenue story. It is a depreciation story, and it operates through a specific two-step sequence:
Goldman Sachs projects D&A as a share of revenue will rise from 7% in 2022 to approximately 12% by 2027, a five-point increase over the five-year period.
That trajectory means reported ROE declines even if revenue growth continues, because the cost side of the equation is expanding on a schedule that revenue cannot immediately match. Readers who understand this mechanism will not conflate near-term ROE compression with deteriorating business quality. The distinction between accounting cost dynamics and operational performance is the analytical key to reading the next two to three years of reported profitability data for this cohort.
Goldman Sachs projects that return on equity among the mega-cap tech cohort will fall by an average of seven percentage points in the year ahead from mid-2026. The specific magnitude is a Goldman Sachs modelling assumption, not public consensus.
According to Goldman Sachs Research, as cited by Investing.com, the hyperscaler cohort is projected to spend approximately $770 billion on capital expenditure in 2026, a figure equivalent to roughly 100% of the cohort’s operating cash flow.
Hyperscaler debt issuance has scaled alongside the capex programmes themselves, with the four largest hyperscalers issuing approximately $121 billion in bonds in 2025, roughly four times the five-year average, adding a structural financing dimension to the depreciation pressure that ROE models must account for.
That capex-to-cash-flow parity is a cohort-specific observation. It does not apply to the broader S&P 500, which includes hundreds of companies with very different capital intensity profiles. The $770 billion figure and the 100% ratio are Goldman Sachs scenario numbers derived from an aggregated model.
The seven-point decline sounds dramatic. Placed against the starting ROE and the post-decline level, the picture shifts.
| Metric | Value |
|---|---|
| Current cohort ROE | 44% |
| Projected decline | -7 percentage points |
| Implied post-decline ROE | ~37% |
| S&P 500 index ROE | ~22% |
| Long-run typical S&P 500 ROE | Mid-teens |
A post-decline cohort ROE of approximately 37% would still exceed the index average by 15 percentage points and remain far above the long-run mid-teens level. The story is a compression from exceptional to very strong, not a trajectory toward distress. All forward-looking figures in this section are Goldman Sachs model outputs and should be read accordingly.
Reported ROE compression driven by D&A charges and equity base expansion is an accounting phenomenon. It does not automatically reflect the underlying economic returns on the incremental capital being deployed into AI infrastructure. This distinction separates institutional-grade interpretation of the coming data from surface-level readings.
Two structurally coherent scenarios frame how the compression resolves:
AI monetisation speed is the single most consequential variable. The question is whether the revenues generated by the infrastructure being built will justify the capital consumed in building it, and whether competitive dynamics among simultaneous builders erode the pricing power those revenues depend on.
The resolution timeline extends beyond 2027, per Goldman Sachs’s projected trajectory. This makes it a multi-year holding question rather than a near-term catalyst event, and it means investors tracking this cohort will be watching D&A and revenue data for several reporting cycles before the outcome becomes clear.
The S&P 500’s trailing four-quarter return on equity of approximately 22% in Q1 2026 is real, margin-driven, and exceptional by historical standards. It is also a product of extreme concentration in a seven-company cohort that is now entering a period of deliberately chosen capital intensity.
Goldman Sachs projects a seven-percentage-point decline in that cohort’s ROE, driven by $770 billion in 2026 capex and a D&A trajectory that could reach approximately 12% of revenue by 2027. These are modelling outputs, not consensus. The outcome depends on AI revenue materialisation at a scale and pace that remains genuinely uncertain.
A post-decline cohort ROE of approximately 37% would still exceed the S&P 500 index average by 15 percentage points.
The concentration that created the record is the same mechanism through which near-term pressure will arrive. Tracking reported ROE for this cohort through 2026 and 2027 will be more informative as a capex accountability metric than as a pure profitability signal. Pairing it with economic return on invested capital analysis will help investors avoid misreading the accounting output as a verdict on business quality.
For investors wanting to track the index-level consequences of this concentration in real time, our deep-dive into S&P 500 breadth deterioration examines why only 50.9% of S&P 500 constituents were trading above their 200-day moving average as of mid-May 2026, how Nvidia’s earnings function as a direct stress test for the AI infrastructure thesis, and what the divergence between headline index performance and underlying constituent breadth signals about the durability of the current profitability record.
This article is for informational purposes only and should not be considered financial advice. Investors should conduct their own research and consult with financial professionals before making investment decisions. Goldman Sachs projections referenced throughout are forward-looking estimates subject to change based on market developments, company performance, and the pace of AI monetisation. Past performance does not guarantee future results.
Return on equity (ROE) measures how much net profit a company generates relative to shareholder equity, expressed as a percentage. For S&P 500 investors, it signals whether companies are using capital efficiently, and the index's 22% reading in Q1 2026 is historically high, surpassing even the 2021 peak.
The S&P 500 is market-capitalisation-weighted, meaning the largest companies have an outsized effect on aggregate figures. The seven mega-cap tech companies, including Nvidia, Apple, Microsoft, Amazon, Alphabet, Meta, and Broadcom, hold a combined ROE of 44%, roughly double the index average, pulling the headline figure well above what the broader index would show on its own.
When companies spend heavily on data centres and AI infrastructure, those assets generate fixed depreciation and amortisation charges once placed in service, reducing reported net profit regardless of near-term revenue growth. Goldman Sachs projects D&A as a share of revenue will rise from 7% in 2022 to approximately 12% by 2027, directly compressing profit margins and therefore ROE.
A decline from 44% to approximately 37% still leaves the cohort 15 percentage points above the S&P 500 index average and far above the long-run mid-teens typical range. Goldman Sachs characterises this as a compression from exceptional to very strong, not a move toward financial distress.
Reported ROE compression driven by depreciation charges is an accounting outcome reflecting the timing of cost recognition, not necessarily a deterioration in underlying business quality. If AI revenues scale over an already-depreciated asset base in later years, economic returns on invested capital could remain strong even while near-term reported ROE declines.