
Monash IVF has cut its full-year profit forecast for a second time in FY26, reducing underlying net profit after tax (NPAT) guidance to approximately $17-$18 million from the $20 million floor management defended as recently as February 2026. The downgrade, announced on 12 June 2026, comes with a familiar explanation: softening IVF volumes across the broader industry. The financial record through the first half of FY26, however, tells a more complicated story. Management’s own earnings bridge shows competitive market share losses, not sector headwinds, were the dominant drag on earnings through H1. What follows unpacks the drivers behind the second guidance cut, tests whether the industry framing holds up against the underlying data, and identifies the variables investors should track as the stock moves through the second half of FY26.
Second profit cut in a year sets a new earnings floor for FY26
The erosion arrived in stages. In August 2025, management opened FY26 with underlying NPAT guidance of $20-$23 million and flagged an intention to resume dividends if that range was achieved. At the 1H FY26 result on 26 February 2026, the company reported underlying NPAT of $10.4 million, down 34% year on year, on revenue of $137.9 million, down 1.8%. Despite the weak half, management held full-year guidance at $20 million.
That floor has now broken. The 12 June 2026 revision pulls guidance to approximately $17-$18 million, a reduction of roughly 15-25% from the original midpoint.
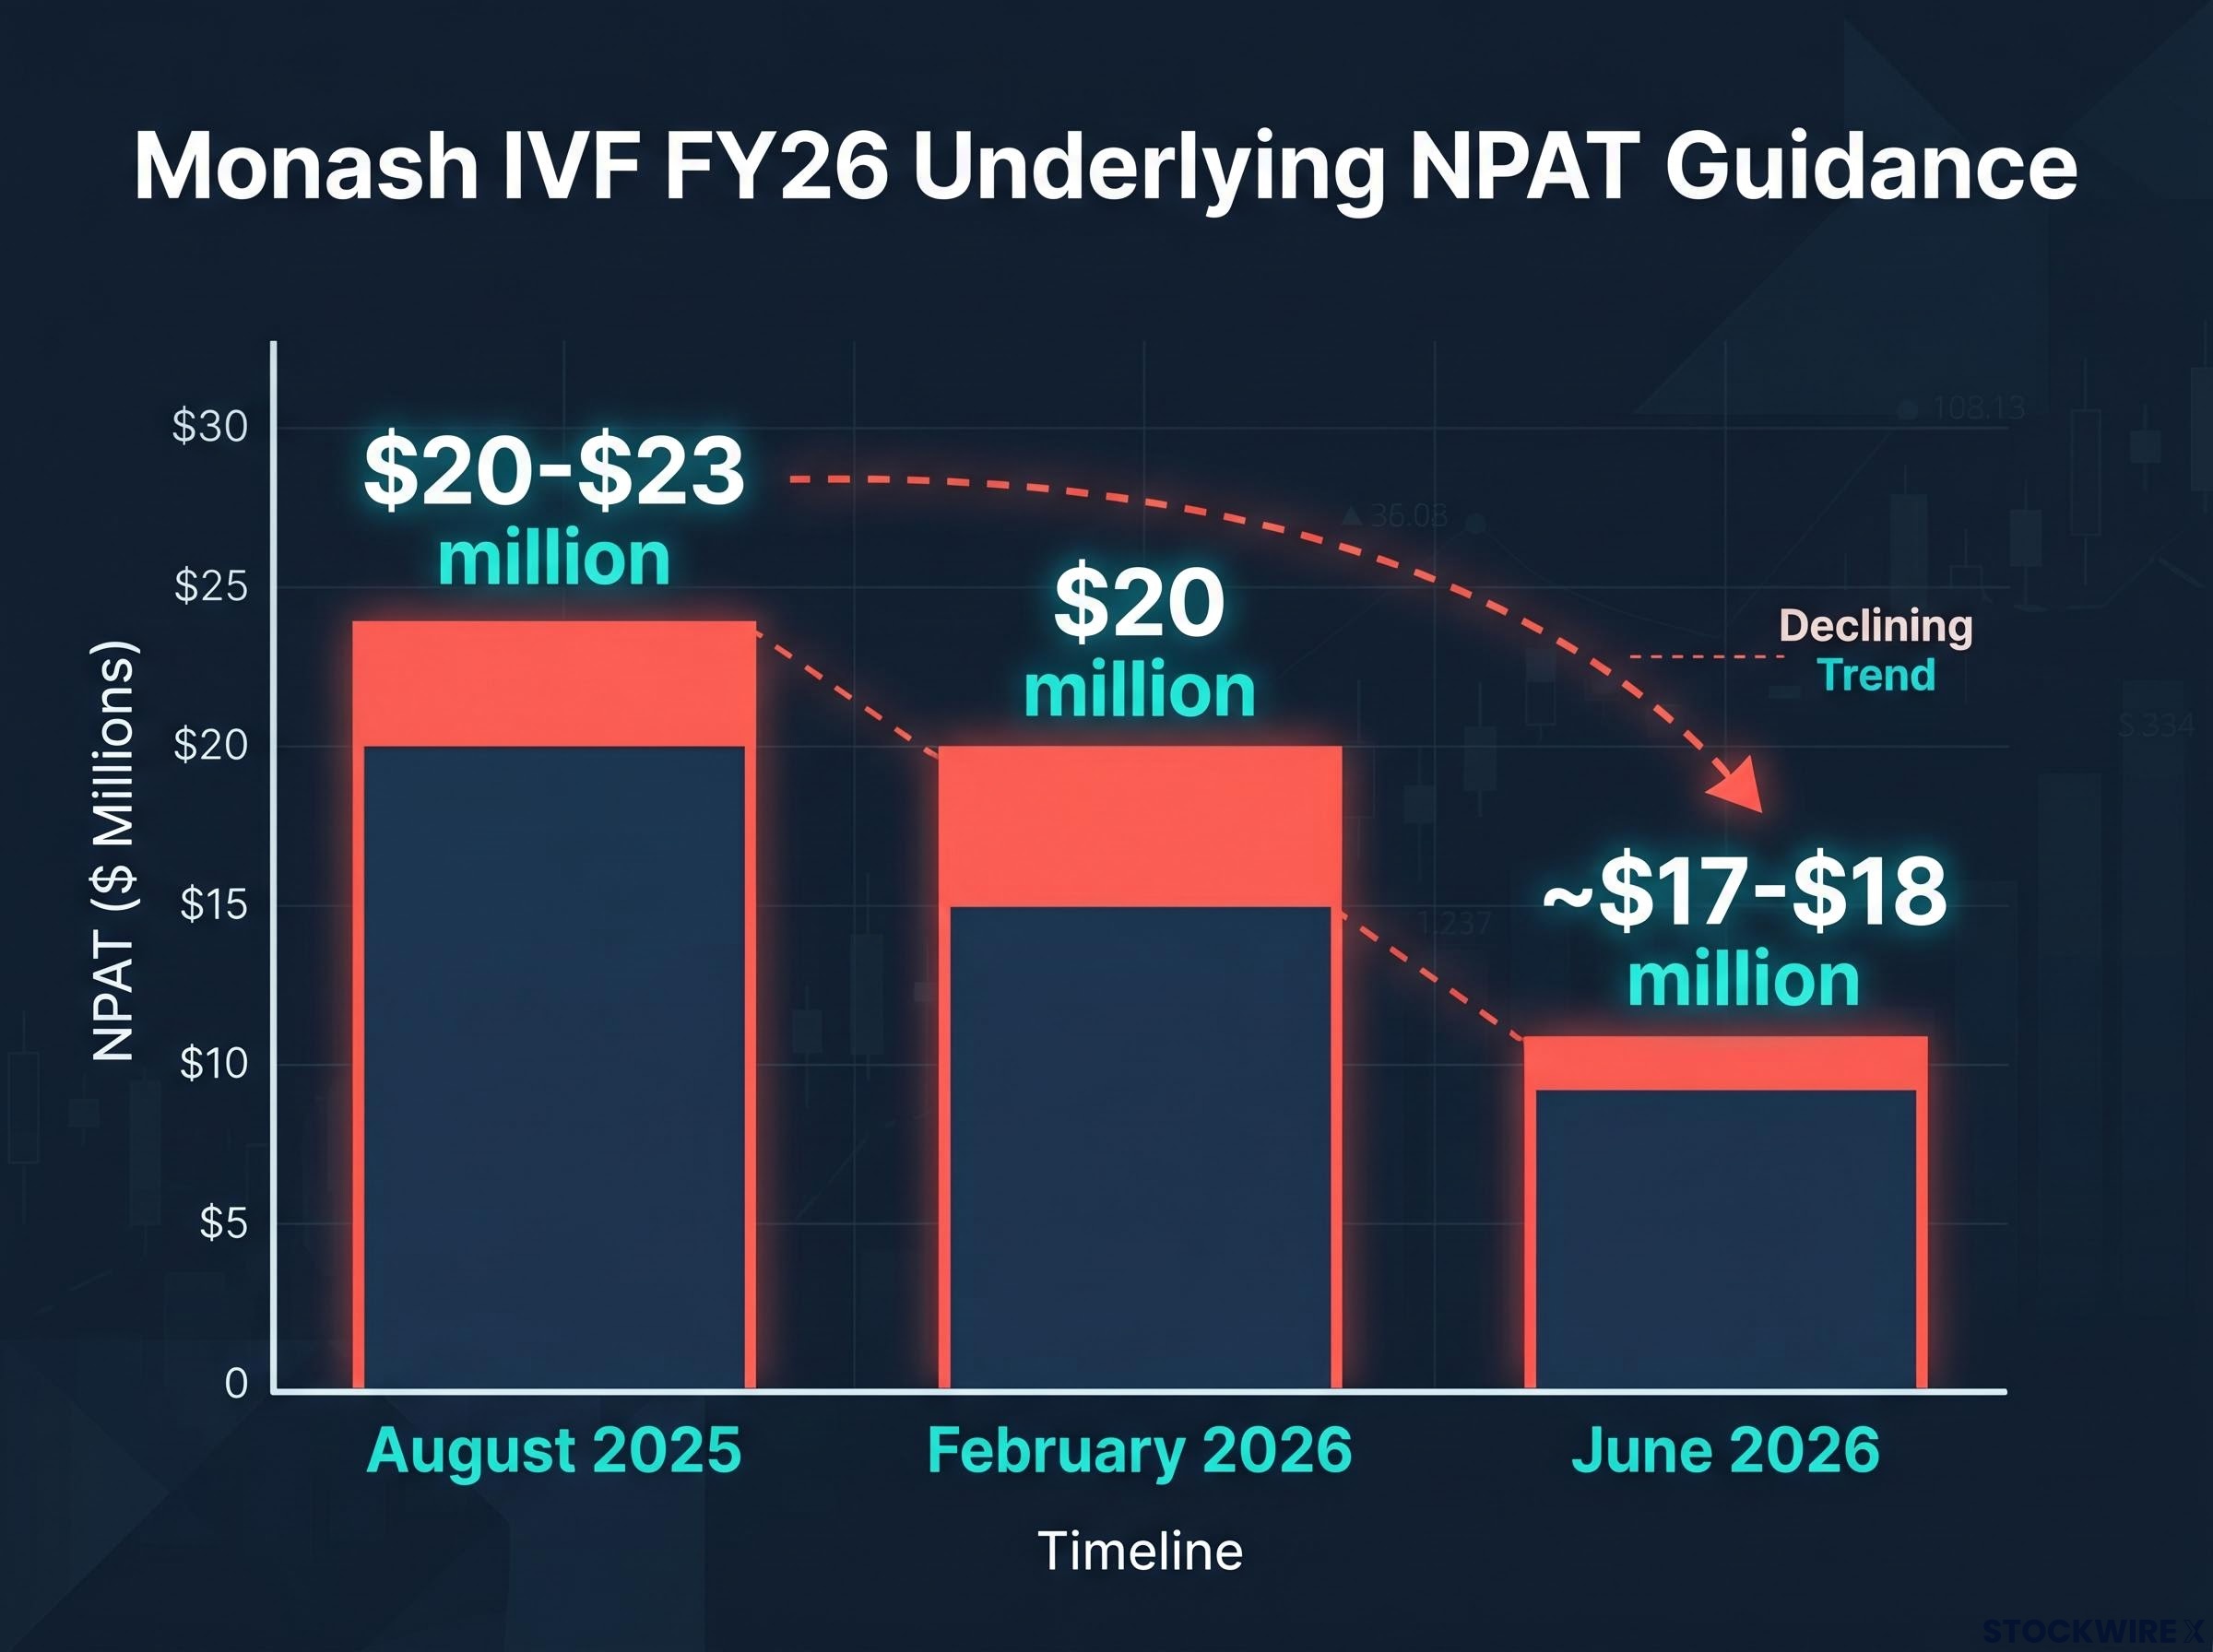
Revised FY26 guidance: approximately $17-$18 million underlying NPAT, down from $20 million held at the half-year result and $20-$23 million at the start of the financial year.
| Date | Event | Underlying NPAT guidance |
|---|---|---|
| August 2025 | FY25 full-year result | $20-$23 million |
| February 2026 | 1H FY26 result | $20 million (held) |
| June 2026 | Second guidance cut | ~$17-$18 million |
Two guidance cuts within a single financial year create a credibility problem that is distinct from the earnings quantum itself. Whether the new range represents a genuine floor is the question investors now face.
When big ASX news breaks, our subscribers know first
How the IVF sector arrived at a volume soft patch
The Australian assisted reproductive services sector has transitioned from strong post-COVID demand into a flat phase. National stimulated IVF cycles in 1H FY26 were essentially unchanged, down just 0.2%. This is a recognisable cyclical pattern rather than a structural collapse.
The ANZARD national ART cycle data compiled by UNSW’s National Perinatal Epidemiology and Statistics Unit provides the most comprehensive independent benchmark for tracking stimulated cycle volumes across Australia, giving context to the divergence between sector-wide trends and individual clinic-level performance.
The mechanism is straightforward. IVF is an elective medical procedure with significant out-of-pocket costs. When household budgets are under pressure, it is among the first categories patients delay or defer. Cost-of-living pressures across the Australian economy have compressed discretionary medical spending more broadly.
Several factors sit on either side of the demand equation:
- Headwinds: cost-of-living pressure on patient uptake; post-COVID demand normalisation
- Tailwinds: demographic trends including age-related infertility; underlying population growth
- Policy variables: Medicare rebate settings and state funding programmes
- Emerging drivers: expanded genetic carrier screening and new service categories, which management estimates could add 1-2% annual growth
Management still expects IVF demand to return to growth from FY27, projecting 2-3% annual growth in stimulated cycles from the sector overall. That sector-level recovery, however, is a different proposition from a Monash IVF-specific recovery, and the distinction matters.
What the numbers reveal that management’s framing does not
The gap between the sector’s experience and Monash IVF’s experience in H1 is stark. National stimulated IVF cycles fell 0.2%. Monash’s stimulated cycle volumes fell 9.9%.
Domestic stimulated IVF market share dropped from 21.5% to 19.0%, a 2.5 percentage-point fall concentrated in NSW and Victoria. Frozen embryo transfer market share also slipped, from 21.5% to 20.6%.
The earnings bridge tells the story
Management’s own revenue attribution breaks the problem into its components. The result is not ambiguous.
The 1H FY26 result, which delivered underlying NPAT of $10.4 million, also revealed that the genetics and diagnostics division was growing at double-digit rates and that net leverage sat at 2.0x against a 3.5x covenant, providing meaningful balance sheet headroom that remains relevant as management navigates the H2 volume question.
Revenue lost to market share erosion in 1H FY26: approximately $8.3 million. Revenue lost to industry-wide volume decline: approximately $0.2 million.
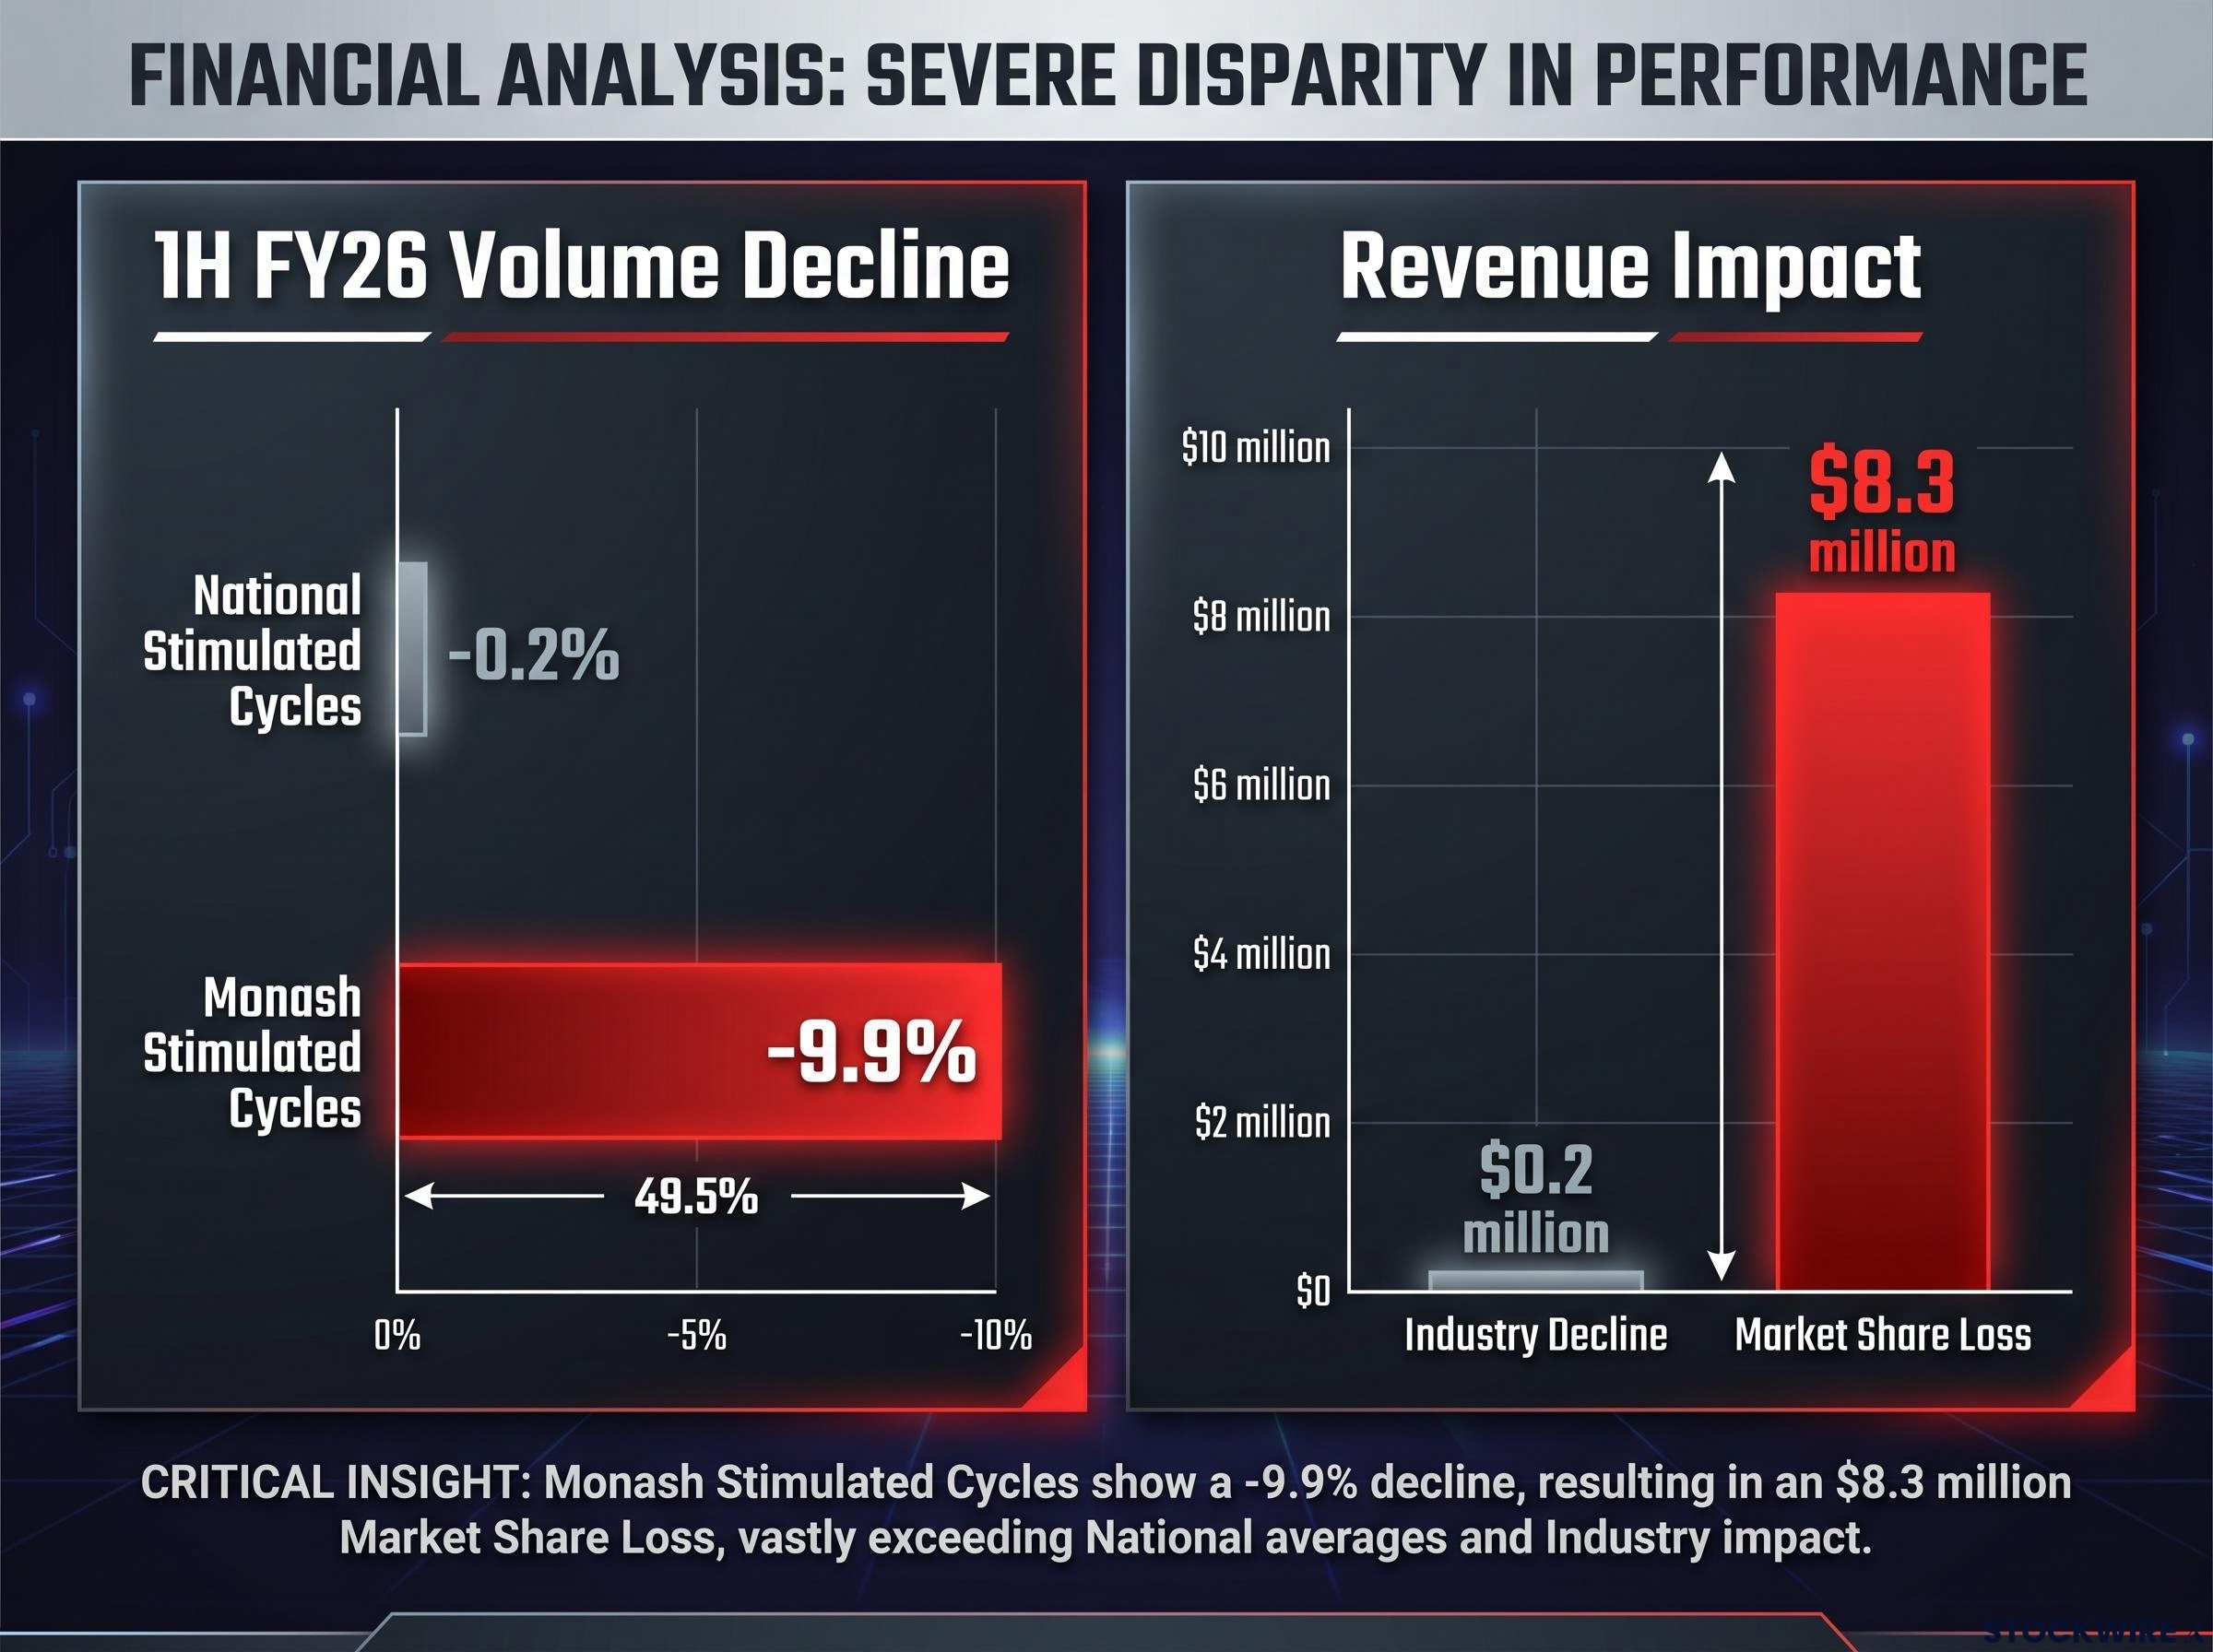
That ratio, roughly 40 to 1, makes it difficult to sustain a narrative in which sector-wide softness is the primary explanation for the earnings miss. The EBITDA impact of share losses was approximately $2.8 million. Underlying EBITDA fell 15.3% across the half.
The operational deleverage problem
The cost structure amplified the damage. Revenue declined 1.8%, but underlying NPAT fell 34%. A cost base that was sized for higher volumes converted a modest revenue shortfall into a severe profit decline. If volumes soften further in H2 FY26, the same dynamic will compound the impact.
Share price reaction and what the intraday recovery signals
Monash IVF shares fell as much as 5.9% early in the trading session on 12 June 2026 before recovering ground through the day. Both moves carry information.
The initial sell-off is mechanical. Lower earnings guidance reduces valuation directly on discounted cash flow and price-to-earnings grounds. A second downgrade in a single year compounds the credibility discount. FY25 underlying NPAT of $27.4 million was itself down 8.1% year on year, and the Board paid no final dividend for that year; the earnings trajectory has been deteriorating for some time.
The partial recovery reflects a split between two investor cohorts:
- Prior weakness already priced: Some investors view the weak FY25 result, the absent final dividend, and the February guidance hold as having already partially embedded the risk of further disappointment.
- Leveraged sector recovery play: Others may see the stock as offering amplified upside if the sector returns to growth in FY27, provided the balance sheet and competitive position remain intact.
Which interpretation the evidence supports depends heavily on whether market share stabilises or continues to erode through the second half.
Five variables that will determine whether the new guidance floor holds
The revised $17-$18 million range is management’s third attempt to set a credible FY26 earnings floor. Whether it holds depends on five observable variables, each capable of shifting the trajectory in either direction:
- National IVF cycle trend: whether the 0.2% decline in stimulated cycles worsens, stabilises, or reverses through H2 FY26 and into FY27.
- Monash market share in NSW and Victoria: any stabilisation or recovery from the current 19.0% stimulated cycle share would be a positive signal; further erosion would pressure the guidance range.
- Management execution on competitive strategy: clinician recruitment, service quality, pricing discipline, and cost base realignment to address the operational deleverage exposed in H1.
- Dividend policy update at the full-year result: the Board had linked FY26 dividend resumption to achieving initial guidance. The reduced $17-$18 million earnings base may delay or limit payout capacity, affecting income-focused shareholders.
- Medicare and government funding developments: policy changes to rebates, state funding programmes, or expanded genetic carrier screening sit outside Monash’s control but could materially shift patient demand.
The clinician leadership reset underway at Monash IVF — which included appointing a doctor-CEO, a doctor-Chief Growth Officer, and an inaugural Chief Medical Officer in May 2026 — represents the structural response to the competitive pressures that the H1 data quantified; whether that executive rebuild translates into measurable market share recovery in NSW and Victoria is the operational variable investors cannot yet score.
Management’s FY27 demand recovery assumption, 2-3% sector growth plus 1-2% from emerging drivers, underpins the longer-term thesis. The guidance progression from $20-$23 million to $20 million to $17-$18 million means that assumption now carries a heavier burden of proof.
Cyclical headwind or competitive retreat? The question FY26 results must answer
The tension at the centre of Monash IVF’s investment case is whether the earnings decline is predominantly cyclical or predominantly competitive. The H1 FY26 data tilt meaningfully toward the latter. An $8.3 million revenue drag from market share losses against $0.2 million from sector-wide softness is not a rounding error; it is the dominant driver.
A sector-level volume recovery alone will not resolve the problem. The path to share price recovery runs through demonstrable market share stabilisation in NSW and Victoria. The FY26 full-year result will be the next significant test of whether the new guidance range holds and whether the competitive narrative is improving.
Investors weighing whether the Monash IVF thesis is primarily a company-specific recovery story or part of a broader sector re-rating will find our deep-dive into ASX healthcare structural tailwinds useful — it examines the 16-percentage-point annual return gap versus the ASX 200, the role of rate-driven valuation compression, and the specific sub-segments where structural demand drivers remain intact despite prolonged share price weakness.
This article is for informational purposes only and should not be considered financial advice. Investors should conduct their own research and consult with financial professionals before making investment decisions. Past performance does not guarantee future results. Financial projections are subject to market conditions and various risk factors.