
Central banks bought 244 tonnes of gold in the first quarter of 2026 alone, a pace that puts the year on track for the fourth-highest annual sovereign accumulation since 1950. That is not a tactical trade. It is a signal worth examining.
Gold prices have moved dramatically in recent years, and most coverage focuses on near-term catalysts: interest rate expectations, dollar moves, geopolitical flare-ups. Underneath that noise, two slower-moving structural forces are reshaping the long-term gold investment case. The first is a persistent, non-cyclical shift in how sovereigns manage reserves. The second is deepening institutional anxiety about whether Western government bonds can still perform the diversification role they held for four decades.
This analysis examines both forces in depth, drawing on data from the World Gold Council (WGC), BlackRock, Goldman Sachs, JPMorgan, and the European Central Bank (ECB), to help investors assess whether gold belongs in their portfolio for structural, multi-year reasons rather than as a short-term hedge.
Sovereign debt anxiety is the mechanism, not just the backdrop
The observable buying pattern raises an immediate question: why now, and why at these prices? The answer, articulated with increasing directness by major institutions since 2024, centres on a specific diagnosis about Western sovereign debt.
Rising government debt levels in the United States, the United Kingdom, and parts of the eurozone are reducing the perceived safety and diversification value of sovereign bonds. That, in turn, increases the strategic appeal of assets with no counterparty risk. Gold is the most liquid of those assets.
The institutional voices making this connection are not peripheral. They include the asset managers and central banks that set the terms of mainstream portfolio construction:
- United States: BlackRock Investment Institute (February 2025) recommends greater strategic allocation to real assets including gold, citing “large and rising US fiscal deficits” and “shrinking demand for Treasuries from price-insensitive buyers.” Goldman Sachs (via Financial Times, 18 March 2025) argues that the “US debt trajectory and higher term premia reduce the hedging power of long-duration Treasuries.” Bridgewater Associates (via Bloomberg, September 2024) identifies “high and rising US debt levels” combined with “financial repression risks” as strengthening the long-term case for gold.
- United Kingdom: Andrew Hauser, Bank of England Executive Director (November 2024), stated that UK gilt market instability and rising public debt have altered the perception of gilts as “unquestioned safe havens,” with investors increasingly “seeking alternative stores of value” including gold.
- Eurozone: The ECB Financial Stability Review (May 2025) warned that “high and uneven public debt levels across the euro area may, over the longer term, weigh on the safe-haven status of certain sovereign bonds in episodes of stress.” Reuters reported that asset managers responded by increasing gold allocations.
JPMorgan Asset Management (January 2025) synthesised the cross-regional picture directly: “the combination of record-high sovereign debt and more volatile inflation has reduced the diversification benefits of developed-market government bonds.”
This is the structural argument that separates a long-term gold allocation from a tactical inflation trade. If the traditional safe-haven asset class is itself compromised by the fiscal conditions it is supposed to hedge against, the case for gold as a replacement diversifier strengthens on a multi-year horizon.
When big ASX news breaks, our subscribers know first
Why bonds lost their diversification power and what replaced them
The sovereign debt argument has a direct portfolio consequence, and understanding it requires a brief look at the mechanics that made bonds the default diversifier for decades.
The traditional 60/40 portfolio (60% equities, 40% bonds) worked because stocks and bonds tended to move in opposite directions during stress. When equities fell, bond prices typically rose as yields dropped, cushioning the portfolio. Two conditions sustained this relationship:
- Falling or stable inflation expectations, which allowed central banks to cut rates during downturns.
- Falling nominal yields, which generated capital gains on bond holdings precisely when investors needed them.
Both conditions held reliably from the early 1980s through 2021. Then both broke simultaneously.
What changed in 2022
When inflation surged in 2022, central banks raised rates aggressively. Equities fell. But instead of rising to cushion portfolios, bonds fell alongside them, as higher rates pushed bond prices down. The hedge failed at the exact moment it was needed.
The Bank for International Settlements (BIS) documented this in its September 2024 Quarterly Review: stock-bond correlations turned positive in several major markets in 2022-2023. The Financial Times (3 October 2024) reported that institutional investors were “substituting part of their bond hedges with gold and other real assets” in response.
The stock-bond correlation breakdown documented in 2022 is not an isolated episode; Bridgewater Co-CIO Bob Prince has argued that structural forces including de-globalisation and persistent inflation regimes are making post-60/40 portfolio construction the new baseline challenge for long-horizon investors, not a temporary adjustment.
Gold’s behaviour during the same period was markedly different. The WGC (March 2025) found that the negative correlation between gold and equities persisted through 2022-2024, providing diversification that bonds failed to deliver. In the WGC’s framing, “nominal government bonds have not consistently provided the diversification they did in the prior four decades,” whereas gold “maintained its role as a diversifier and tail-risk hedge.”
The OECD (November 2024) added a structural dimension: high public debt may limit how far yields can fall in future recessions, reducing the scope for the duration-based hedging that powered the 60/40 model before 2020.
For any investor who relies on a bond allocation to buffer equity volatility, this correlation breakdown warrants examination in the current structural environment.
Central bank gold buying has crossed a structural threshold
The scale of sovereign gold accumulation over the past three years has no modern precedent outside of the immediate post-war period. Central banks purchased a net 1,044.6 tonnes in 2024, the third-highest annual total on record. Full-year 2025 added another 863 tonnes. The Q1 2026 pace of 244 tonnes projects to a full-year total that would rank fourth since 1950, according to UBS Switzerland CIO Michael Bolliger.
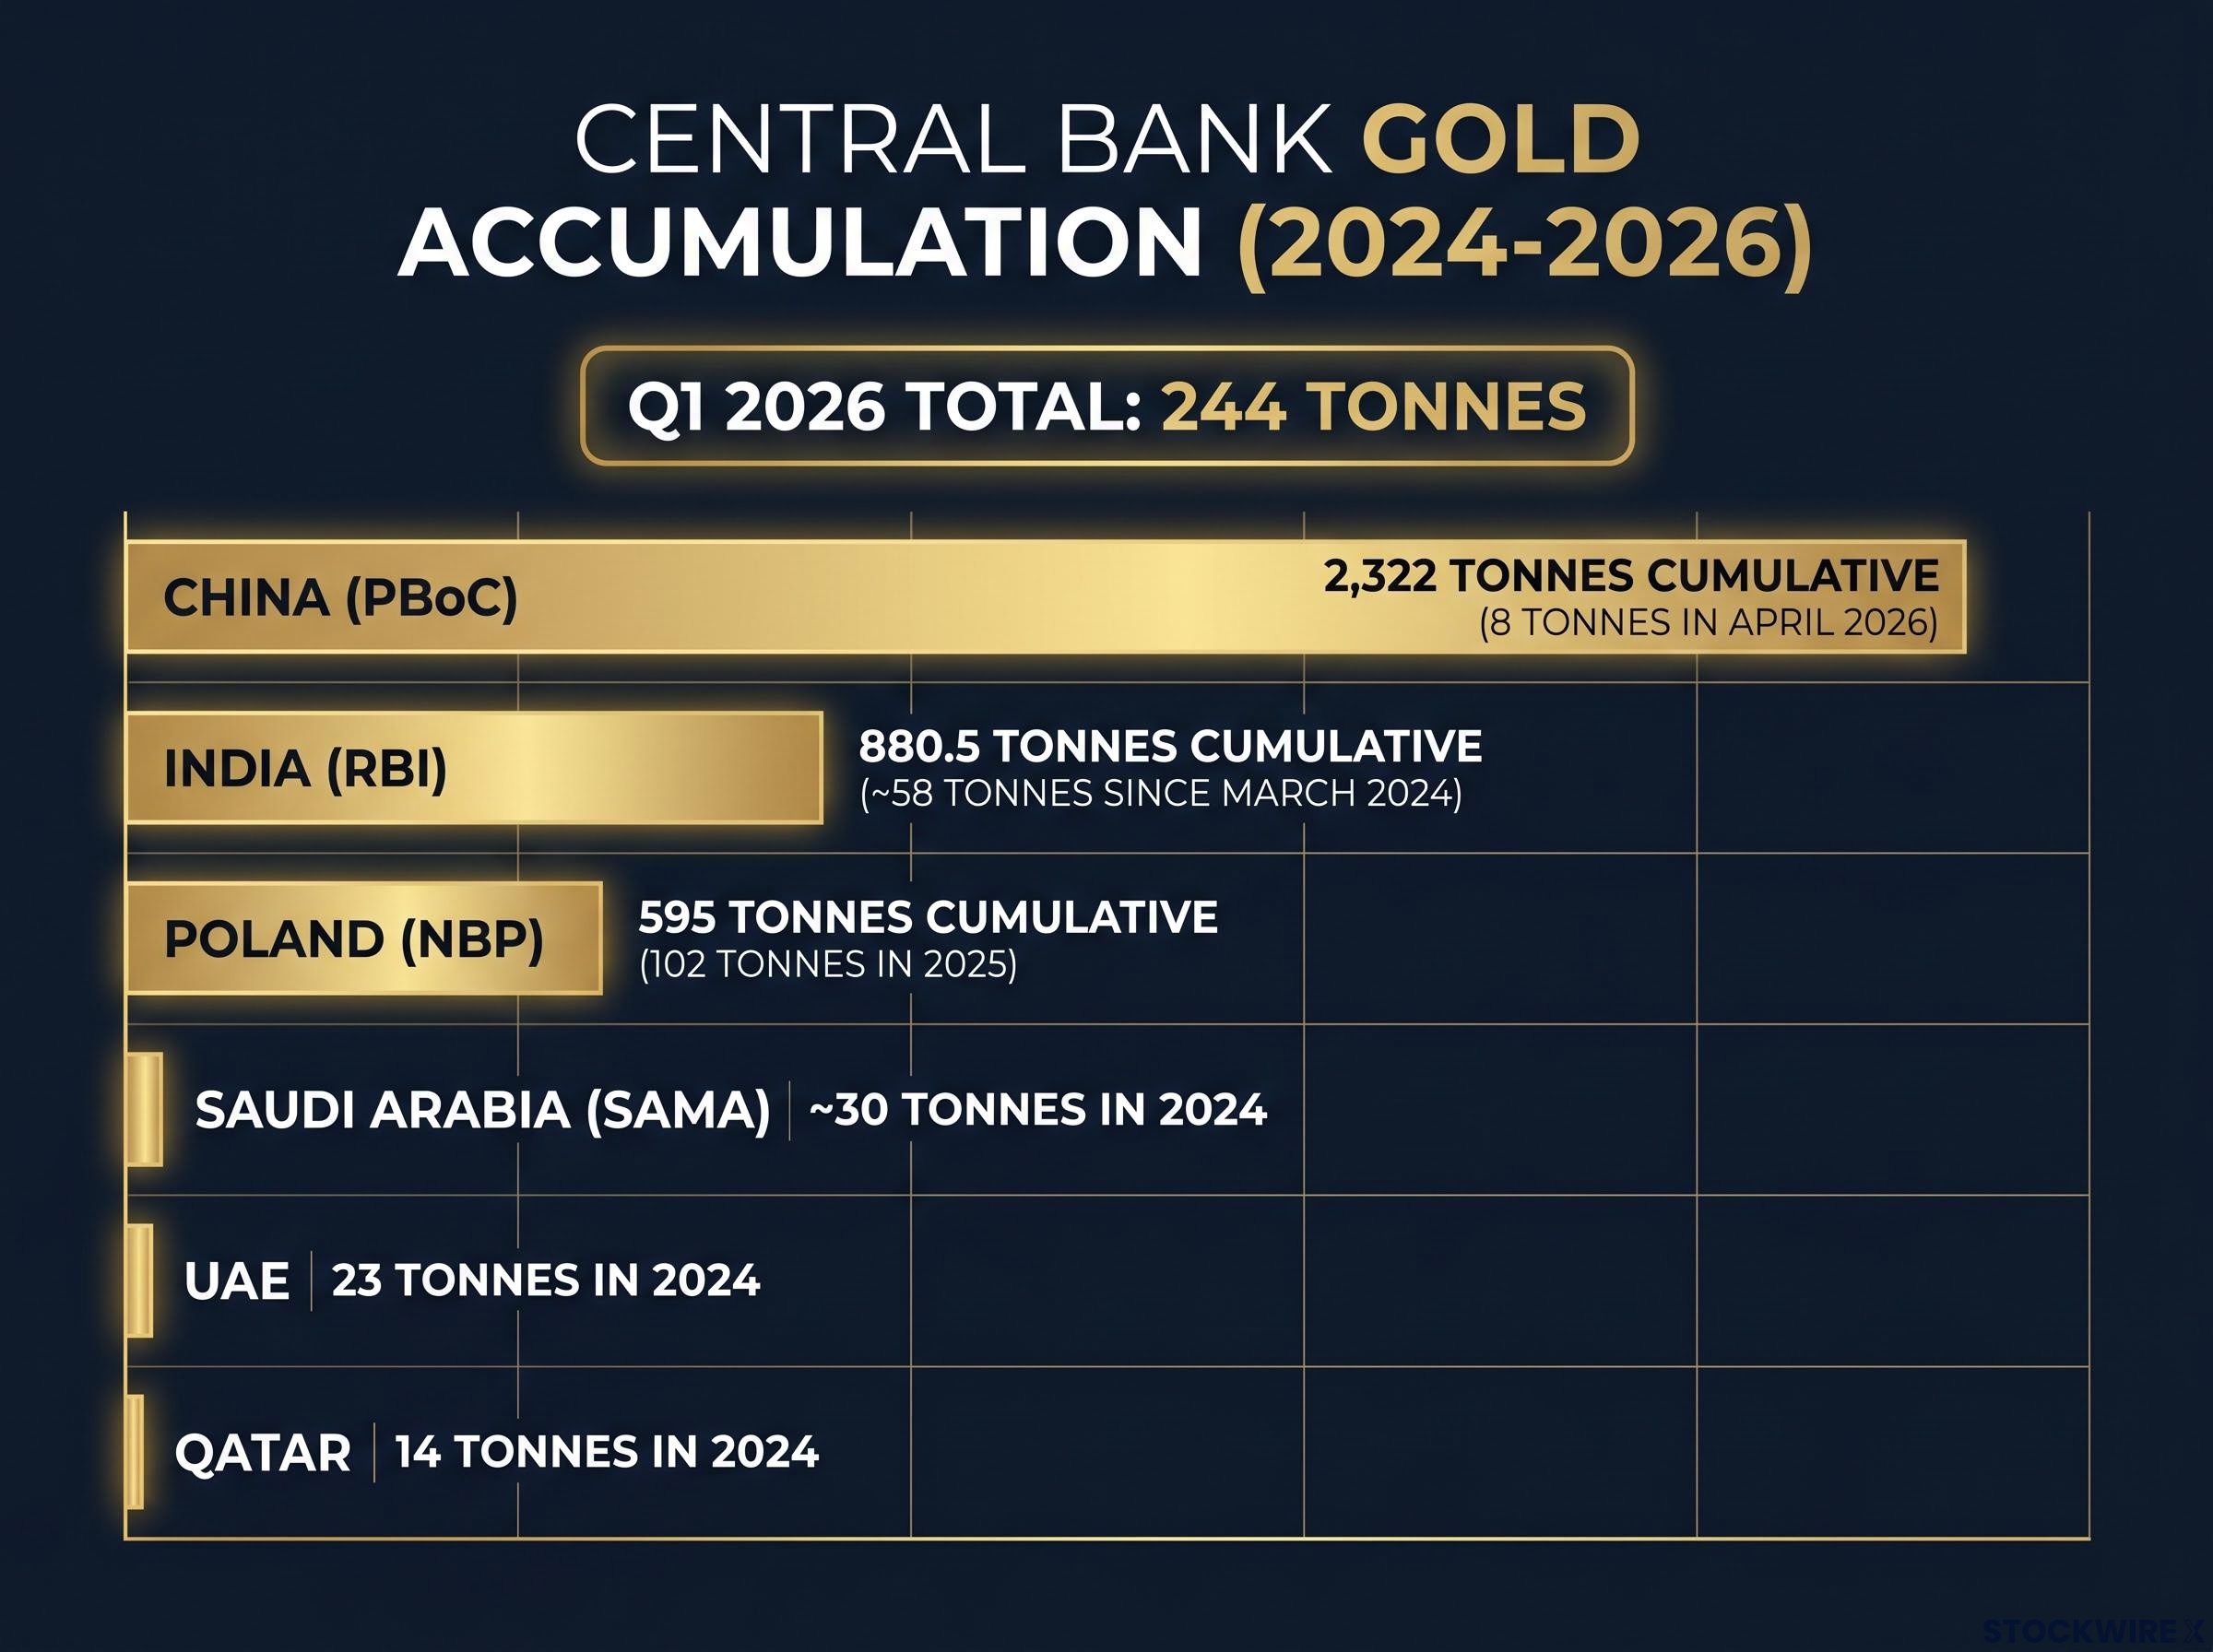
The buying is not confined to one region. It is geographically distributed across Asia, the Gulf, and Eastern Europe, and it has persisted through multiple price environments, including periods of record-high gold prices.
| Country / Institution | 2024-2026 Key Volume | Cumulative Reserves (Latest) | Notable Context |
|---|---|---|---|
| China (PBoC) | 8 tonnes (April 2026 single-month) | 2,322 tonnes | 18 consecutive months of buying as of April 2026 |
| India (RBI) | ~58 tonnes added since March 2024 | 880.5 tonnes | Highest annual additions in over a decade through FY 2023-24 |
| Poland (NBP) | 102 tonnes (full-year 2025) | 595 tonnes (~30% of total reserves) | One of Europe’s most aggressive sovereign buyers |
| Saudi Arabia (SAMA) | ~30 tonnes (2024) | Undisclosed (rising) | Part of broader FX-reserve diversification |
| UAE | 23 tonnes (2024) | Undisclosed (rising) | Consistent Gulf-region accumulation pattern |
| Qatar | 14 tonnes (2024) | Undisclosed (rising) | Listed among WGC “notable buyers” for 2024 |
What distinguishes this buying from previous cycles is its persistence through rising prices. The People’s Bank of China (PBoC) added to reserves for 18 consecutive months through April 2026. Poland committed 102 tonnes in a single year. These are not price-sensitive purchases. They behave like structural reserve policy.
The sovereign buying pattern visible in PBoC and NBP data sits within a broader macro current: reserve diversification away from Western financial infrastructure has accelerated across Asia and the Gulf as geoeconomic fragmentation creates structurally distinct currency and settlement blocs that reduce the natural demand for dollar-denominated reserves.
Michael Bolliger, UBS Switzerland CIO (June 6, 2026): “Persistent large-scale sovereign purchases are providing a resilient demand foundation beneath current market prices, independent of short-term price trends.”
For long-term investors, demand that is non-cyclical and geographically diversified represents a fundamentally different kind of price support than speculative buying. Understanding its scale is the foundation for assessing gold’s structural case.
Portfolio evidence for long-term gold allocation
The conceptual argument gains weight when paired with the specific portfolio construction data that major institutions have published over the past two years.
The WGC (October 2024) quantified the effect directly: from 2013 to 2023, a 60/40 portfolio with a 10% gold allocation (funded equally from equities and bonds) produced higher Sharpe ratios and shallower maximum drawdowns than a traditional 60/40. The effect was most pronounced in 2022, when both equities and bonds fell while gold was broadly flat.
BlackRock (December 2024) reached a consistent conclusion: adding a 5-10% gold allocation to a 60/40 portfolio improved risk-adjusted returns over the prior decade, particularly during the 2020 and 2022 drawdowns. US Treasuries “delivered negative or low real returns in several stress episodes while gold posted positive or flat performance.”
| Portfolio | Sharpe Ratio (2013-2023) | 2022 Drawdown Behaviour | Source |
|---|---|---|---|
| Traditional 60/40 | Lower | Equities and bonds fell simultaneously | WGC (October 2024); BlackRock (December 2024) |
| 60/40 with 10% gold | Higher | Gold broadly flat, cushioning overall drawdown | WGC (October 2024); BlackRock (December 2024) |
Where institutional money is already moving
The portfolio data is not just academic. Documented reallocation activity is already underway at the asset manager and pension fund level:
- Allianz Global Investors (February 2025) “modestly increased allocations to commodities and gold-related strategies in multi-asset portfolios” in response to weaker bond diversification.
- BlackRock multi-asset funds raised gold allocations by 1-2 percentage points in late 2024 and early 2025, citing US fiscal concerns and persistent inflation risks (Bloomberg, 4 March 2025).
- Swiss pension funds raised gold allocations from approximately 2% toward 3-4% since 2023, citing the stock-bond correlation breakdown and sovereign debt concerns (NZZ, May 2025).
The question for long-term investors shifts from whether to consider gold to what allocation size the evidence supports.
The honest counterargument: what gold does not do
A structural thesis that cannot survive engagement with its strongest objections is incomplete. Three counterpoints deserve direct consideration:
- Vanguard (January 2025) argues that the 2022-2023 bond diversification failure “is not permanent” based on historical precedent. Gold “can play a role as a tactical diversifier,” but its lack of income and higher volatility make it a complement rather than a replacement for bonds in a long-horizon portfolio.
- The OECD (November 2024) notes that as inflation normalises, real yields on government bonds become less negative, potentially restoring some of their defensive characteristics. If the inflation regime reverts, part of the structural gold case weakens.
- No documented gold reallocation has been confirmed from major sovereign wealth funds, including Norway’s NBIM, Singapore’s GIC and Temasek, or Saudi Arabia’s PIF, as of June 2026. The institutional shift is documented at the asset manager and pension fund level, but the largest pools of sovereign capital have not publicly followed.
These objections do not invalidate the structural thesis. They calibrate it. Gold’s lack of income means opportunity cost rises with real interest rates. The bond correlation breakdown may partially reverse. The institutional consensus is strong but not unanimous.
Fed rate expectations and near-term gold price dynamics introduce a practical complication for investors who accept the structural thesis: the 244-tonne Q1 2026 demand floor has not prevented a significant drawdown driven by Treasury yield repricing, demonstrating that structural tailwinds and cyclical headwinds can coexist for extended periods.
Sizing a gold allocation: evidence, variables, and positioning
The structural case rests on three reinforcing forces: a non-cyclical central bank demand floor, sovereign debt levels that are eroding bond diversification properties, and portfolio construction data showing gold improves risk-adjusted returns in a higher-rate world. None of these forces depend on near-term price momentum. All three operate on a multi-year horizon.
The institutional evidence supports a 5-10% gold allocation for long-horizon diversified portfolios, with 10% representing the ceiling modelled by the WGC and BlackRock across the 2013-2023 period. Within that range, three decision variables shape the right answer for an individual investor:
- Investment horizon: The structural thesis is a multi-year argument, not a 12-month trade. Investors with shorter planning windows face different risk-return trade-offs.
- Current bond allocation: The higher an investor’s existing allocation to developed-market government bonds, the more directly the diversification breakdown documented in this analysis applies to their portfolio.
- Implementation vehicle: Physical gold, exchange-traded funds (ETFs), and mining equities carry different risk profiles. Mining equities introduce company-specific and operational risks beyond the gold price itself.
Gold prices are highly dynamic, and available data sources show conflicting price levels for mid-2026. Investors should verify current prices independently before making any entry decision.
Michael Bolliger, UBS Switzerland CIO (June 6, 2026): Investors should “recalibrate their long-term positioning in bullion to reflect these deeper changes in global financial architecture.”
This article is for informational purposes only and should not be considered financial advice. Investors should conduct their own research and consult with financial professionals before making investment decisions. Past performance does not guarantee future results. Financial projections are subject to market conditions and various risk factors.
Two structural forces, one portfolio question
The case built across this analysis is not a tactical call on gold’s next move. It is a structural observation about what has changed in the architecture of portfolio diversification: central bank demand has shifted from cyclical to structural, and the sovereign bond market that anchored four decades of 60/40 construction is under fiscal pressure that multiple major institutions now consider durable.
What distinguishes this thesis from a momentum argument is its independence from near-term price direction. The demand floor, the debt trajectory, and the correlation data all operate on horizons measured in years, not quarters.
For investors who have not revisited their bond allocation assumptions since the 2022 correlation shock, the institutional consensus documented here provides a framework for doing so. That reassessment, paired with current price data and professional financial advice, is the starting point for a considered allocation decision.
For investors ready to translate the structural thesis into specific portfolio actions, our comprehensive walkthrough of geopolitical portfolio positioning covers the five-component resilience checklist that BlackRock and Vanguard recommend, including gold allocation sizing, bond duration adjustments, rebalancing cadence, and sector exposure review, with worked examples across different portfolio sizes and risk profiles.
—