ASX SEMI Returned 148%: Is the Semiconductor Thesis Still Intact?
6 hrs ago


Commonwealth Bank of Australia and Macquarie Group sit in millions of Australian portfolios, yet they represent fundamentally different bets on the financial sector. CBA is trading at approximately 26 times forward earnings as of late May 2026, a valuation that would make many growth stocks blush, while delivering the steady fully franked income that has made it a near-default holding for domestic investors. Macquarie, meanwhile, posted A$4.85 billion in net profit for FY26 on the back of a 27% surge in asset management earnings, powered by global infrastructure and energy transition themes that bear no resemblance to a traditional banking franchise. For Australian investors reviewing their ASX financials allocation, the question is not which company is better run. Both are high-quality institutions with comparable returns on equity. The question is which investment proposition fits their actual objectives. This analysis breaks down the core trade-off between CBA’s domestic income stability and Macquarie’s global growth optionality, covering valuations, earnings quality, dividend mechanics, growth pathways, and the risks that each stock carries from the current entry point.
This is not a quality contest. CBA and Macquarie both generate returns on equity above 13%, and both have delivered consistent capital returns across market cycles. The comparison that matters is structural: what kind of earnings engine is each company, and what role does it play in a portfolio?
The wrong question is “which is better.” The right question is “which fits.”
CBA is Australia’s largest bank, and its earnings are a direct function of the Australian economy.
Macquarie is more accurately described as a global financial group than a bank. Its four main operating segments span asset management, commodities and global markets, capital advisory, and banking and financial services.
Macquarie’s banking division adds a dimension often overlooked in the asset management narrative: its retail banking and financial services arm grew deposits 6% and home loans 7% in Q3 FY26, demonstrating that the domestic banking operation is itself gaining market share even as the global platform attracts the majority of investor attention.
The ROE figures tell the story. At 13.5% for CBA and 14.0% for Macquarie, the quality gap is negligible. The structural gap is not.
The financial metrics, placed side by side, reveal an asymmetry that is difficult to explain by fundamentals alone.
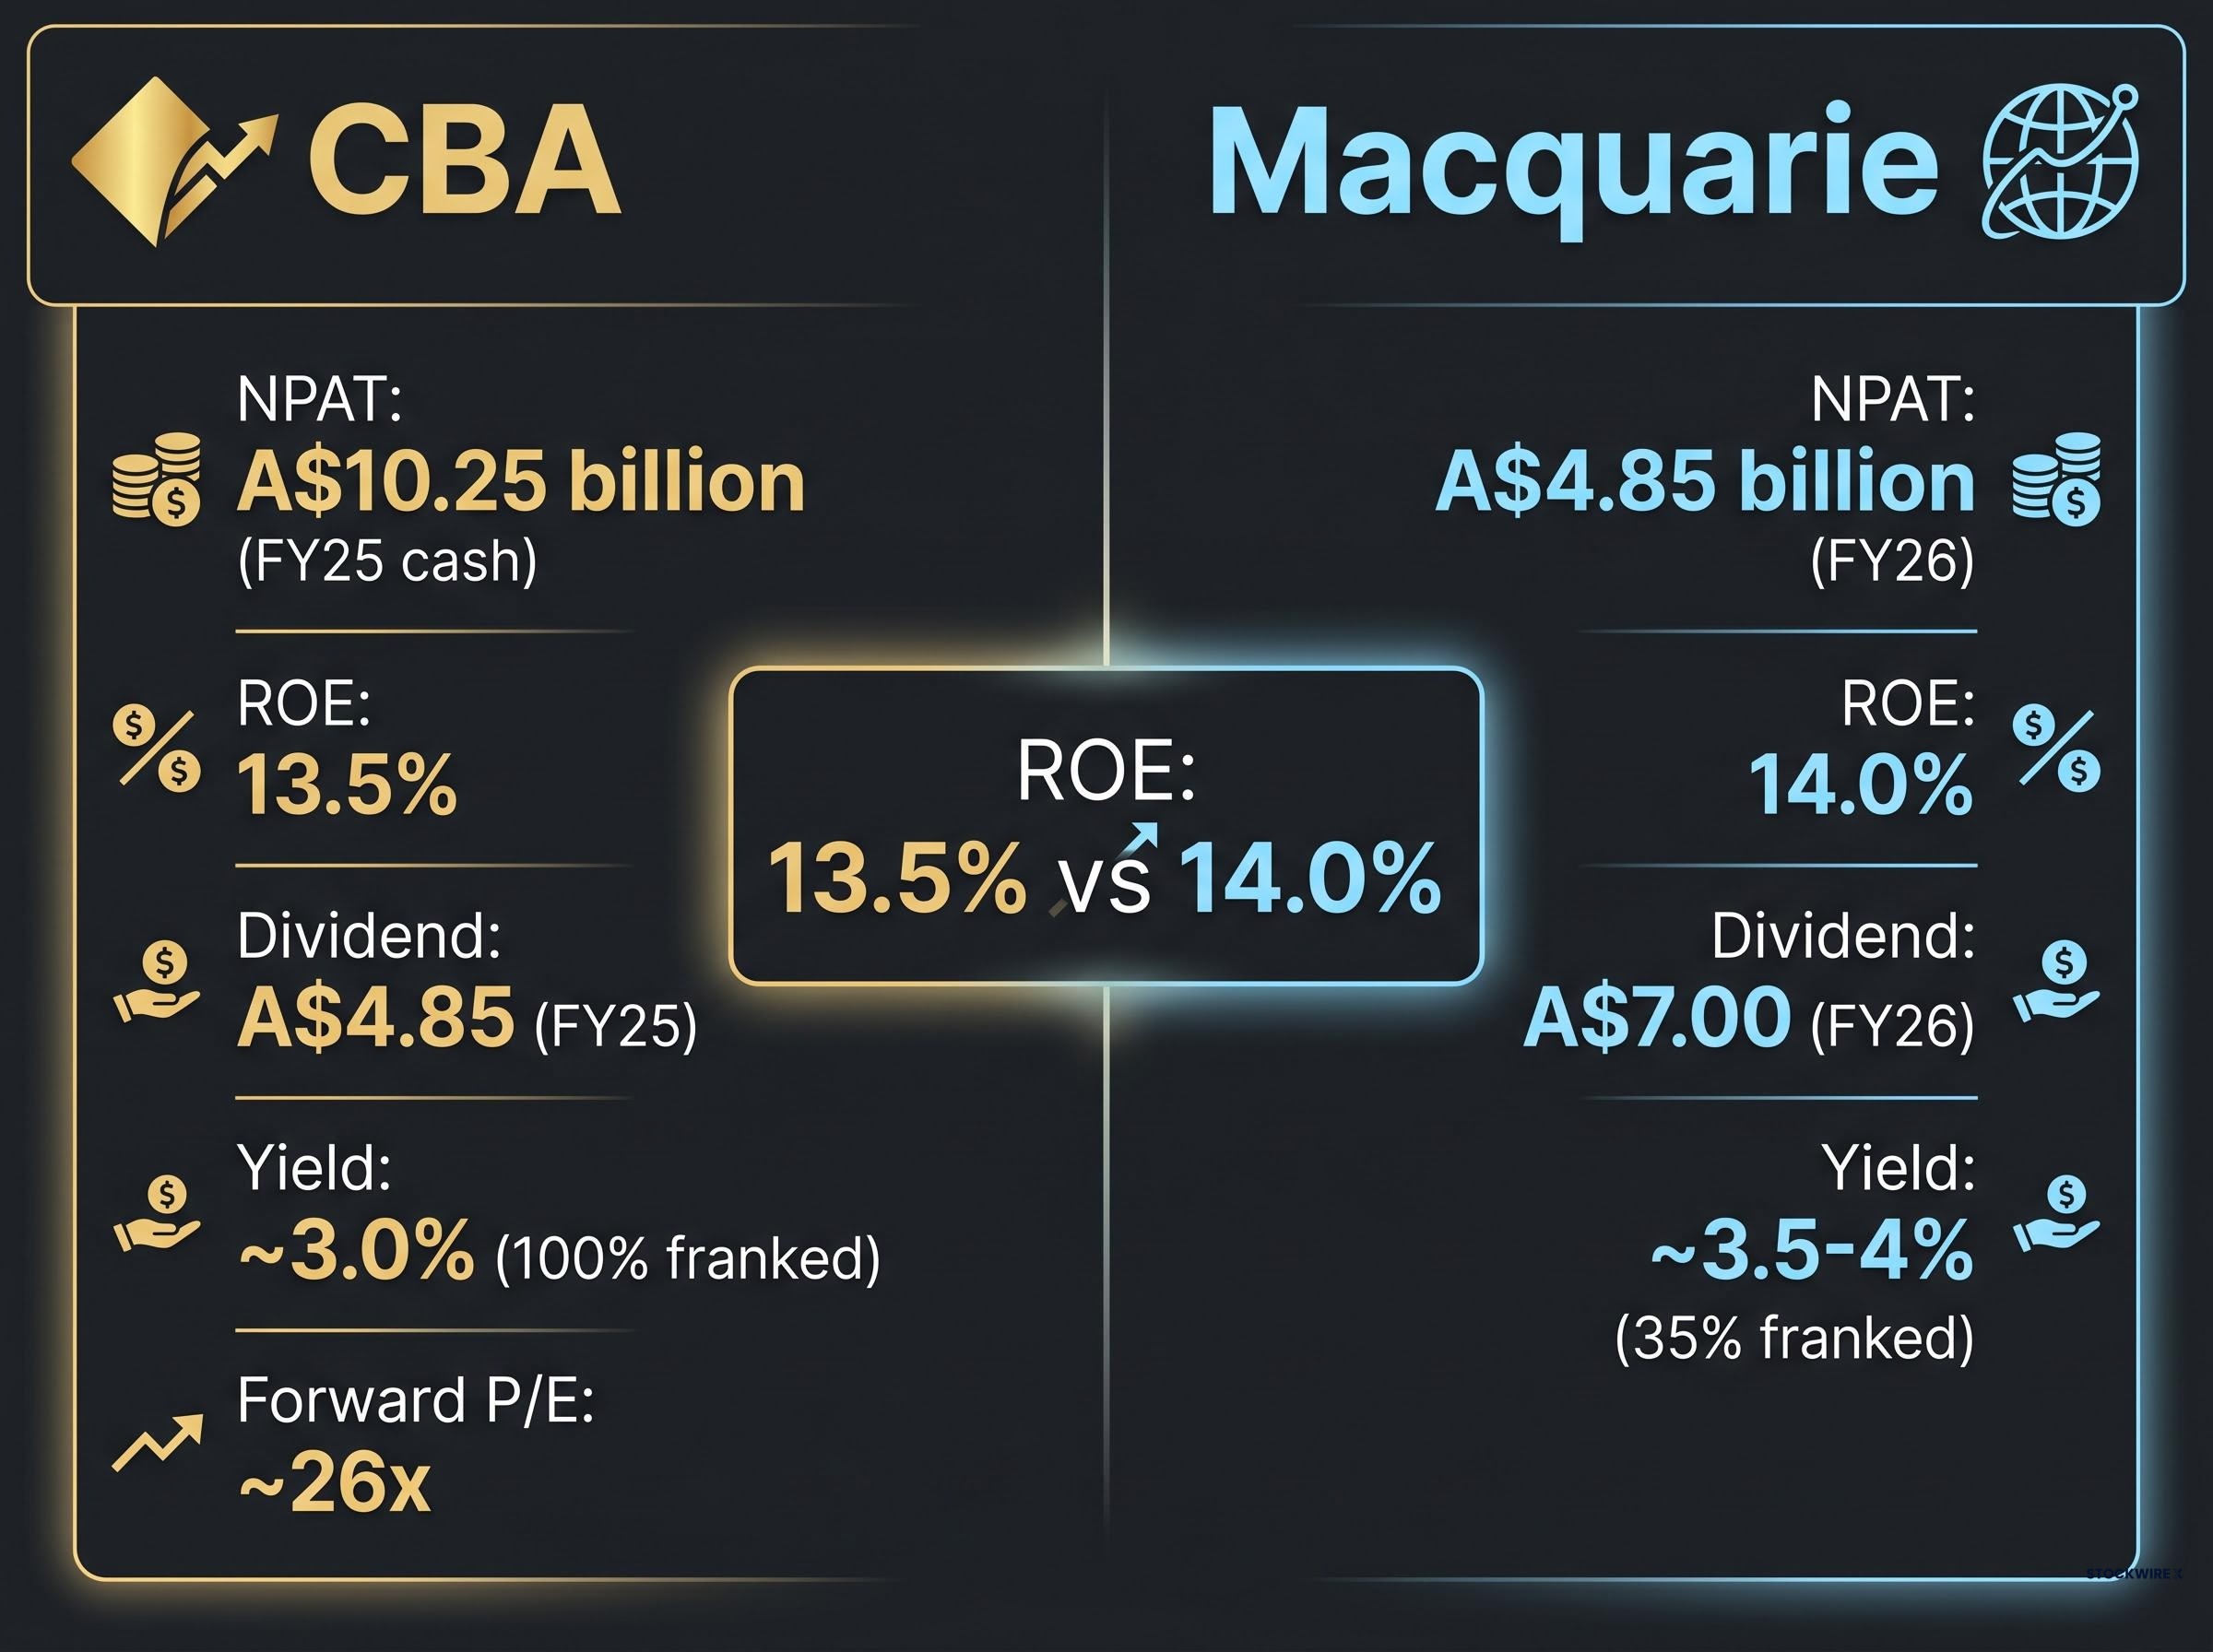
| Metric | CBA | Macquarie |
|---|---|---|
| Latest NPAT | A$10.25 billion (FY25 cash) | A$4.85 billion (FY26) |
| ROE | 13.5% | 14.0% |
| Dividend per share | A$4.85 (FY25) | A$7.00 (FY26) |
| Trailing yield (franking) | ~3.0% (100% franked) | ~3.5-4% (35% franked) |
| Forward P/E | ~26x | Not separately quoted |
The headline yield comparison is misleading without the franking adjustment. CBA’s 3.0% fully franked yield delivers a gross yield of approximately 4.3% for an Australian resident investor in the top marginal tax bracket, once the franking credit is included. Macquarie’s 3.5-4% yield at 35% franking carries a smaller gross-up, narrowing the gap but not eliminating it.
Two companies with near-identical returns on equity, separated by a valuation gap that demands explanation. CBA traded at approximately 20 times forward earnings in early 2025. The step-up to 26 times reflects share price appreciation outpacing earnings growth, not a fundamental re-rating of the business.
CBA’s payout ratio of 79% of cash NPAT limits the capital available for reinvestment. Macquarie retains more of its earnings for deployment into growth opportunities. For investors focused on total return rather than yield alone, this retention difference compounds over time.
The bull case for CBA’s valuation is not without substance. Several analysts, including those at Goldman Sachs and JPMorgan, have partially justified the premium on franchise grounds.
CBA has traded at a 40-50% premium to other major Australian banks (Westpac, ANZ, NAB) on forward price-to-earnings since at least early 2025, and that premium has persisted into late May 2026.
The CBA valuation history makes the current multiple even harder to justify on earnings grounds: CBA’s trailing PE of 26.8x sits nearly 59% above its own 10-year median of 16.88x, a gap that implies the market is pricing in franchise scarcity rather than earnings growth.
The valuation risk is specific and measurable. At 26 times forward earnings, the stock requires a continuation of benign credit conditions, no material NIM compression, and steady market-share strength simply to justify the current price.
The risk is not that CBA is a poorly run institution. It is that at 26 times forward earnings, the margin for disappointment is thin. Any negative earnings surprise produces an outsized price drawdown precisely because the multiple leaves no room for it.
Macquarie’s growth story is best understood not as a static description of what it owns today, but as a pattern of systematic capital rotation toward the next high-return frontier. The FY26 results validated this model. Macquarie Asset Management (MAM) contributions rose 27% on FY25, driven by higher performance fees, confirming the medium-term earnings recovery that analysts had been projecting since the post-Ukraine normalisation period.
The capital deployment since early 2025 illustrates the pattern:
The capital recycling model underpins this activity. Macquarie has been selling or reducing stakes in mature European toll roads and utilities to redeploy into higher-growth energy transition and digital infrastructure assets. Each sale generates realisation profits while freeing capital for new fund launches, creating fee income on the way in and the way out.
Citi has described Macquarie as “a key global beneficiary of decarbonisation and infrastructure build-out.”
NPAT grew from A$3.52 billion (FY24) to A$3.72 billion (FY25) to A$4.85 billion (FY26). The earnings recovery trajectory is real, and the global themes driving it, infrastructure build-out, decarbonisation, digital infrastructure, carry multi-decade runways with limited sensitivity to the Australian domestic cycle.
Macquarie’s FY26 earnings recovery came with a notable operating leverage signal: revenue grew 13% while operating costs rose only 5%, a dynamic that explains the ROE re-rating to 14% and distinguishes the profit expansion from a simple cyclical rebound in commodity markets.
Both stocks carry risks that deserve weight before any allocation decision, and neither is the “safe” option investors might assume.
CBA risks:
APRA’s APS 112 capital adequacy standard sets the specific risk weights applied to residential mortgage exposures, establishing the regulatory floor that determines how much capital CBA must hold against its dominant home lending book and placing a structural ceiling on the return on equity the franchise can generate.
Macquarie risks:
| Risk category | CBA | Macquarie |
|---|---|---|
| Valuation risk | High: ~26x forward P/E leaves no margin for disappointment | Moderate: earnings recovery trajectory not fully priced |
| Earnings stability | High predictability, low variance | Lumpy: performance fees and deal cycles create variability |
| Income (dividend/franking) | ~3.0% fully franked; strong gross yield | ~3.5-4% partially franked (35%); lower gross-up |
| Macro sensitivity | Australian housing, RBA rates, domestic credit | Global infrastructure deal flow, institutional appetite |
These risks are not symmetric. CBA’s risk is concentrated in valuation and the domestic cycle. Macquarie’s risk is concentrated in earnings timing and global market conditions. The investor who assumes CBA is inherently safer is conflating business quality with investment risk at the current entry point.
For long-term investors with a higher tolerance for earnings variability, Macquarie’s global growth pathways and more reasonable implied valuation offer superior return potential from current prices. Analysis from the Motley Fool Australia (30 May 2026) reached the same conclusion, citing the breadth of Macquarie’s growth pathways as the deciding factor.
The two stocks are not mutually exclusive. They can serve complementary roles within a diversified ASX financials allocation. The question is which role each one plays.
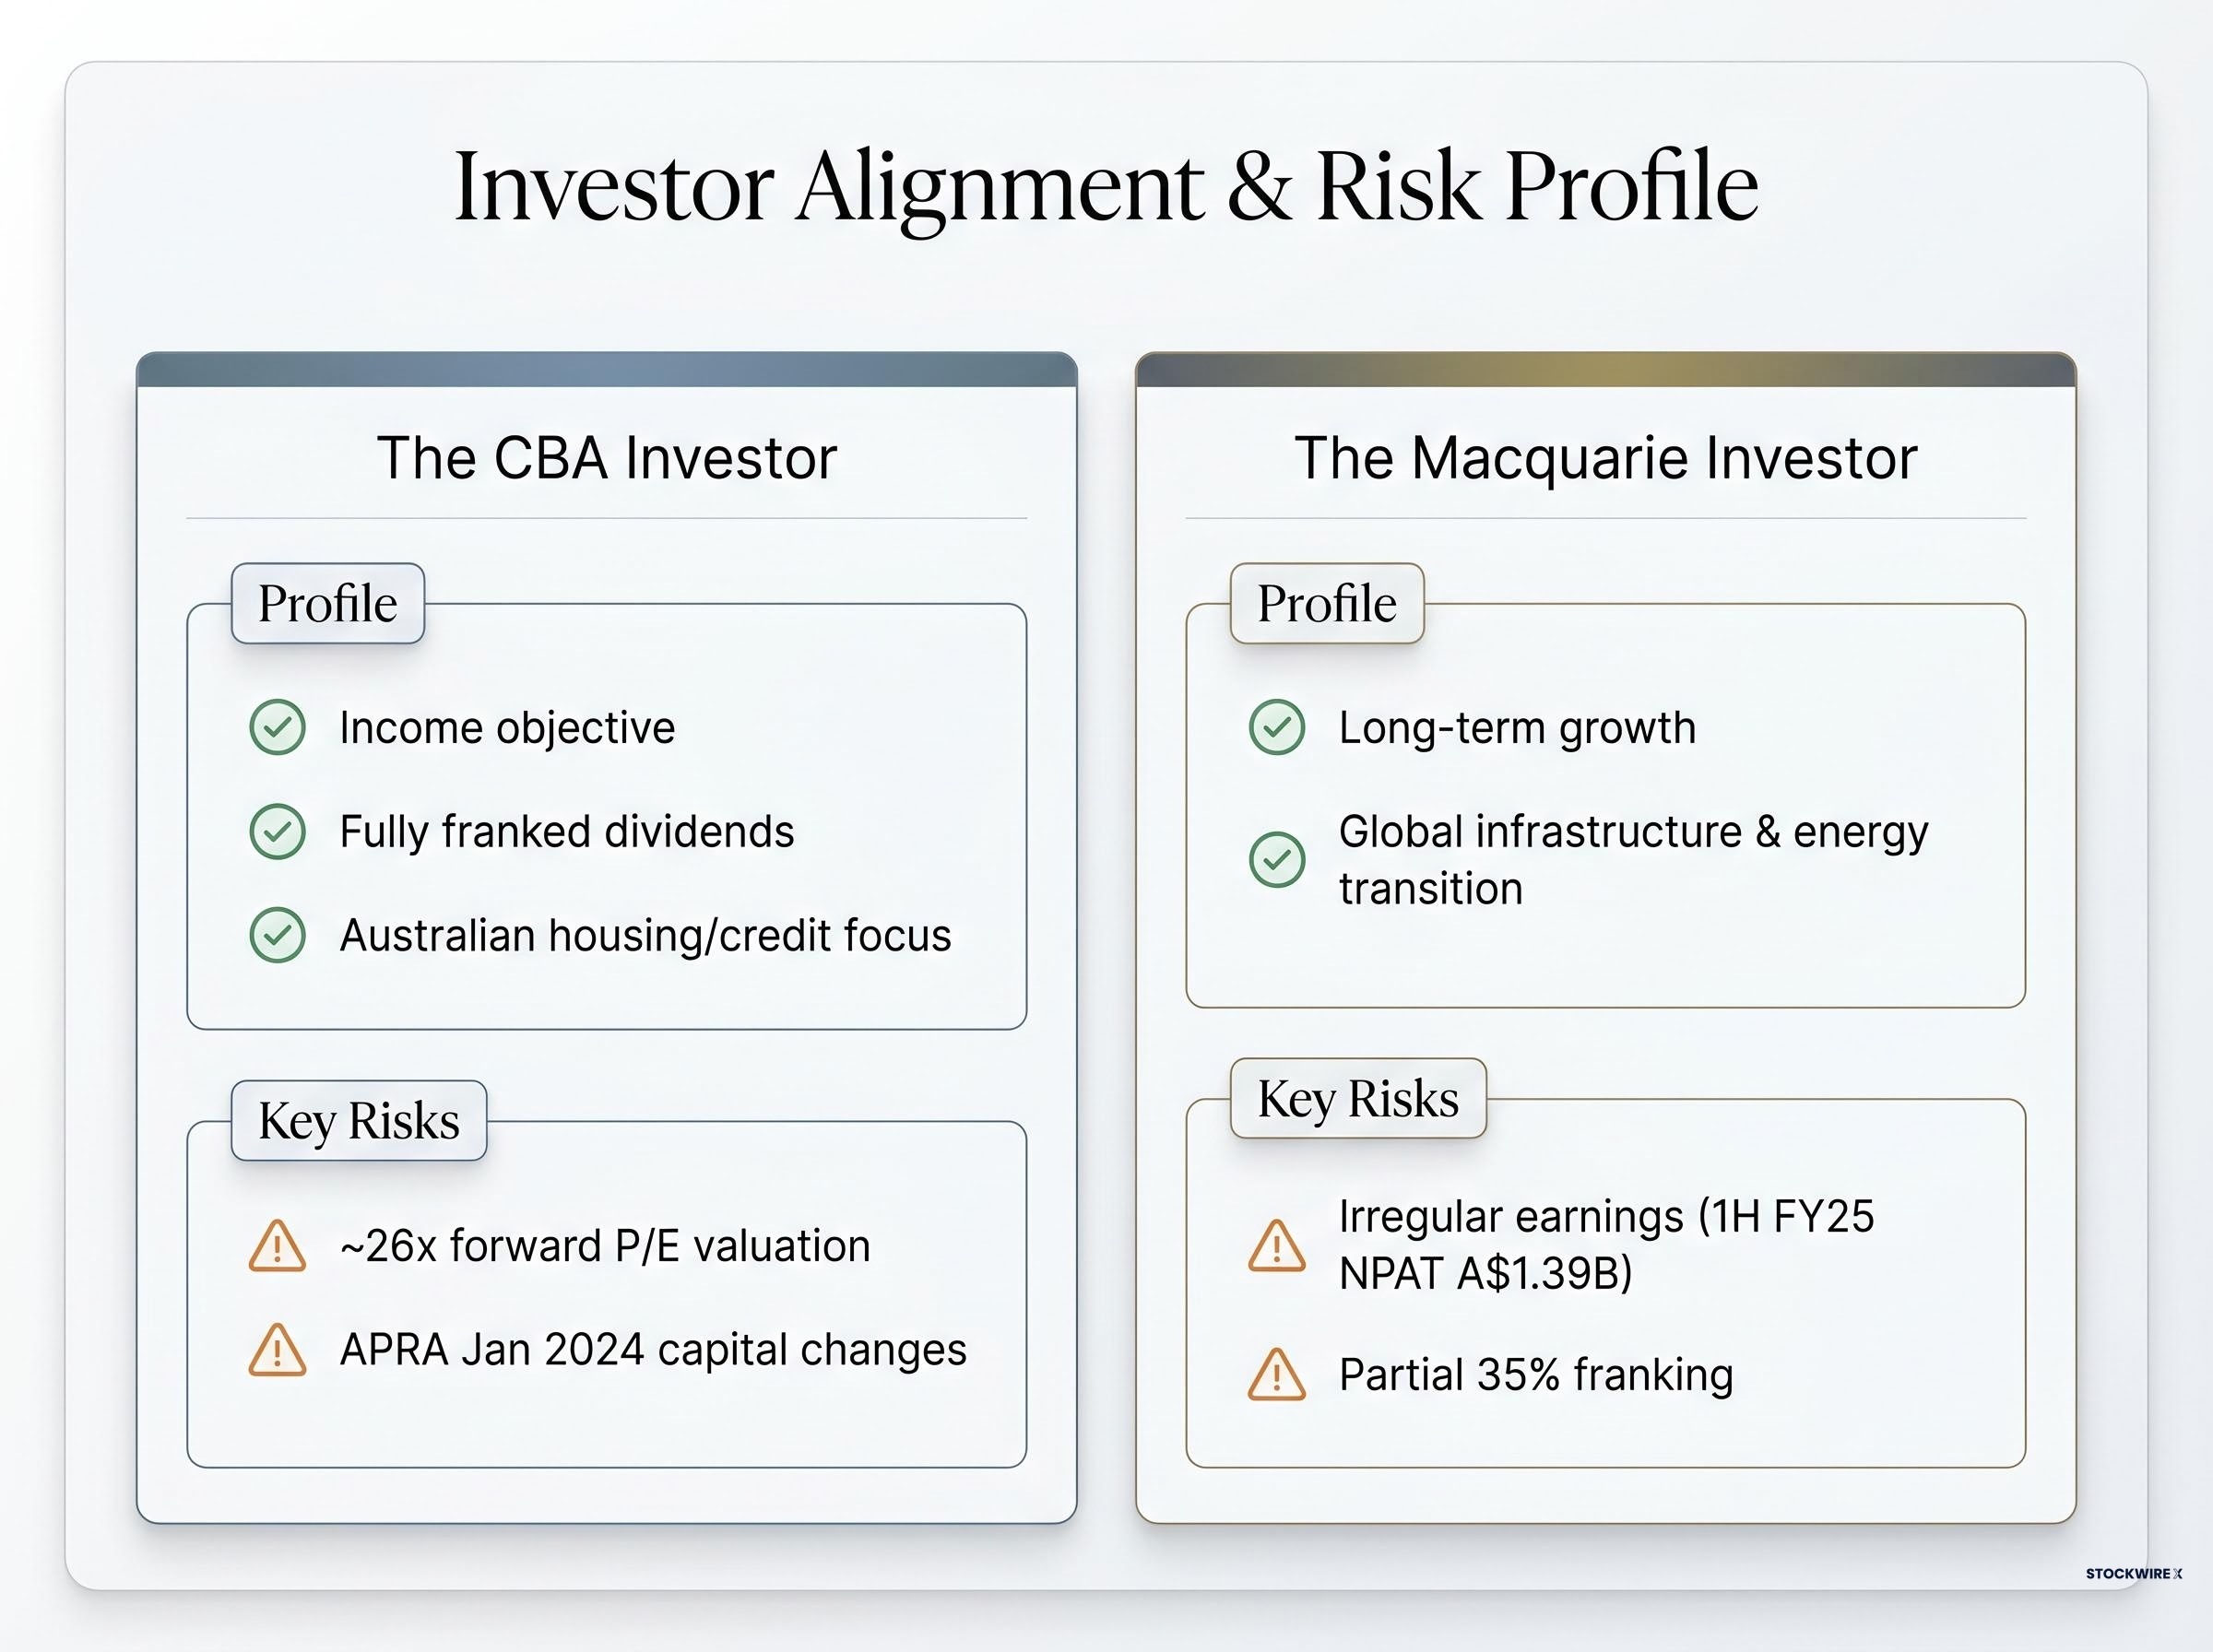
Both CBA and Macquarie are high-quality businesses. Both generate returns on equity above 13%. Both have delivered consistent capital returns across cycles. Quality is not what separates them as investments from the current entry point.
At approximately 26 times forward earnings, CBA’s quality is reflected in the price. The franchise strengths are real, but they are already capitalised. At Macquarie’s current pricing, the earnings recovery trajectory and global growth optionality are not fully priced in, offering a wider margin for the investment to outperform.
The principle extends beyond these two stocks: quality and prospective return are not the same thing. The best company is not always the best investment at any given price. Australian investors holding CBA would benefit from asking a specific question: is CBA in the portfolio by deliberate choice, or by default?
For investors who want to go beyond the headline PE comparisons covered here, our dedicated guide to stress-testing bank stock valuations walks through dividend discount models, CET1 capital adequacy checks, and 90-day arrears thresholds as a structured framework for deciding whether any entry price is defensible.
This article is for informational purposes only and should not be considered financial advice. Investors should conduct their own research and consult with financial professionals before making investment decisions. Past performance does not guarantee future results.
CBA is a domestically focused retail bank offering predictable, fully franked income, while Macquarie is a globally diversified financial group with earnings driven by infrastructure, energy transition, and asset management, making them structurally different bets despite similar returns on equity.
CBA's trailing PE of approximately 26.8x sits nearly 59% above its own 10-year median of 16.88x, a gap analysts at Morgan Stanley and Citi argue reflects franchise scarcity pricing rather than accelerating earnings growth.
CBA's 3.0% fully franked dividend grosses up to approximately 4.3% for a top-marginal-rate Australian investor, while Macquarie's 3.5-4% yield carries only 35% franking, meaning the after-tax income gap between the two is narrower than the headline yields suggest.
Macquarie's FY26 net profit rose to A$4.85 billion, driven by a 27% surge in Macquarie Asset Management contributions from higher performance fees, along with strong capital recycling into infrastructure and energy transition assets globally.
At approximately 26 times forward earnings, CBA carries high valuation risk, meaning any earnings miss or NIM compression could produce an outsized price decline, and its earnings are heavily exposed to Australian housing market conditions and RBA rate decisions.