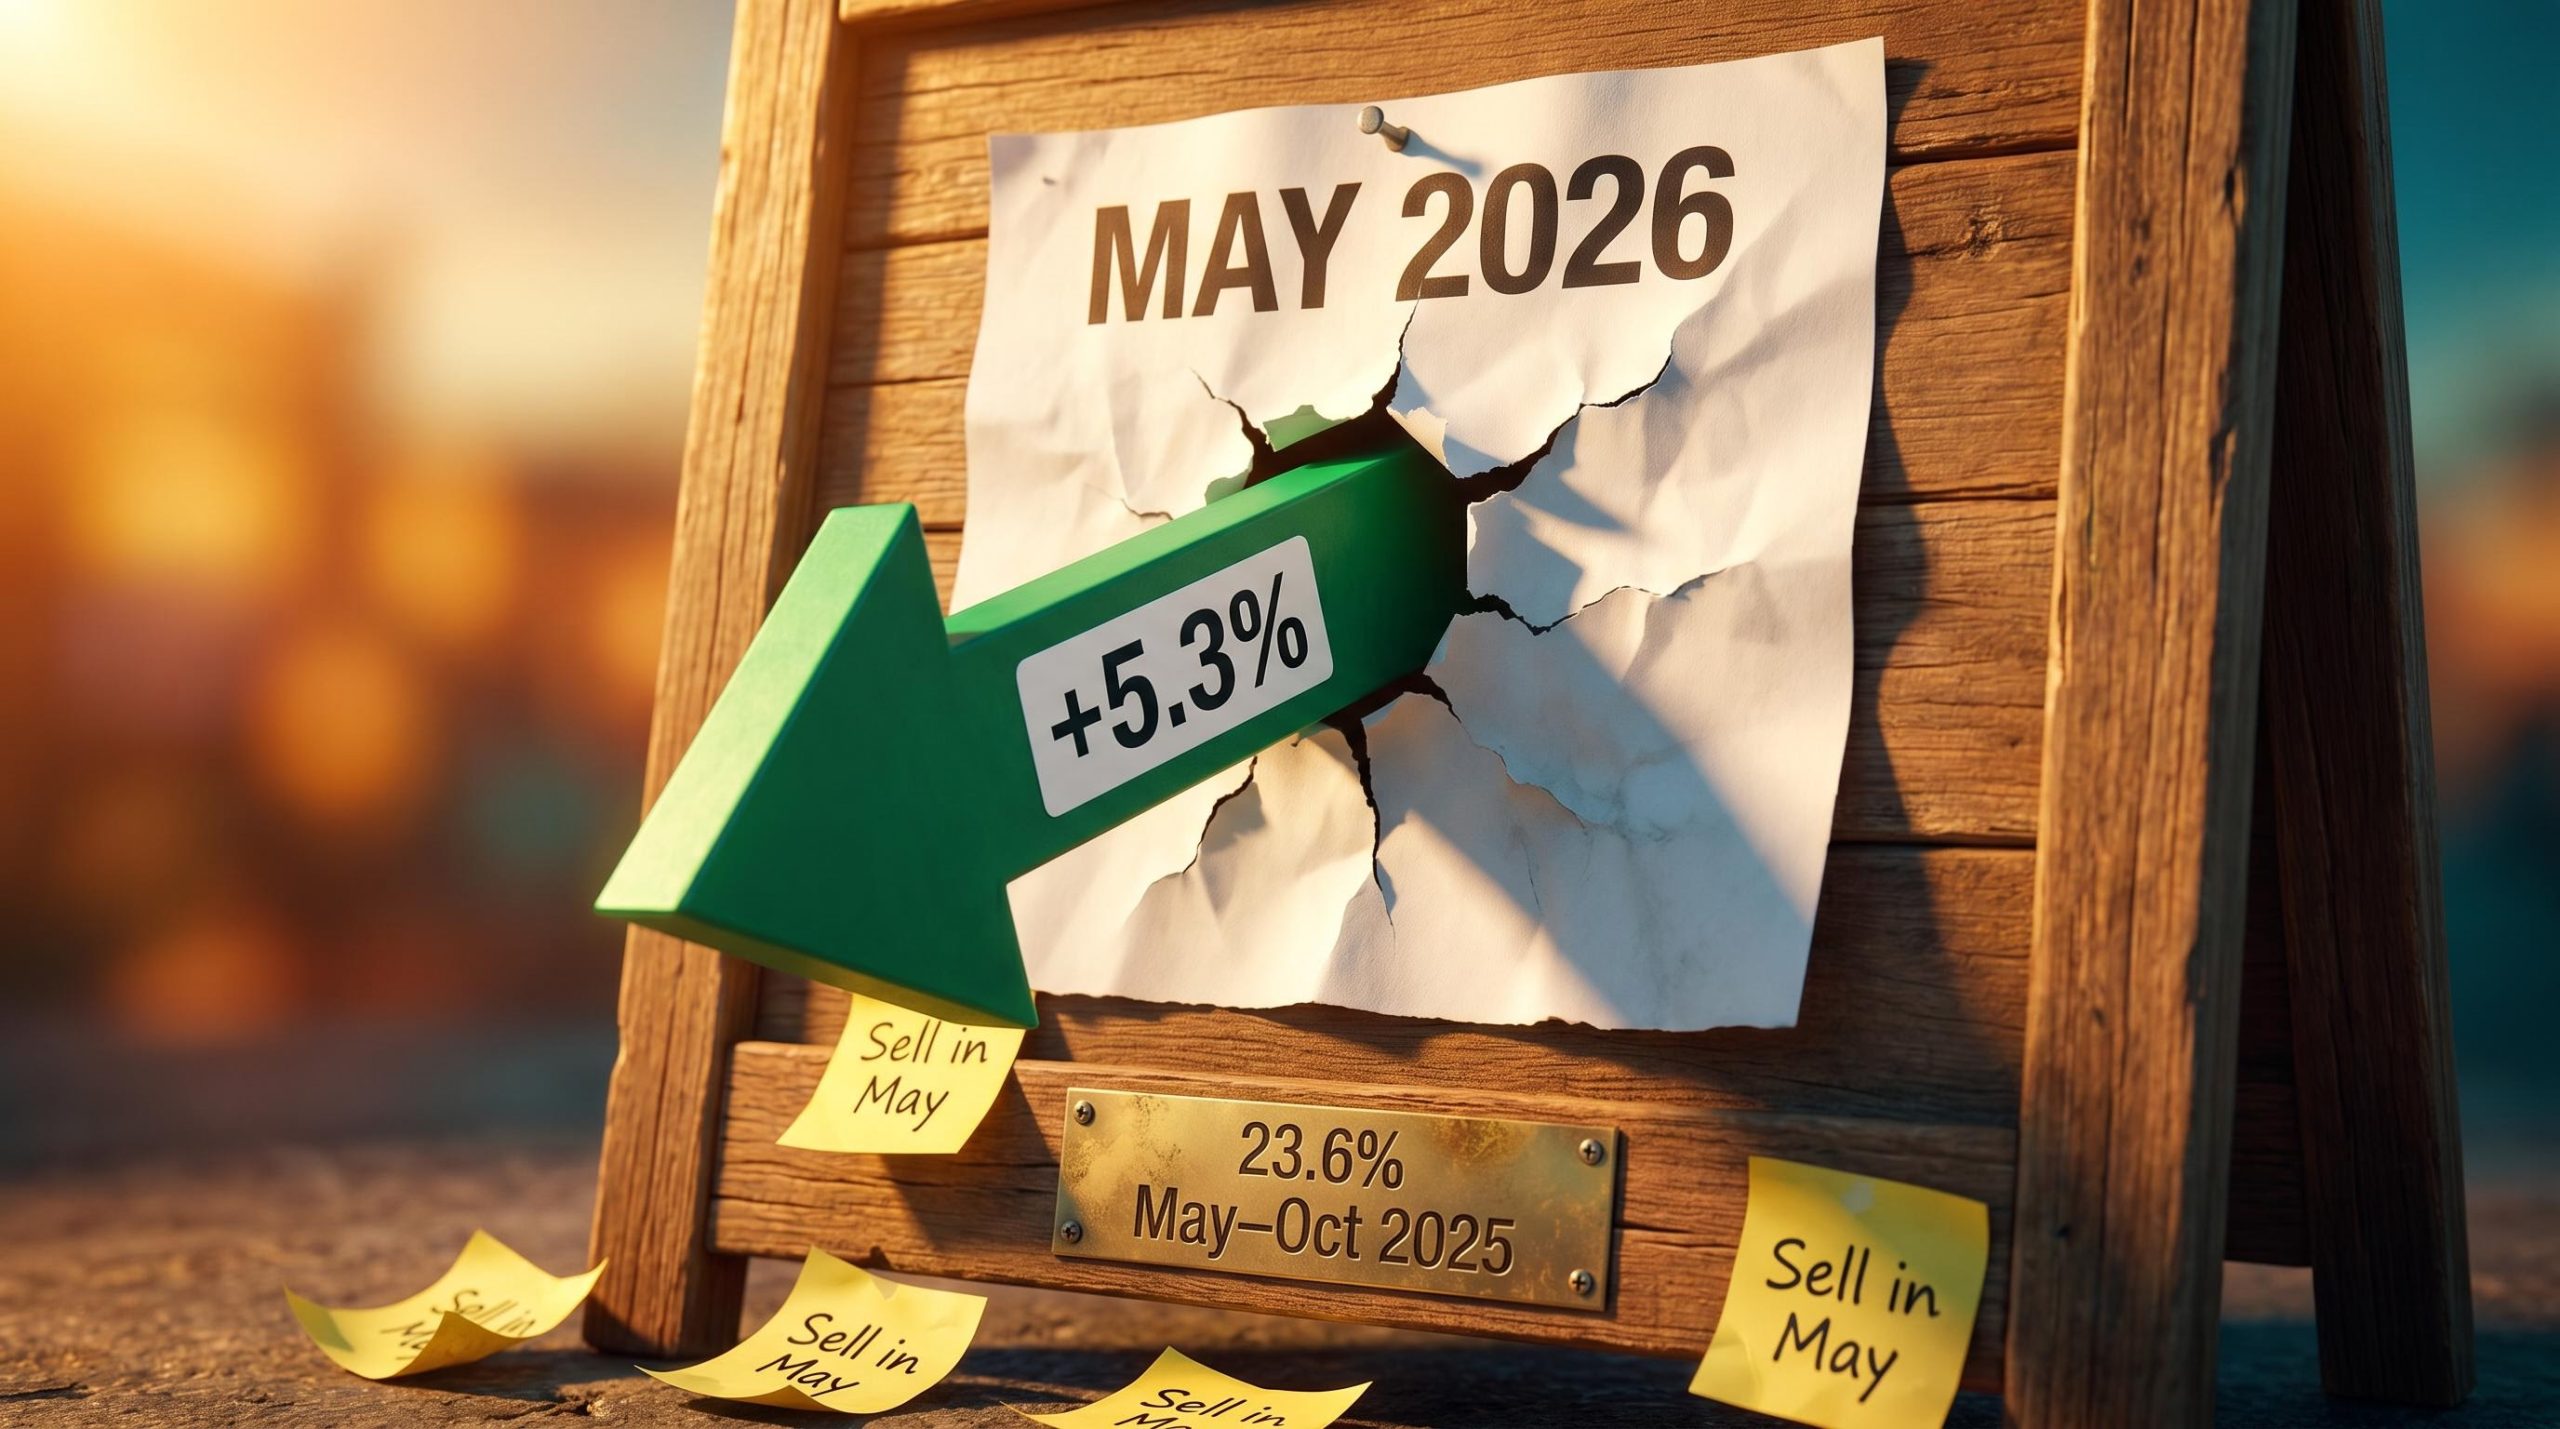
The S&P 500 returned 5.3% in May 2026, its best performance against the long-run monthly average in modern market history, at the precise moment the seasonal exit window opened. The adage known as “Sell in May and Go Away” instructs investors to exit equities at the end of April and return in November, yet the market instead delivered a new all-time high. This is the second consecutive year the strategy would have cost investors significantly: the full May through October 2025 window returned 23.6%, per Finaeon, Inc.
What follows examines what two consecutive years of contradictory evidence mean for investors deciding right now whether to reduce equity exposure for the summer, and why attempting to recoup missed gains typically requires accepting more risk, not less.
May 2026 just broke the seasonal script at its first line
The gap between what the seasonal rule predicted and what actually happened is not a matter of degree. It is a matter of kind.
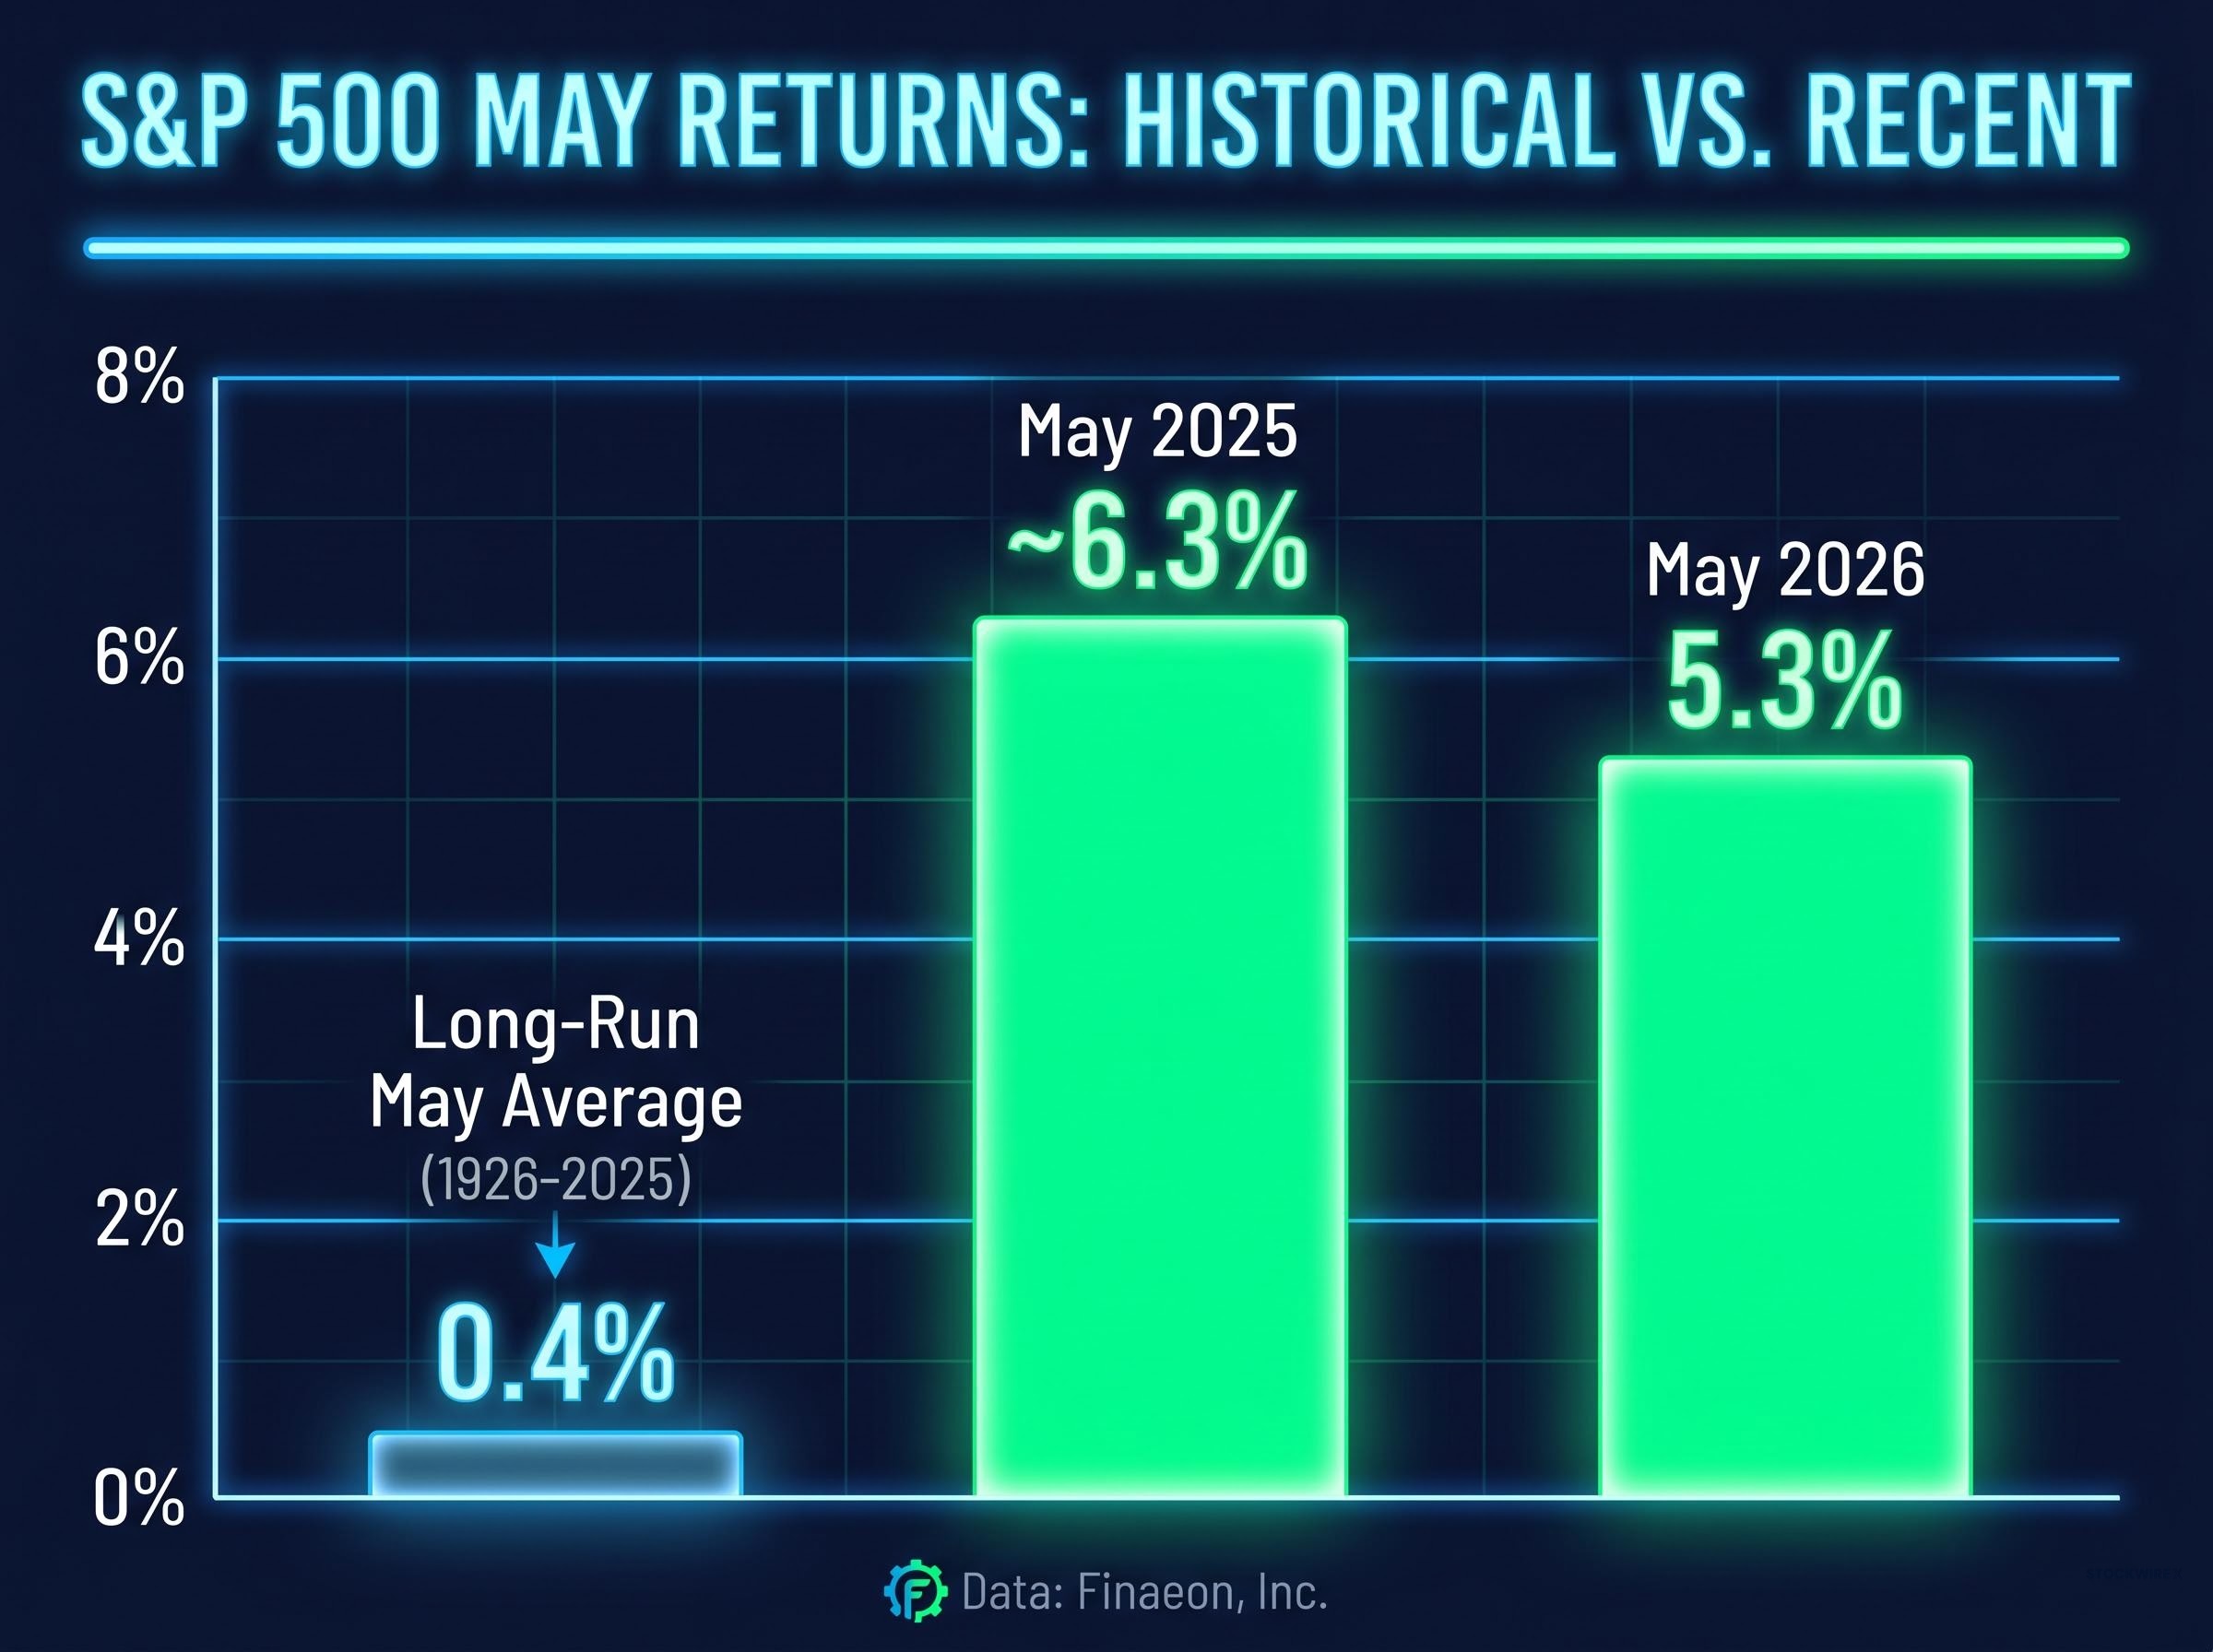
The S&P 500 returned 5.3% in May 2026, against a long-run May average of just 0.4%.
That 0.4% figure covers nearly a century of data, from 1926 through 2025, per Finaeon, Inc. The May 2026 gain exceeded it by more than thirteen times, and it arrived during the exact calendar window the strategy says investors should be sitting in cash or bonds.
The index closed May at a new all-time high, making this not merely an above-average month but a record-setting one. The gains followed a recovery from earlier-year volatility linked to the Iran conflict and elevated oil prices, a pattern that will matter when the structural explanation arrives in the sections below.
The record-setting May close also followed a notable concentration story: market breadth in April 2026 revealed that only 23% of S&P 500 constituents outperformed the benchmark they compose, meaning the headline index gains were driven by a narrow cohort of mega-cap stocks rather than broad participation across the market.
For any investor who reduced equity exposure in late April following the seasonal rule, the cost is already concrete: 5.3% of foregone return in a single month, before the summer has properly started.
When big ASX news breaks, our subscribers know first
Last year told the same story, and investors still had to live with it
May 2026 is not an isolated anomaly. The same script played out twelve months earlier, and the cost was larger.
The S&P 500 returned approximately 6.3% in May 2025 alone, per Finaeon, Inc. Over the complete April 30 through October 31, 2025 period, the index gained 23.6%, a figure that dwarfs the historical average for the May through October window.
The context matters. A sharp market decline in early April 2025 following Liberation Day tariff developments meant the seasonal window opened at a temporary low, which amplified the recovery gain. Investors who exited at the end of April sold into weakness, then watched the market recover without them.
| Year | May Return | Full May-Oct Return | Long-Run May Average |
|---|---|---|---|
| 2025 | ~6.3% | 23.6% | 0.4% |
| 2026 | 5.3% | Window still open | 0.4% |
The structural point is worth making explicit: both the 2025 and 2026 seasonal windows opened immediately after market dislocations. These are exactly the moments when exiting concentrates the cost, because the recovery potential is largest just as the seasonal rule says to leave.
A single anomalous year can be dismissed as bad luck. Two consecutive years of large opportunity costs force a closer examination of whether the rule has a structural weakness worth understanding.
What “Sell in May” actually means, and why it keeps failing when markets need a recovery
The adage itself is straightforward. Exit equities at the end of April. Hold cash or bonds through October. Re-enter in November.
The instruction rests on a real historical observation: the November through April window has, on average, outperformed the May through October window over long stretches of market history. The 0.4% average May return reflects this; the strategy is not fabricated from nothing. It has a genuine statistical root.
The academic research on the Halloween indicator, which formalises the statistical basis for the November through April outperformance cycle, confirms that the seasonal effect is real in historical data while also demonstrating that the distribution of outcomes across individual years is wide enough to make rule-based exits unreliable for timing any specific summer window.
The flaw is not in the averages. It is in the distribution. The strategy’s cost is not spread evenly across years. It concentrates in years when markets have just experienced a sharp selloff entering May, precisely when recovery potential is largest and when following the rule is most expensive.
Three structural conditions make the seasonal exit most costly:
- The market enters May following a recent sharp decline
- The recovery from that decline extends through the summer months
- The investor exits before the recovery becomes visible in the data
Both 2025 and 2026 met all three conditions. The adage does not account for them, because it treats every May identically regardless of what happened in March and April.
The structural case for staying invested through the 2026 summer window is reinforced by a separate historical pattern: post-midterm election returns have historically been above average in the 12 months following midterm cycles, with the anticipated legislative gridlock from November 2026 viewed by institutional analysts as compressing the policy risk premium priced into equities.
The real cost is not just the missed gain; it is what investors have to do to get back on track
Missing a 5.3% gain in one month means the investor now needs a return greater than 5.3% on whatever they held in its place just to break even. That recovery typically demands accepting elevated risk, not less.
The cost of missed gains compounds through the risk required to recover them.
The escalation logic is particularly steep for investors who also followed the strategy in 2025. Missing the 23.6% full-window gain creates a recovery task that may push portfolios toward concentrated positions or leverage, both of which amplify downside as much as upside.
Three risk pathways commonly emerge when investors attempt to recover missed gains:
- Concentrated single-stock or sector bets designed to generate outsized returns quickly
- Leveraged ETFs that magnify daily moves in both directions
- Late-cycle re-entry at elevated valuations, when the risk-reward balance has shifted
Institutional research from firms including Vanguard, Fidelity, BlackRock, and Schwab has consistently demonstrated that missing a small number of the market’s best days significantly reduces long-run compounding, a principle that applies directly to seasonal exit strategies.
Fidelity research on missing the market’s best days quantifies the compounding damage precisely: missing just five of the best single-day gains over a multi-decade period can reduce a long-term portfolio by approximately one-third, a finding that gives concrete weight to the opportunity cost framework that seasonal exit strategies create.
The current 2026 environment adds a further consideration. Elevated US equity valuations relative to developed markets in Europe and Asia create an additional risk factor for investors who increase US equity exposure aggressively to catch up. The attempt to recover missed gains may itself introduce new vulnerabilities.
This article is for informational purposes only and should not be considered financial advice. Investors should conduct their own research and consult with financial professionals before making investment decisions.
Two years of data inside the window investors are now deciding whether to exit
As of 30 May 2026, the seasonal window is open. The May through October period is underway, and investors are actively deciding whether to reduce equity exposure for the summer months. This evidence is not retrospective; it applies to a live decision.
Two consecutive years in which the seasonal exit strategy produced large opportunity costs does not guarantee the same outcome through October 2026. Markets could weaken from here. The summer could deliver the poor returns the adage predicts.
Ken Fisher’s May 2026 assessment adds a separate dimension to this picture: his characterisation of the current environment as early-stage bull market euphoria, the fourth phase of Templeton’s sentiment model, places a potential cycle conclusion two or more years away, a timeline that cuts directly against the seasonal exit logic for investors deciding right now.
What the data does make concrete is the cost of being wrong. May 2026 returned 5.3%. The full May through October 2025 window returned 23.6%. These are not marginal differences from a buy-and-hold approach; they are the kind of gaps that reshape long-term compounding.
The cost of seasonal timing tends to be highest in the years it is hardest to predict, which is every year.
Markets trend upward over time. Downturns are temporary. The primary risk of seasonal timing is not that it always fails, but that when it fails, it tends to fail at the moments of maximum cost.
The pattern does not guarantee summer gains, but ignoring it costs the same either way
Two years of contradictory evidence does not prove the adage will fail every year. The historical November through April outperformance is real, and the May through October period will sometimes deliver weak returns. That possibility has not been eliminated.
The uncertainty itself, however, is the problem with seasonal timing. Investors who exit do not know in advance whether they are leaving during a weak year, where the cost is minimal, or a strong recovery year, where the cost is enormous. The distribution of outcomes is what makes the strategy unreliable, not the average.
Staying invested through volatility means accepting temporary declines as the price of long-run participation. Attempting to sidestep those declines through seasonal exits creates the risk of missing the recoveries that follow them. Two consecutive years have now demonstrated what that risk looks like when it materialises: 5.3% in a single month, 23.6% across a full window.
Investors exploring the alternative to seasonal timing, staying invested while managing downside exposure structurally rather than through calendar exits, will find our full explainer on defensive investing covers the loss-avoidance arithmetic in detail, including why a pension fund that never ranked in the top quarter in any single year over 14 years still finished in the top 4% of all funds.
Past performance does not guarantee future results. Financial projections are subject to market conditions and various risk factors.