The United States government is currently spending approximately $2.6 billion every single day just to service its existing debt. That figure does not fund a single road, hospital, or defence contract. It pays interest. With total national debt now approaching $39 trillion and the Congressional Budget Office (CBO) projecting net interest outlays of roughly $952 billion for FY2025, the mechanics of US borrowing have moved from a background fiscal concern to a front-line force shaping equity valuations, mortgage costs, and corporate investment decisions. Several of the world’s most prominent economists have used the phrase “debt spiral” with increasing specificity in their public commentary over the past two years. What follows explains precisely how the accumulation of government debt raises borrowing costs across the entire economy, why that matters for investors in equities and not just bonds, and what the transmission mechanism looks like from a Treasury auction through to a monthly mortgage payment.
How the US government borrows $39 trillion into existence
Every week, the US Treasury holds auctions. The mechanics are unremarkable: the department announces an offering, buyers submit bids, and the government receives cash in exchange for a promise to repay principal plus interest on a fixed schedule. The buyers span banks, pension funds, insurance companies, foreign governments, and private individuals.
What makes the process consequential is the scale. The annual gap between what the federal government spends and what it collects in revenue, the budget deficit, adds to a cumulative total that has climbed sharply:
- Early 2025: approximately $36.2 trillion
- End of FY2025 (30 September 2025): approximately $37.6 trillion
- Year-end 2025: approximately $38.5 trillion
- Late May 2026: approximately $39.1 trillion, per the US Treasury’s daily “Debt to the Penny” report
Daily interest cost: approximately $2.6 billion per day in FY2025, before any principal repayments, derived from the CBO’s projected $952 billion annual net interest figure.
The CBO’s January 2025 outlook placed that $952 billion at roughly 3.2% of GDP, up from approximately $870 billion in FY2024. Interest has become one of the fastest-growing federal outlays.
The CBO’s January 2025 budget outlook projects net interest costs rising from 3.2% of GDP in FY2025 to 4.1% of GDP by 2035, with debt held by the public climbing from 100% of GDP to 118% over the same period, a trajectory that frames the structural compression of fiscal space discussed throughout this analysis.
The rolling-over problem
A large portion of US debt sits in short-duration Treasury bills with maturities of six, twelve, and eighteen months. These instruments do not sit quietly on a balance sheet until some distant maturity date. They expire and must be refinanced, a process known as rolling over the debt.
This creates continuous refinancing pressure. Each time the Treasury returns to market, it is asking buyers to set a new price for that borrowing at prevailing yields. As the total debt base grows, each refinancing cycle reprices a larger absolute dollar figure. The government is not borrowing once and walking away; it is perpetually returning to market, and the market sets terms every time.
When big ASX news breaks, our subscribers know first
What a debt spiral actually means in fiscal terms
The phrase “debt spiral” describes a specific self-reinforcing feedback loop. When interest costs grow faster than government revenues or GDP, the government must borrow additional funds to cover interest on existing debt. That additional borrowing increases the total debt base, which in turn increases future interest costs, which requires further borrowing.
This is not a hypothetical edge case. It is a present operational reality.
| Fiscal Year | Net Interest Outlays | Approximate GDP Share |
|---|---|---|
| FY2024 | ~$870 billion | ~3.0% |
| FY2025 | ~$952 billion | ~3.2% |
As more GDP is directed toward interest service, discretionary spending on healthcare, infrastructure, and defence faces structural compression. Economists refer to this as crowding out: interest payments consume fiscal space that might otherwise fund investment or respond to economic downturns.
Fiscal affordability metrics matter here because the GDP share figures in that table, while striking, compare a stock of debt to an annual flow of economic output rather than to the government revenue that actually services it; interest payments at roughly 18.5% of US tax revenue in FY2025 tell a more precise story about debt-service capacity than any debt-to-GDP ratio alone.
Federal Reserve Chair Jerome Powell, in testimony to the Senate Banking Committee on 7 March 2024, stated that the US is on an “unsustainable fiscal path” with debt growing faster than the economy.
Named economists have been increasingly direct about the trajectory:
- Jason Furman, Harvard University, writing in the Wall Street Journal on 18 September 2024, warned that “a few more years of large primary deficits could lock the United States into a debt-interest spiral” forcing abrupt fiscal tightening.
- Maya MacGuineas, Committee for a Responsible Federal Budget, in October 2024, described the fiscal outlook as “frightening” and noted that interest costs would soon exceed defence spending.
- Michael Peterson, Peter G. Peterson Foundation, in early 2024, warned that the US is in a “debt spiral risk zone” with a growing share of tax revenue going to interest rather than investment.
The policy responses this dynamic eventually forces, whether abrupt spending cuts, tax increases, or monetisation through the Federal Reserve, each carry distinct implications for equity markets, inflation expectations, and the real cost of capital.
The bond market as a price-setter for the entire economy
Equity markets tend to dominate financial headlines. Bond markets set the price of money itself. Understanding this hierarchy is the single most useful framework for interpreting how government debt dynamics reach into portfolio valuations and household budgets alike.
Government bonds are treated as the baseline return instrument in financial markets. Because sovereign default in a currency-issuing nation is considered negligible, the yield on government bonds functions as the risk-free rate: the minimum return an investor can expect for lending money with near-zero credit risk.
Every other asset class is priced relative to this foundation. The additional return that equities must offer above the risk-free rate to compensate investors for higher risk is known as the equity risk premium. When the risk-free rate rises, the premium demanded for equities must either widen (meaning stock prices fall to offer higher expected returns) or compress (meaning investors accept less compensation for risk).
The mechanism operates in three steps:
- Treasury yields rise as the government borrows more or as the Federal Reserve holds rates higher for longer.
- The discount rate applied to future corporate earnings rises in tandem, because the risk-free rate is the starting point of every discounted cash flow calculation.
- The present value of those future earnings falls, compressing the price investors are willing to pay for stocks today.
A Goldman Sachs equity strategy note, reported by Reuters on 12 February 2025, found that with the 10-year Treasury yield around 4.2-4.3%, the equity risk premium on the S&P 500 had compressed to near multi-decade lows. That compression implies less cushion against earnings disappointments and a cap on further multiple expansion.
Bank of America strategists, cited in the Financial Times on 27 January 2025, observed that “T-bills and 10-year notes now compete directly with equities for capital,” encouraging more balanced allocations after years of equity dominance.
As Bloomberg News reported on 19 October 2024, institutional investors were reallocating from equities into Treasuries as the 10-year approached 5%, with one chief investment officer noting that “for the first time in years, you can earn 5% in government bonds, so the equity risk premium looks much thinner.”
Why growth stocks feel this most acutely
Growth stocks are long-duration assets. Their valuations rest heavily on earnings projected years or decades into the future. When a higher discount rate is applied to those distant cash flows, the present value compression is more severe than for value or dividend-paying stocks with near-term cash flows.
The Wall Street Journal reported on 3 November 2024 that higher long-term yields had driven a rotation into value and dividend-paying stocks, as investors applied steeper discount rates and favoured companies already generating cash over those promising future returns.
From Treasury yields to your mortgage, credit card, and car loan
The transmission from government bond yields to household borrowing costs is not theoretical. It is documented in specific dollar figures across every major consumer credit category.
On a typical $400,000 mortgage, monthly payments were roughly $800 higher than when rates were near 3% in 2021, according to the Wall Street Journal on 10 October 2024.
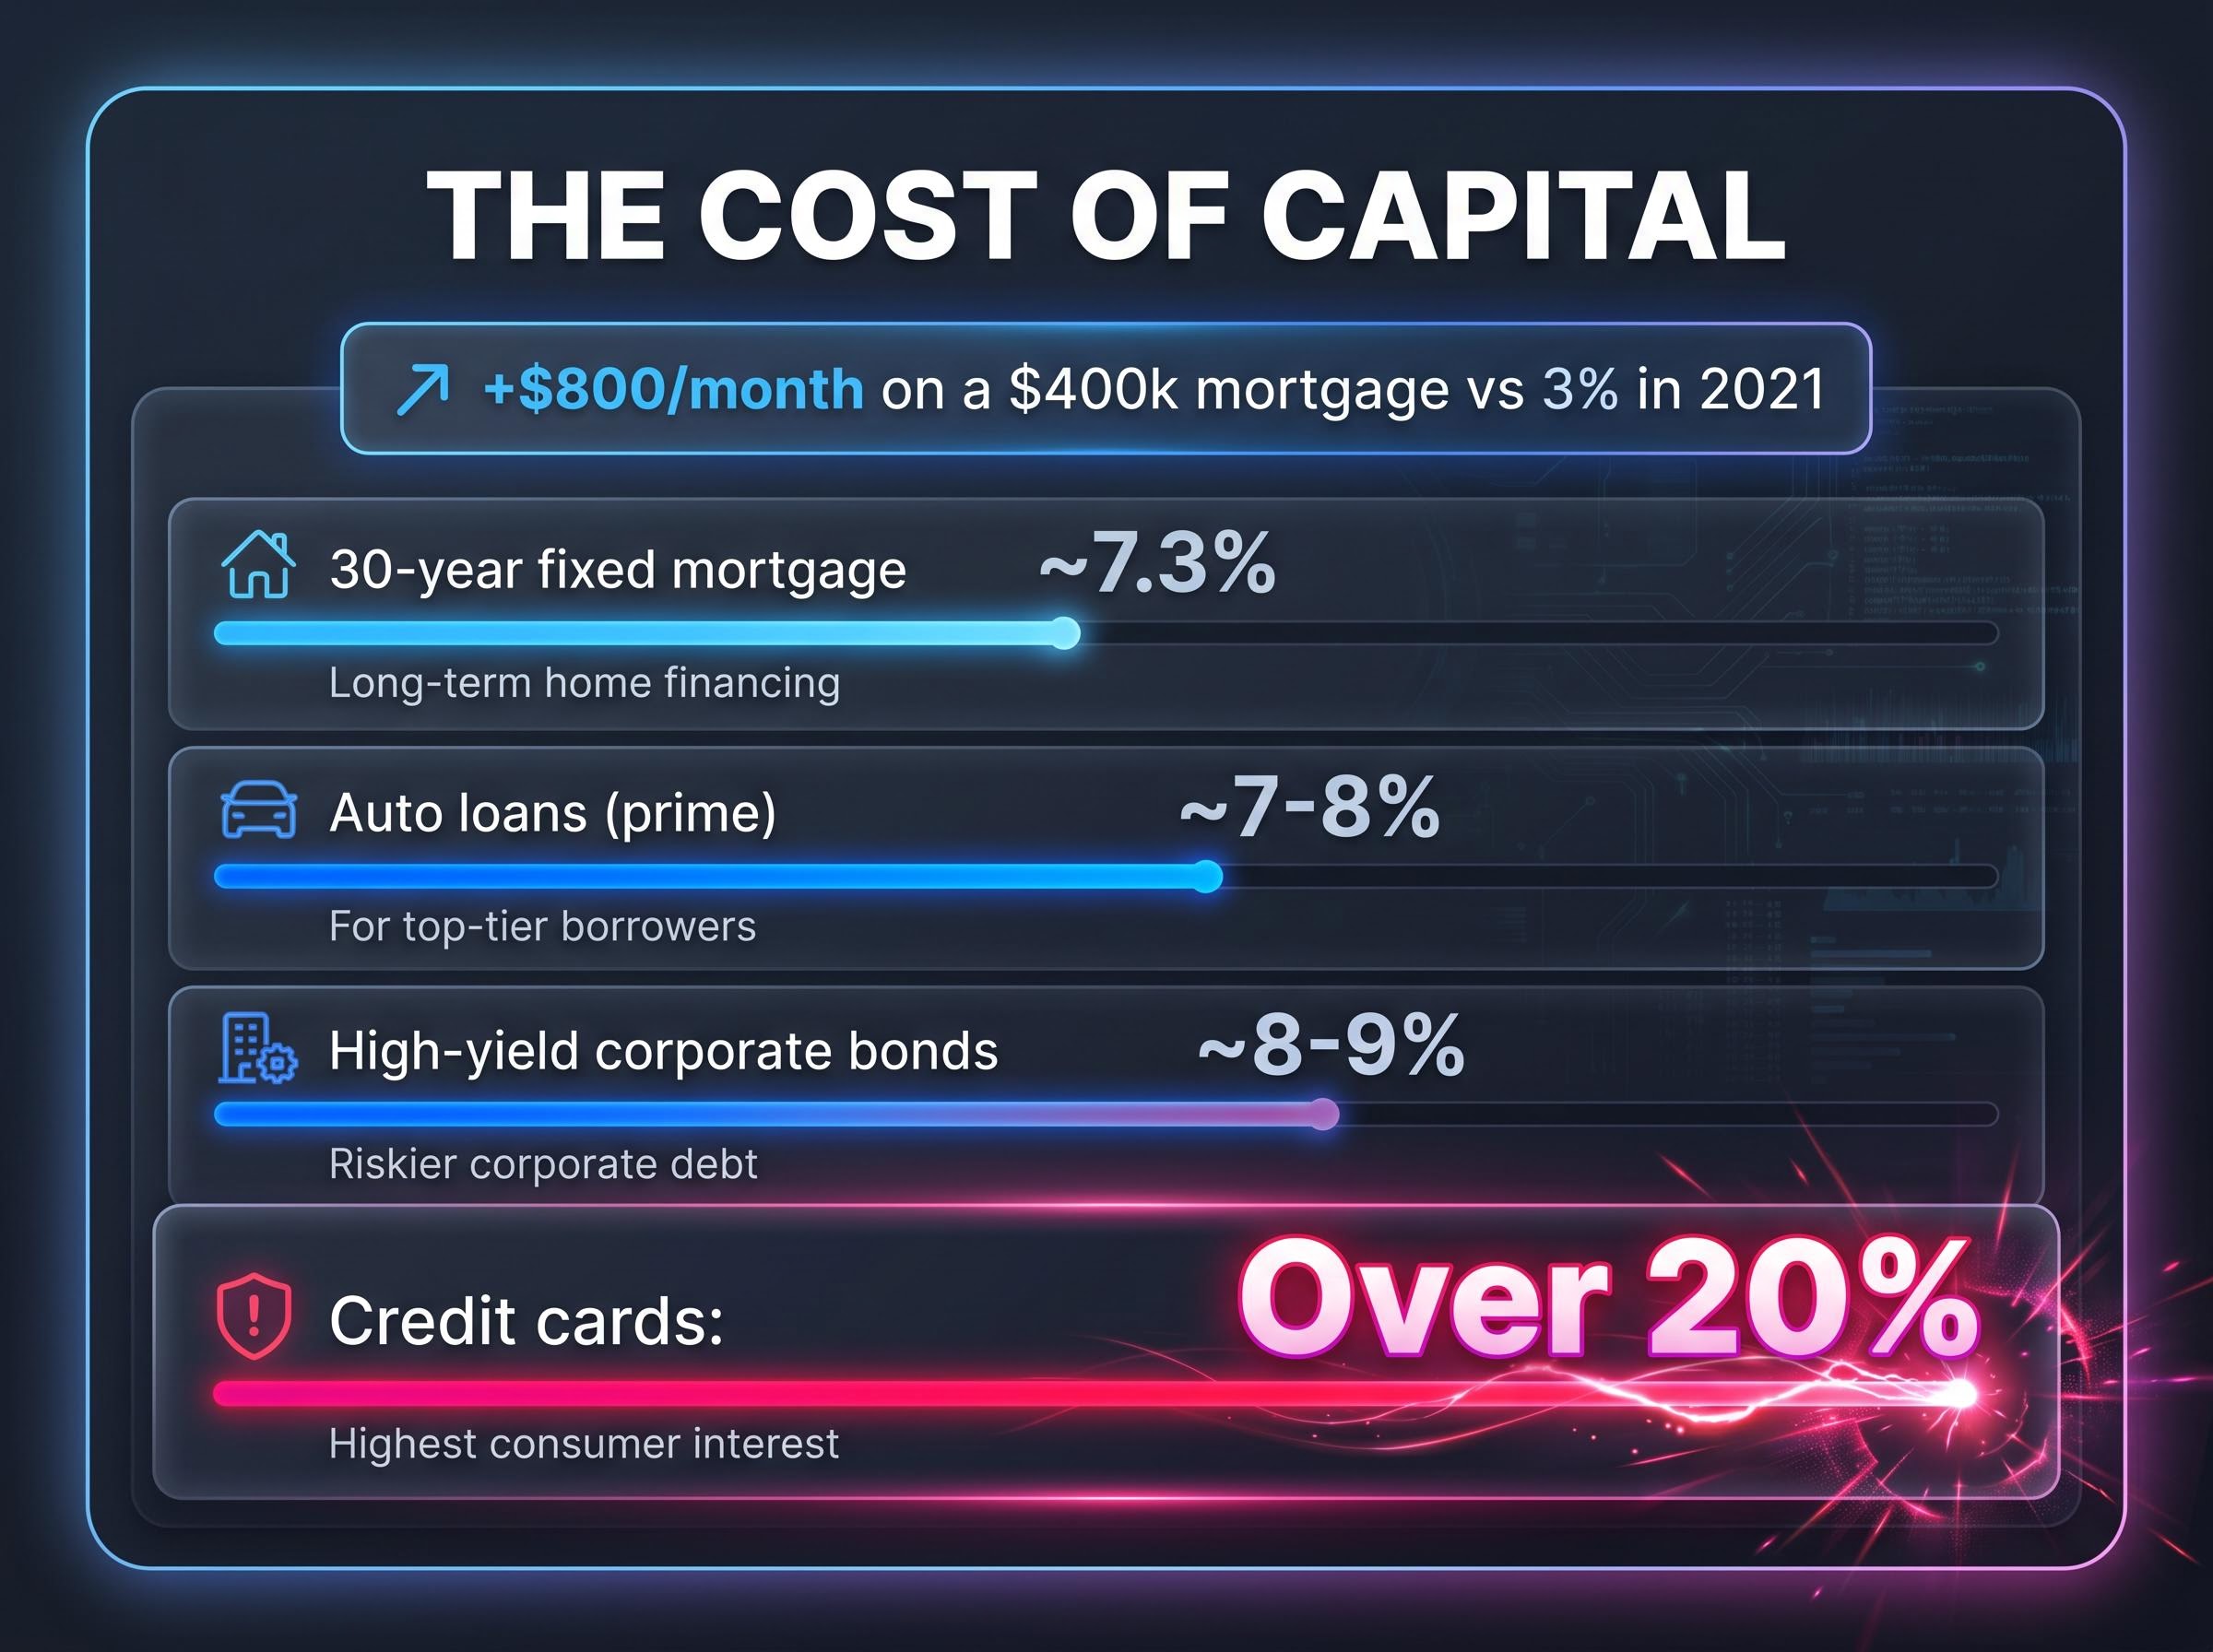
That single figure captures what the bond market’s repricing means for an individual household. The mechanism runs through several channels simultaneously.
| Asset Class | Rate Level | Approximate Period |
|---|---|---|
| 30-year fixed mortgage | ~7.3% | November 2024 (Freddie Mac via Reuters) |
| Investment-grade corporate bonds | Above 6% | September 2024 (Financial Times) |
| High-yield corporate bonds | ~8-9% | January 2025 (Bloomberg) |
| Credit cards | Over 20% | March 2024 (Fed data via Reuters) |
| Auto loans (prime borrowers) | ~7-8% | August 2024 (Wall Street Journal) |
Corporate borrowing tells a parallel story. The Financial Times reported on 18 September 2024 that a large US industrial company paid over 6.5% on a 10-year bond, compared with approximately 3% on comparable debt issued in 2021, essentially doubling its interest cost on new borrowing. At the lower end of the credit spectrum, Bloomberg reported in January 2025 that some lower-rated issuers were paying double-digit coupons.
Household debt dynamics compound this picture further: US credit card balances reached a record $1.28 trillion in early 2026 while the personal savings rate dropped to 4%, meaning the rate shock documented in this section is landing on consumer balance sheets that have limited capacity to absorb sustained higher borrowing costs without contracting discretionary spending.
Regional banks have responded by tightening lending standards. Bloomberg reported on 17 February 2025 that one bank executive said higher funding and capital costs meant “we simply can’t make some loans pencil out at previous terms.”
The Federal Reserve’s quantitative tightening programme has compounded these pressures. By reducing its Treasury holdings, the Fed has shifted more duration risk back to the private sector, contributing to elevated long-term yields independently of the policy rate. The consequences of sovereign debt accumulation are not confined to the government’s own balance sheet. They arrive in household budgets and corporate income statements through rate channels that operate whether or not individuals hold a single Treasury bond.
What the structural critics and the optimists are each getting right
The debate over the US fiscal trajectory is not a binary question of collapse versus indefinite continuation. Both the structural warning case and the resilience case rest on identifiable mechanisms.
The structural critics have the arithmetic on their side. Ken Rogoff, quoted in February 2025 reporting, noted that the combination of persistent primary deficits and higher real interest rates puts the US on a path where debt ratios “could rise without bound” without policy changes. Ray Dalio, in a November 2024 interview, characterised the situation as “a classic late-cycle debt problem” with high borrowing needs colliding with waning Treasury demand. Olivier Blanchard, the former IMF chief economist, argued in mid-2024 that advanced economies including the US “can no longer rely on growth to outrun debt indefinitely” with higher real rates.
The resilience case rests on a structural advantage no other sovereign debtor possesses. The US dollar remains the world’s reserve currency, generating a persistent baseline demand for Treasuries as global safe-haven assets. This status provides a buffer, allowing the US to sustain debt levels that would trigger capital flight from smaller economies. Treasury markets remain the deepest and most liquid in the world.
The resilience case also draws on the observation that a pre-QE yield environment of 4.5-5% on long-dated Treasuries was the historical norm through the early-to-mid 2000s, meaning the decade of near-zero yields following the global financial crisis may have distorted investor expectations of what structurally sustainable borrowing costs actually look like.
The conditions that would accelerate the spiral
Three specific scenarios could shift the balance toward a more acute trajectory:
- Sustained foreign demand reduction for Treasuries, whether driven by geopolitical realignment or reserve diversification away from dollar assets.
- A legislative debt-ceiling standoff adding a political risk premium to Treasury yields. February 2025 reporting noted renewed investor and rating agency concern about this dynamic after the Fiscal Responsibility Act’s suspension expired in January 2025.
- A Federal Reserve policy misstep that raises inflation expectations, particularly if a shift toward accommodating fiscal deficits is interpreted by markets as monetisation.
Philip Swagel, CBO Director, in March 2025 remarks specifically flagged investor risk premia as the mechanism by which market pressure could materialise, noting that debt held by the public is projected to reach record levels relative to GDP.
The fiscal trajectory is already priced into your portfolio, whether you know it or not
The three layers of this dynamic, fiscal mechanics, bond market transmission, and equity valuation compression, are not operating in sequence. They are operating simultaneously, and they are already active in decisions investors and households are making today.
The $952 billion annual interest bill is not just 3.2% of GDP. Measured against federal revenue rather than total economic output, the share is larger and growing. Every dollar directed toward debt service is a dollar unavailable for counter-cyclical stimulus when the next downturn arrives.
The Goldman Sachs finding of a compressed equity risk premium near multi-decade lows is the specific market indicator that translates this fiscal story into a portfolio-level signal. Stocks are being asked to justify their valuations against a meaningfully higher alternative, with less margin for error on earnings delivery. The Federal Reserve’s continued quantitative tightening through early 2025 kept term premiums elevated independently of the policy rate, adding a supply-side headwind that legislative inaction has done little to address. FY2025 appropriations did not materially reduce the deficit trajectory.
The equity market valuation buffer is now thinner than at any point since the pre-COVID yield environment, with the S&P 500 trading near 21 times forward earnings against a 30-year Treasury yield that has reached its highest level since 2007, a configuration that leaves little room for the macro disappointments this article’s fiscal analysis suggests are structurally more likely.
Jason Furman warned in the Wall Street Journal that “a few more years of large primary deficits could lock the United States into a debt-interest spiral” forcing abrupt fiscal tightening.
The debt spiral concept is most useful not as a crisis prediction tool but as a framework for understanding why the structural environment for risk assets has shifted. Higher structural yields mean the hurdle rate for equities has risen. Credit is more expensive for corporations and consumers alike. The fiscal space to stimulate through a downturn has narrowed. The margin of safety, in portfolios and in household budgets, is structurally thinner than it was in a lower-yield environment.
This article is for informational purposes only and should not be considered financial advice. Investors should conduct their own research and consult with financial professionals before making investment decisions. Past performance does not guarantee future results. Financial projections referenced are subject to market conditions and various risk factors.