Bank of Queensland shares closed at $6.27 on 26 May 2026, a price that sits uncomfortably below what two standard valuation models produce when fed the bank’s own reported numbers. A price-to-earnings comparison against the ASX banking sector implies a value of approximately $7.44. A dividend discount model, depending on assumptions, produces estimates ranging from $7.19 to $10.57. That spread is either a signal that the market is mispricing BOQ or a reflection that the models are missing something the market can see. What follows is the arithmetic behind both approaches, what each output means, and why the gap between model and market demands more than a calculator to resolve.
Why BOQ is attracting attention at $6.27
BOQ released its 1H26 half-year results on 22 April 2026, and the headline numbers were broadly positive. Statutory net profit after tax came in at $136 million. The fully franked interim dividend rose 11% to 20.0 cents per share. Management reiterated its capital and payout frameworks.
The share price has not responded in kind. At $6.27, BOQ remains one of the more visibly discounted names in the ASX banking sector, and trading volumes in late May 2026 suggest elevated investor attention at this level.
Key data from the 1H26 result:
- Statutory NPAT: $136 million
- Fully franked interim dividend: 20.0 cents per share (up 11%)
- Dividend payout guidance: 60-75% of cash earnings
- CET1 target range: 10.25-10.75%
The question the rest of this analysis addresses is straightforward: does the current market price reflect fair value, or do the numbers imply a measurable discount?
When big ASX news breaks, our subscribers know first
What PE ratio analysis suggests about BOQ’s fair value
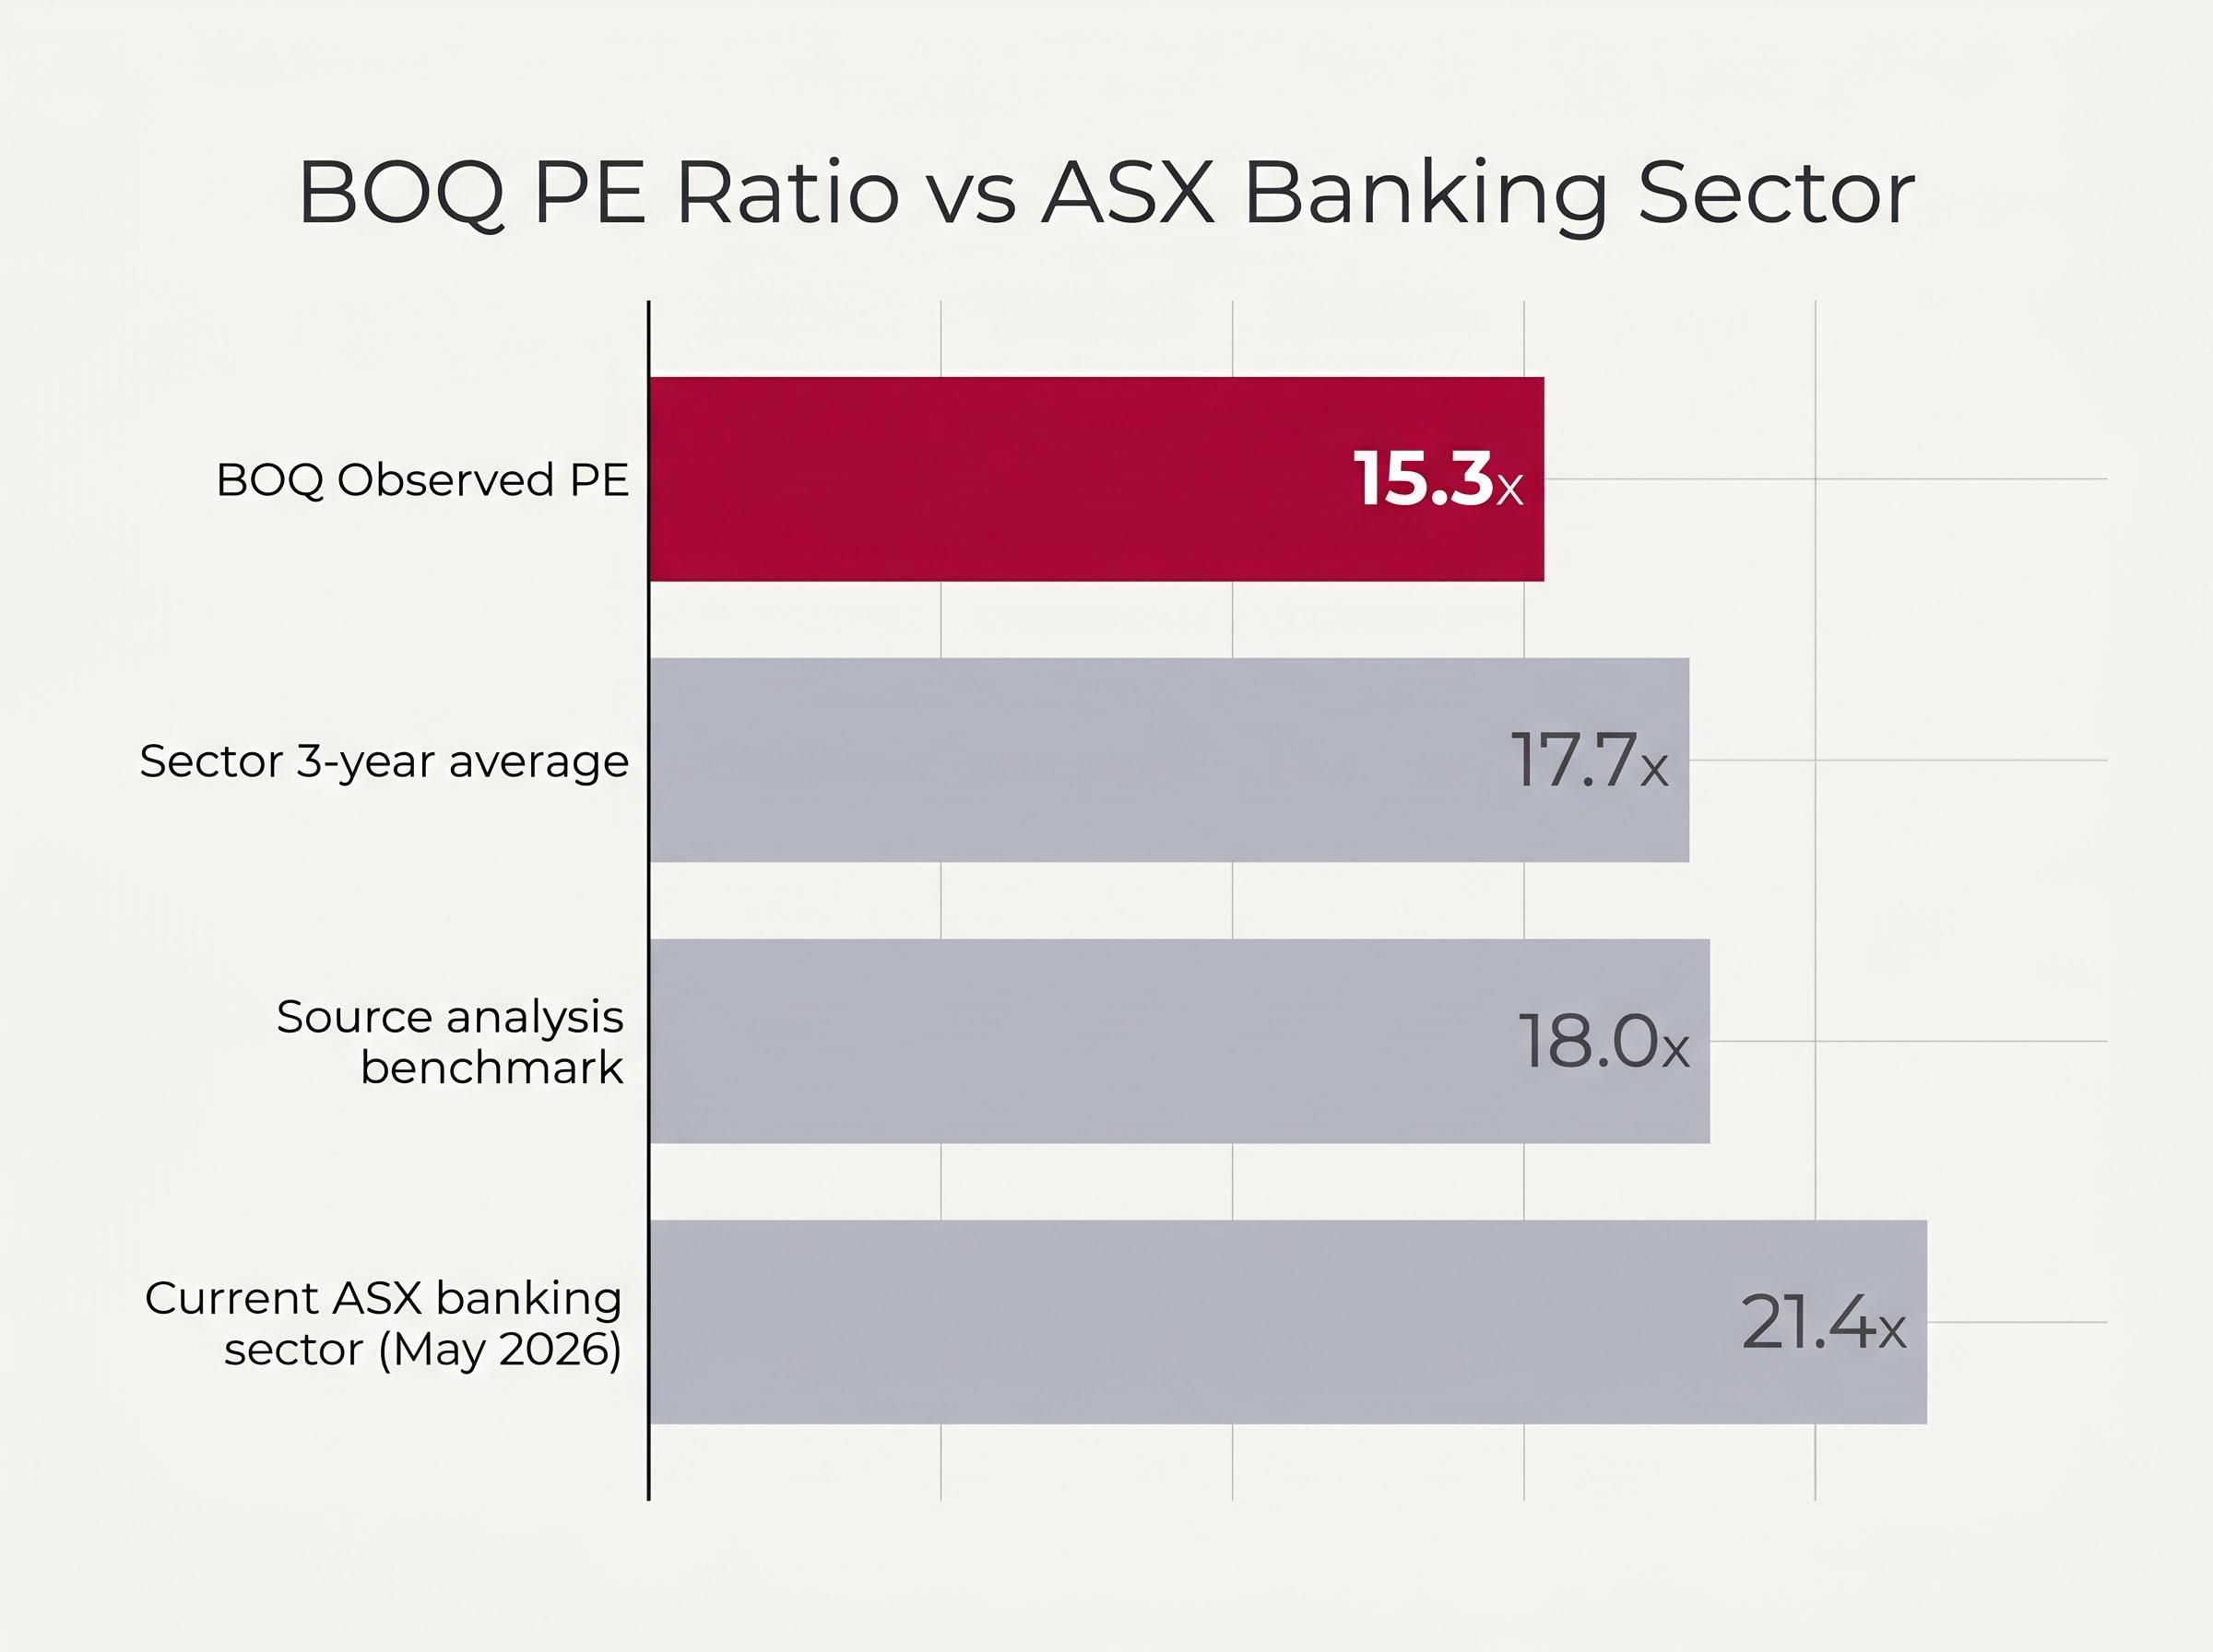
Start with the simplest available metric. BOQ’s most recent full-year earnings per share figure is $0.41 (FY24). Dividing the current share price of $6.27 by that EPS produces an observed price-to-earnings ratio of approximately 15.3x.
That number gains context when placed alongside the sector. According to Simply Wall St data from May 2026, the ASX banking sector trades at approximately 21.4x earnings. The sector’s three-year average PE sits at roughly 17.7x.
BOQ’s 15.3x is below both benchmarks.
A PE ratio framework for ASX banks applies three sequential steps: threshold assessment against an absolute ceiling, peer comparison against the sector mean, and implied valuation modelling using sector-adjusted multiples applied to the stock’s own EPS, a sequence that produces a more defensible estimate than any single comparison in isolation.
Applying those sector multiples to BOQ’s $0.41 EPS produces a range of implied valuations:
| Valuation basis | Sector PE multiple applied | Implied BOQ share value |
|---|---|---|
| 3-year sector average | 17.7x | $7.26 |
| Source analysis benchmark | 18.0x | $7.44 |
| Current sector PE | 21.4x | $8.77 |
BOQ’s observed PE of 15.3x sits meaningfully below both the current ASX banking sector average of 21.4x and the three-year historical mean of 17.7x, implying a discount on every comparison.
One caveat deserves emphasis. The $0.41 EPS figure is from FY24, the most recent full-year earnings available in open sources. The 1H26 result provides supporting context, but a formal full-year EPS for FY26 has not been guided. Any PE-derived estimate inherits that limitation.
How the Dividend Discount Model values BOQ shares
The PE ratio asks what the market is paying per dollar of earnings. The Dividend Discount Model (DDM) asks a different question: what is the present value of the dividends a shareholder expects to receive into the future?
The formula is direct. Share value equals the annual dividend divided by the difference between the discount rate (the return an investor requires) and the assumed dividend growth rate. Three inputs, one output, and the output moves sharply when any input shifts.
BOQ’s most recent annual dividend stands at $0.34 per share. Using a blended risk rate range of 6-11% and growth assumptions of 2-4%, the DDM generates a wide spread of outputs:
| Growth rate | 6% discount rate | 8% discount rate | 11% discount rate |
|---|---|---|---|
| 2% | $8.50 | $5.67 | $3.78 |
| 3% | $11.33 | $6.80 | $4.25 |
| 4% | $17.00 | $8.50 | $4.86 |
The averaged DDM output using the $0.34 base dividend is approximately $7.19. An adjusted dividend estimate of $0.35 pushes the averaged output to roughly $7.40.
How franking credits change the DDM output for Australian investors
BOQ’s dividends carry full franking credits. For eligible Australian shareholders, this means the effective return is higher than the cash dividend alone, because the attached tax credit can be used to offset personal income tax or, in some cases, claimed as a refund.
Grossing up the $0.34 cash dividend for franking credits produces an effective dividend of approximately $0.50 per share. Running the same DDM framework with this gross figure lifts the averaged output to approximately $10.57.
The difference between the $7.19 base case and the $10.57 gross case is substantial, and it is driven entirely by how the investor accounts for the franking benefit. Eligibility depends on individual tax circumstances, which means the higher figure applies to some shareholders and not others.
For SMSF trustees and low-tax investors wanting to model the specific grossing-up arithmetic, our dedicated guide to franking credit calculations walks through the 30/70 formula with worked examples, covers the 45-day holding period rule, and explains the 2025 ATO automatic refund change for eligible Australians aged over 60.
What both models are actually telling you
Two methods, applied independently, both place BOQ above its current trading price of $6.27 under reasonable assumptions. That convergence is worth noting.
- PE-derived estimate: $7.44 (using 18x sector average), implying an approximate 19% discount to fair value
- DDM base estimate: $7.19 (using $0.34 dividend), implying an approximate 15% discount
- DDM gross dividend estimate: $10.57 (using $0.50 grossed-up dividend), implying an approximate 69% discount
The models agree on direction. They disagree considerably on magnitude.
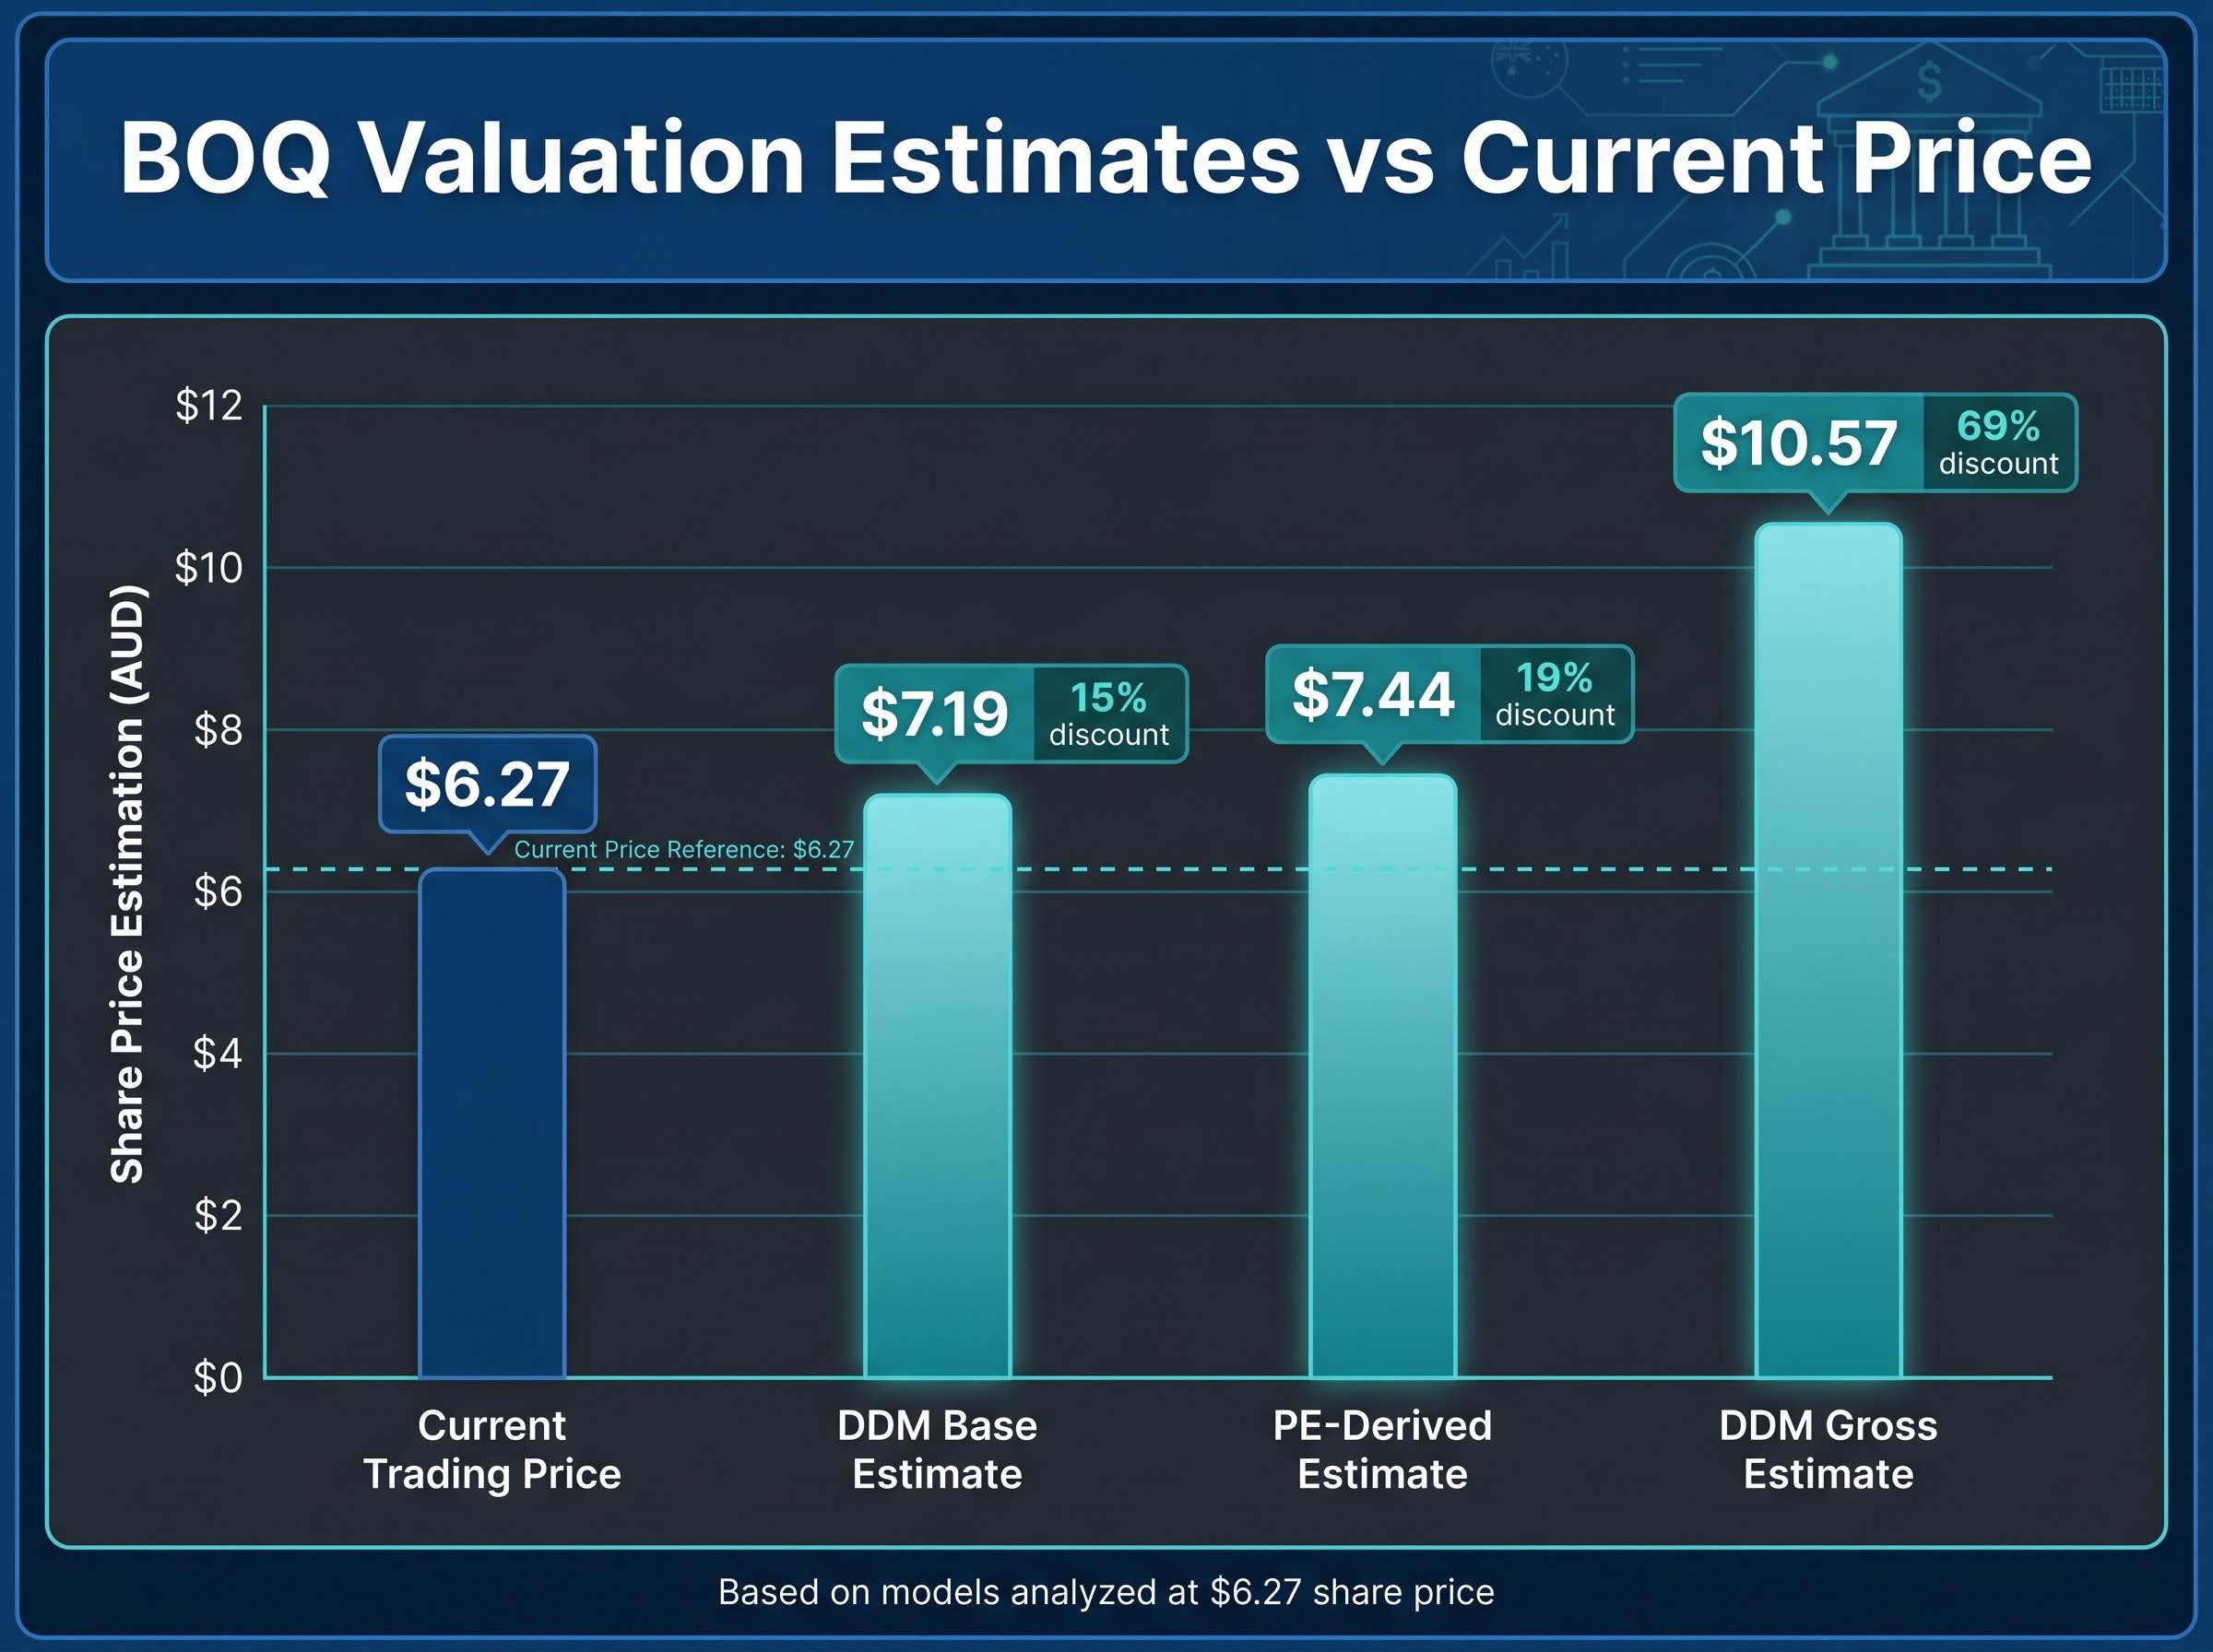
Both valuation approaches suggest BOQ may be trading at a discount to fair value, but the size of that discount depends heavily on which inputs an investor trusts and whether franking credits are included in the calculation.
One structural point warrants attention. The current sector PE of 21.4x represents a meaningful re-rating above the three-year average of 17.7x. If the sector mean-reverts toward historical norms, the PE-derived estimate contracts. Two models agreeing is more informative than one, but both still depend on assumptions that can shift.
Macro assumption sensitivity is not a minor modelling footnote for bank stocks; the same earnings base fed different RBA rate trajectories, property price scenarios, and unemployment forecasts can produce a valuation range exceeding 4x the current share price, a dispersion that explains why institutional analysts covering the same bank frequently hold materially different price targets.
Why the numbers are only the beginning of the analysis
Professional analysts typically spend considerable time on qualitative due diligence before constructing financial models. The PE and DDM outputs presented here are a starting point, not a conclusion.
Four qualitative variables most directly affect the inputs that drive BOQ’s valuation:
- RBA monetary policy and net interest margins: Rate decisions flow directly into the spread between what BOQ earns on loans and pays on deposits. Any shift in the rate trajectory alters the earnings base underpinning both models.
- Australian residential property market conditions: BOQ’s mortgage book quality and loan demand are tied to housing price movements and transaction volumes.
- Unemployment trends and arrears: Rising unemployment tends to push loan arrears higher, which can erode earnings and threaten dividend sustainability.
- Consumer confidence and credit growth: Household willingness to borrow drives loan origination volumes, a direct input to revenue growth assumptions.
The RBA Statement on Monetary Policy from May 2026 outlines the central bank’s cash rate trajectory and inflation outlook, both of which feed directly into the net interest margin assumptions underpinning any earnings-based valuation of Australian banks in the current cycle.
BOQ’s 1H26 results noted that loan impairment expectations remain below long-run averages. The dividend payout guidance of 60-75% of cash earnings means the DDM is particularly sensitive to any disruption in the earnings base.
Publicly accessible 2025-2026 detailed broker price targets for BOQ are not available in open sources. Investors seeking institutional coverage and specific analyst ratings should consult professional research services.
The valuation gap is real, but investors should do the work
At $6.27, BOQ appears to trade below both PE-derived and DDM-derived valuation estimates under reasonable assumptions. The PE approach places fair value at approximately $7.44. The DDM produces a range from $7.19 to $10.57, with the upper bound reflecting the inclusion of franking credits for eligible Australian shareholders.
The gap is most pronounced when franking credits are included. It narrows, but does not close, when using the most conservative assumptions available.
BOQ’s next formal catalyst is the full-year result for the year ending 31 August 2026, which will provide updated EPS and final dividend data to refresh both models. That release represents the clearest opportunity to test whether the current discount persists, narrows, or widens.
Valuation models are tools, not verdicts. The quantitative case outlined here points in a consistent direction, but the qualitative variables discussed above can shift the inputs on which both models depend. Investors considering acting on this analysis should continue their own due diligence and, where appropriate, consult a licensed financial adviser before making investment decisions.
Investors wanting to convert the valuation estimates above into a defensible position assessment will find our comprehensive walkthrough of ASX bank stock due diligence covers a five-factor checklist spanning income structure, property exposure, unemployment trajectory, management discipline, and arrears trends, with guidance on how often each factor should be revisited as macro conditions evolve.
This article is for informational purposes only and should not be considered financial advice. Investors should conduct their own research and consult with financial professionals before making investment decisions. Past performance does not guarantee future results. Financial projections are subject to market conditions and various risk factors.