ECB Warns €425bn in Private Credit Poses Spillover Risk
1 hr ago


Commonwealth Bank sits above every major Australian bank peer on the three metrics that matter most to bank investors. Its net interest margin of 1.99% is 21 basis points above the estimated ASX major bank average of 1.78%. Its return on equity of 13.1% runs nearly four percentage points clear of the sector. Its Common Equity Tier 1 (CET1) ratio of 12.3% places it at the stronger end of the peer group.
For investors evaluating CBA’s share price in mid-2026, that outperformance is simultaneously the strongest bull case and the hardest valuation question. The bank trades near A$164-A$165, at roughly 2x book value, a premium that reflects these superior metrics but also prices in much of the advantage. This analysis compares CBA against ANZ, Westpac, NAB, and Macquarie across net interest margin, return on equity, and capital adequacy, explains what each metric measures, and draws out what the comparison tells investors about CBA’s competitive position and whether the premium is earned.
Three metrics form the foundation of any bank-quality comparison. Before the peer data arrives, each one needs a clear definition:
Why NIM dominates CBA analysis: Lending income constitutes approximately 85% of CBA’s total revenue, making NIM the dominant driver of the bank’s earnings profile.
One comparability note is worth flagging early. Macquarie does not report a single group NIM like the retail-focused majors. Its closest equivalent is the Banking and Financial Services (BFS) segment NIM on loans and leases, which is used in the comparison that follows.
Investors wanting to build a repeatable framework around these three metrics, including how to source the data from ASX announcements and interpret peer gaps in real time, will find our dedicated guide to analysing ASX bank stocks using NIM, ROE, and CET1 covers each metric in depth with worked examples drawn from the Big Four’s most recent half-year results.
The NIM comparison across all five banks tells a clear story. CBA leads on every equivalent basis.
| Bank | Latest NIM | Reporting Period | Basis |
|---|---|---|---|
| CBA | 1.99% | FY26 (May 2026) | Group |
| Westpac | 1.95% statutory / 1.82% core | FY25 (Nov 2025) | Statutory / Core |
| NAB | 1.74% | FY25 (Nov 2025) | Group |
| Macquarie | 1.74% | FY25 (Mar 2025) | BFS segment |
| ANZ | 1.56% | FY25 (Nov 2025) | Group |
CBA’s 1.99% sits comfortably above every peer. ANZ’s 1.56% represents the widest gap in the comparison at 43 basis points. Westpac’s statutory NIM of 1.95% is the closest headline figure, but its core NIM of 1.82%, which strips out notable items, is the more meaningful comparison. On that basis, CBA’s lead over the next-best major is 17 basis points.
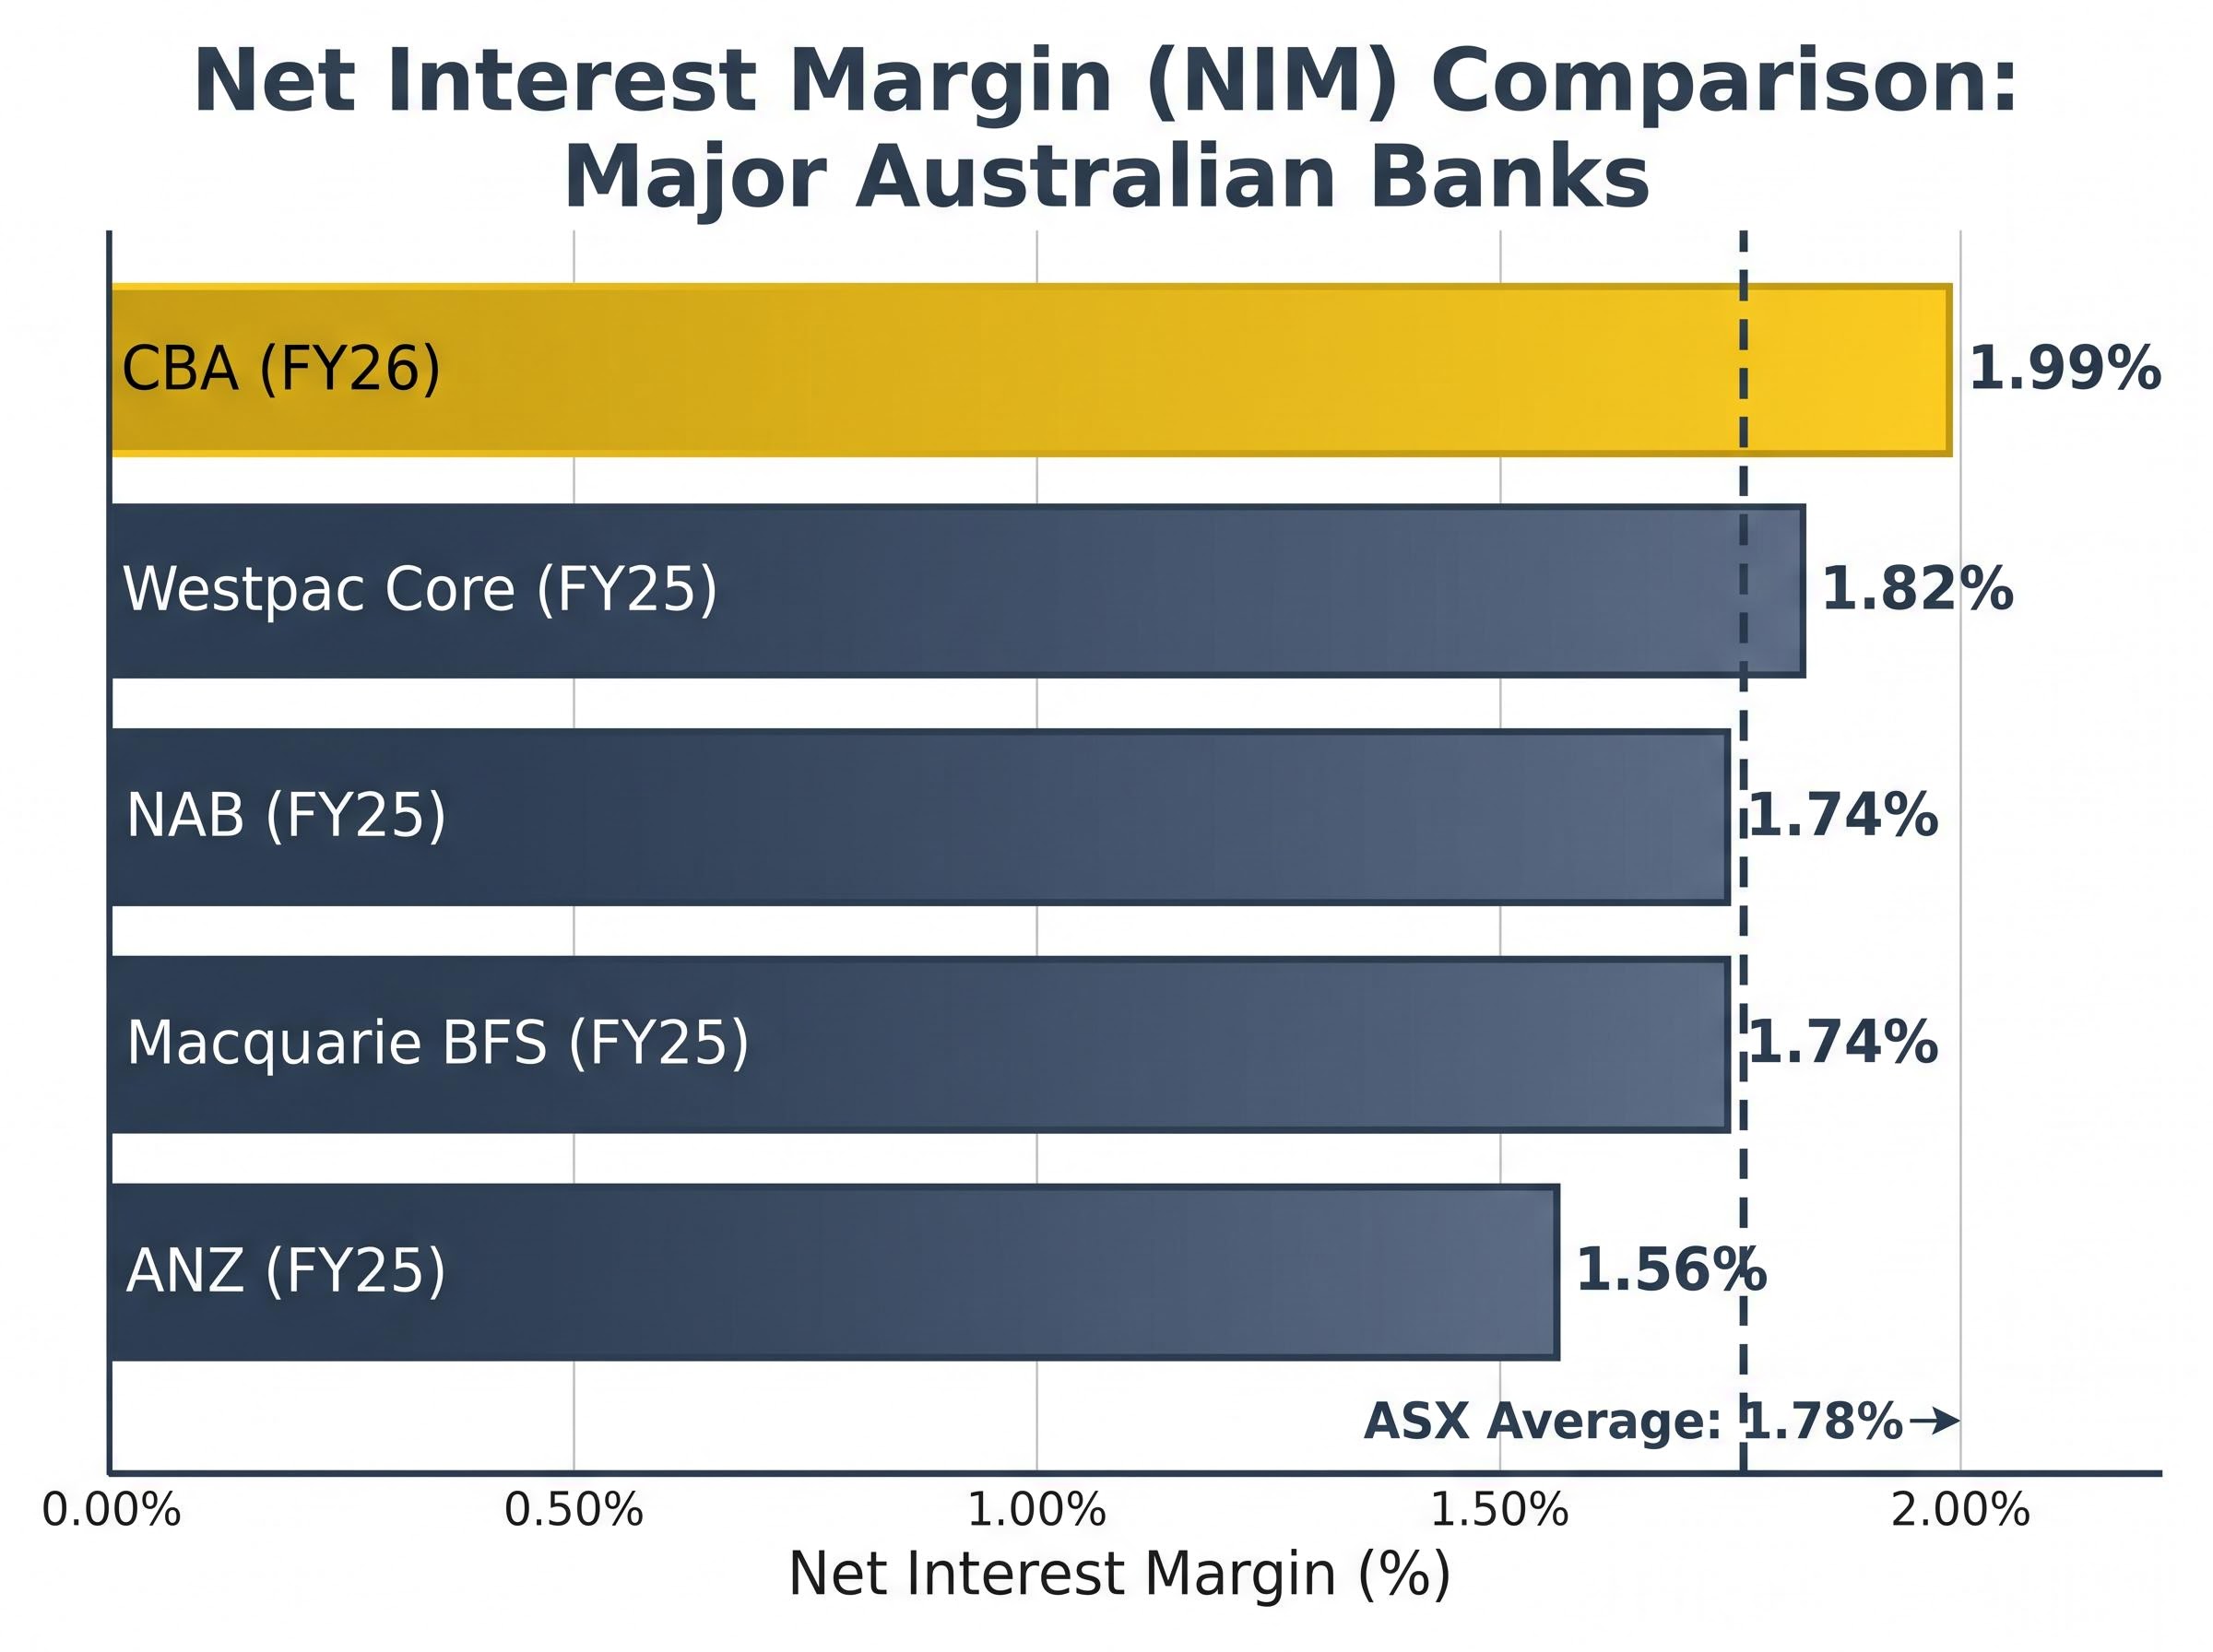
The structural explanation sits on the funding side of the margin. CBA holds a disproportionately high share of low-cost transaction and savings deposits, which reduces its cost of funds relative to peers more reliant on wholesale funding markets.
Scale reinforces this advantage. With more than 15 million customers, over 20% mortgage market share, and over 25% credit card market share, CBA holds pricing power on the lending side as well. Broker and financial press commentary consistently identifies this deposit franchise as the most structurally durable driver of CBA’s NIM premium.
Return on equity is where the competitive separation becomes most visible, and where the link to valuation is most direct.
| Bank | Latest ROE | Reporting Period | Notes |
|---|---|---|---|
| Macquarie | 14.0% | FY26 (Mar 2026) | Group ROE; different business mix |
| CBA | 13.1% | FY26 (May 2026) | Group ROE |
| NAB | ~11% | FY25 (Nov 2025) | Cash ROE, adjusted |
| Westpac | ~9.8-9.9% | FY25 (Nov 2025) | Reported ROE |
| ANZ | 8.1% | FY25 (Nov 2025) | Cash ROE (9.6% ex-significant items) |
CBA’s 13.1% sits in a fundamentally different category from the 8-11% range occupied by ANZ, Westpac, and NAB. The ASX banking sector average ROE stands at approximately 9.35%, according to Rask analysis, placing CBA nearly four percentage points above.
Macquarie is the one peer with a comparable ROE at 14.0% for FY26. That figure reflects Macquarie’s fundamentally different business mix, spanning investment banking, asset management, and global infrastructure, rather than retail banking efficiency. The two numbers are not directly comparable as measures of retail bank quality.
According to UBS, CBA’s ROE premium is driven by “superior risk-adjusted margins, best-in-class cost efficiency in retail, and a structurally lower loss rate.” Three structural factors underpin the gap:
Provisioning direction and loan book quality sit alongside NIM and ROE as the metrics that determine whether a bank’s earnings trajectory is sustainable or artificially elevated; CBA’s loan impairment expense more than doubled from A$511 million in FY23 to A$1,154 million in FY24, a signal that credit quality has turned from cyclical lows even as absolute arrears remain manageable.
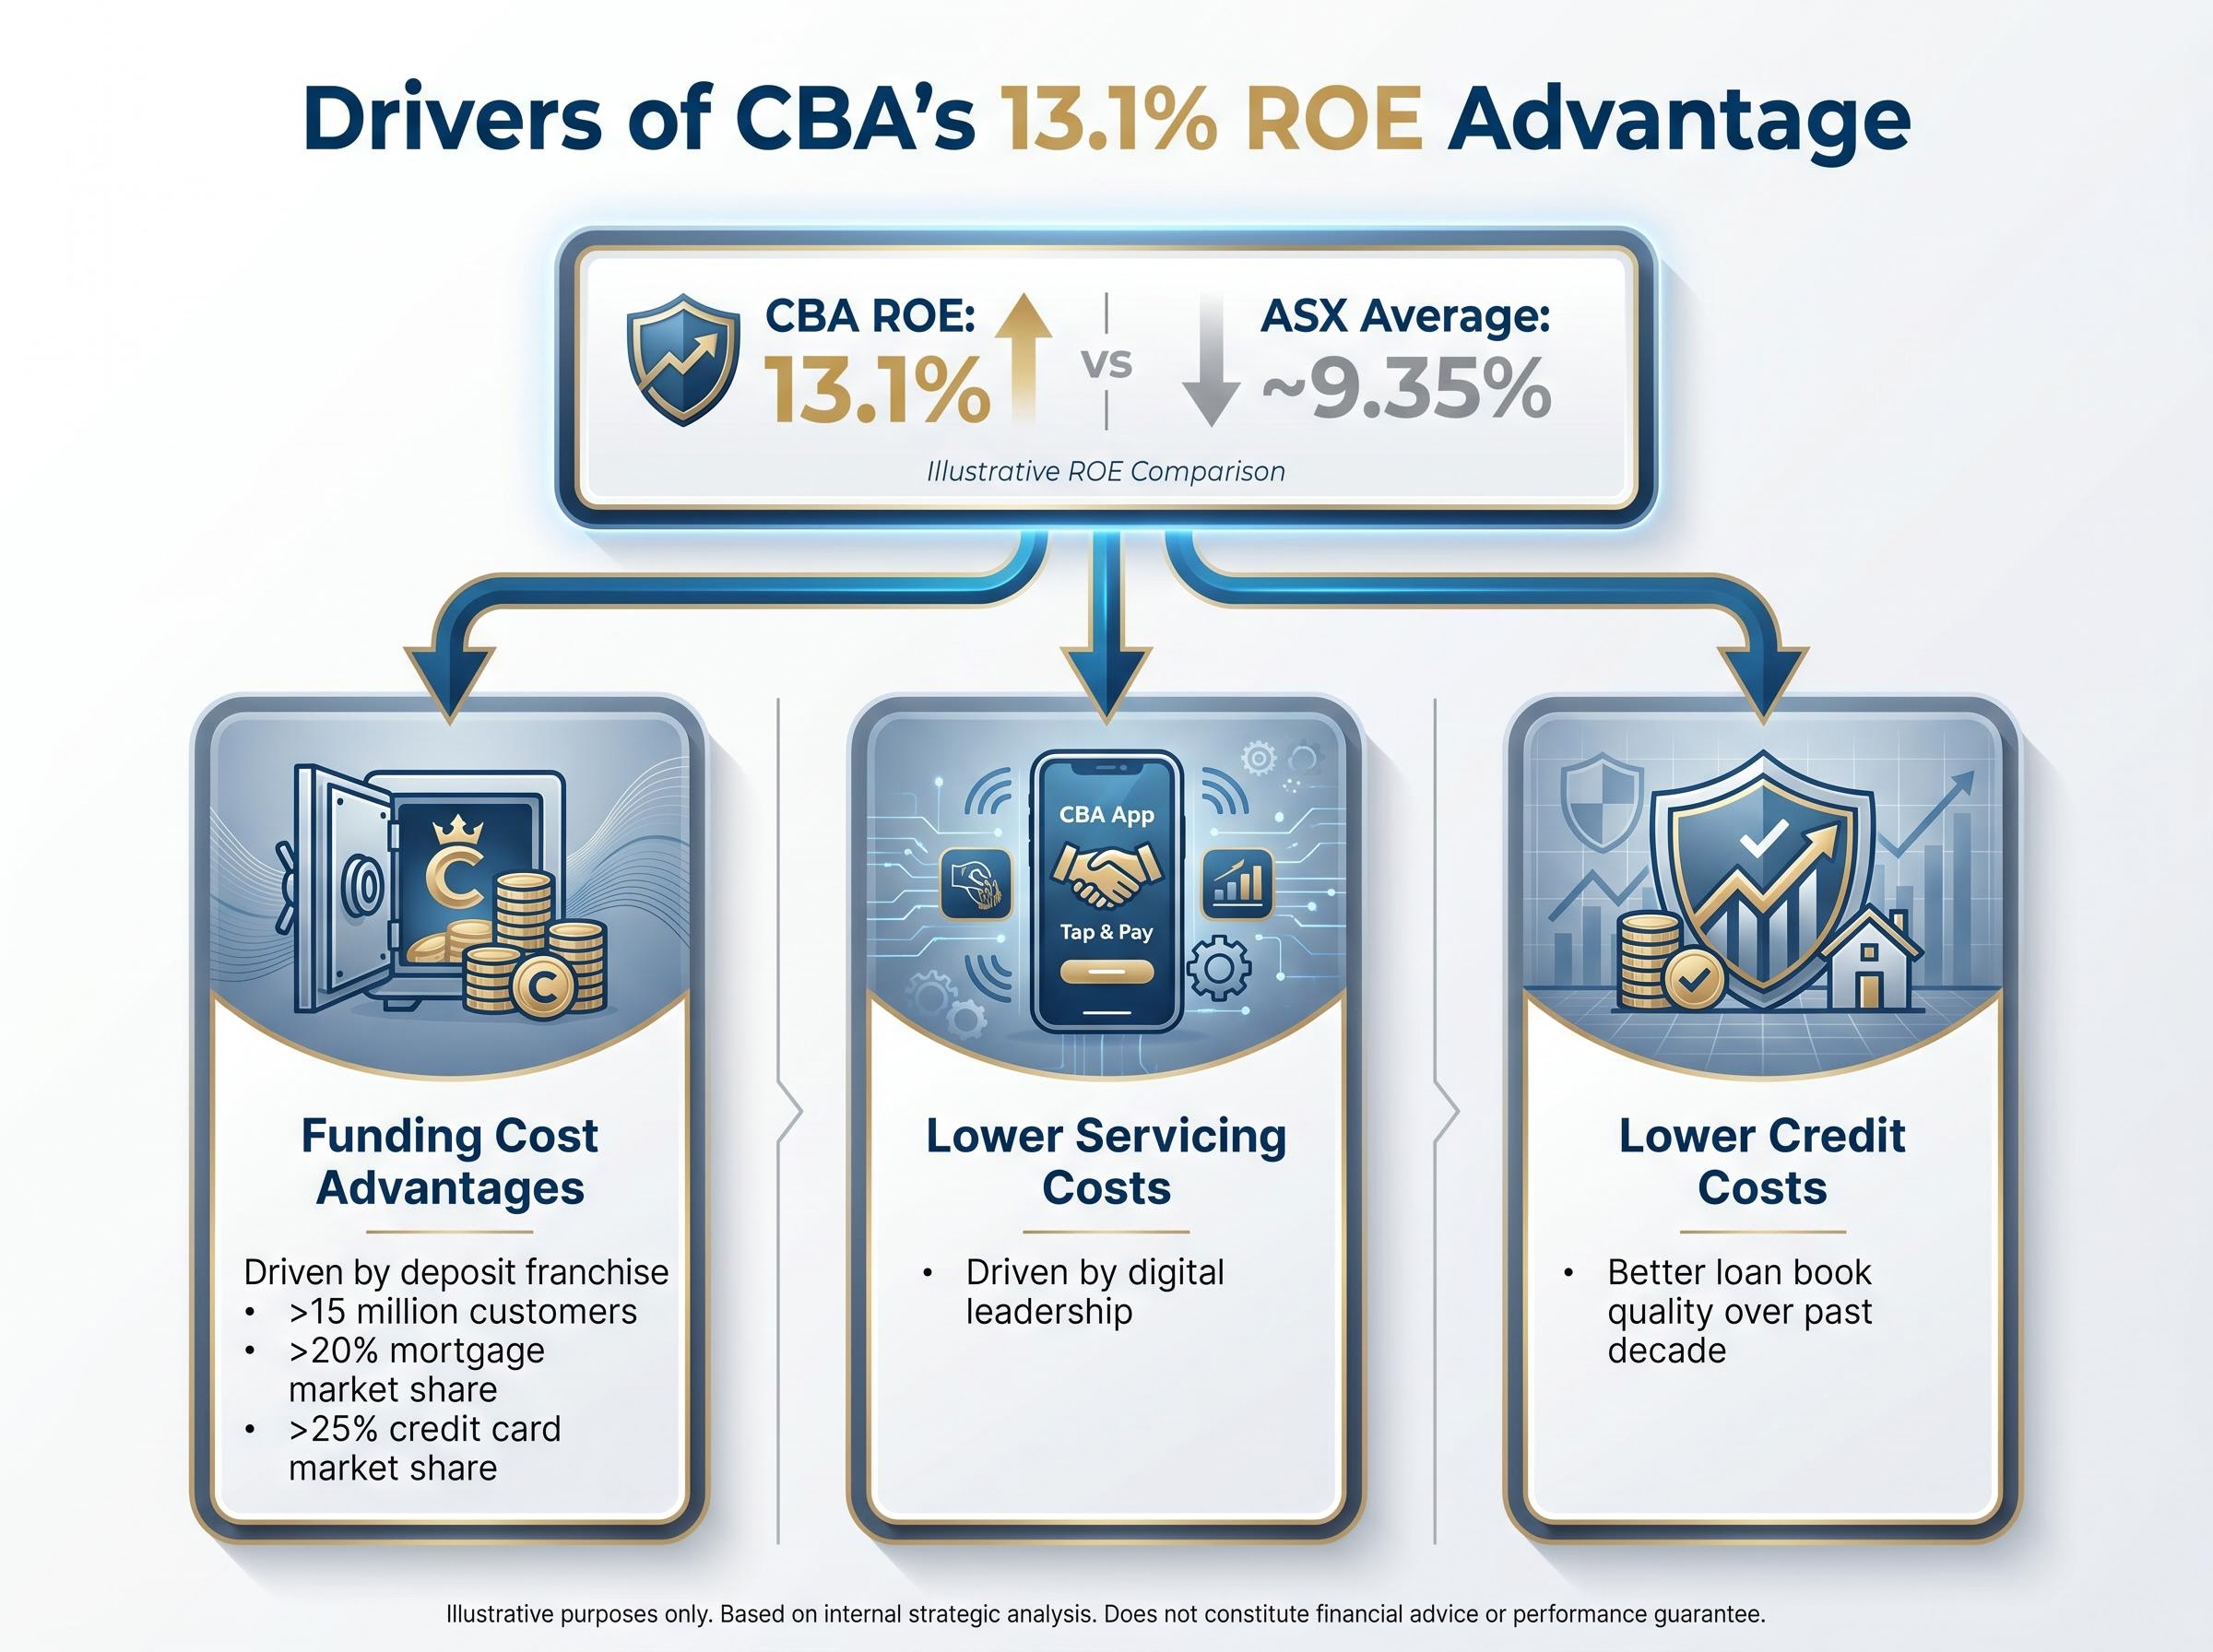
A bank that generates 13 cents per dollar of equity versus a peer generating 9 cents earns a higher price-to-book multiple. That relationship is the single clearest explanation of why CBA trades where it does.
The academic framework for price-to-book determinants for banks establishes that a firm’s price-to-book multiple is a direct function of its return on equity relative to its cost of equity, meaning banks with sustainably higher ROE should, in theory, command proportionally higher book value multiples.
CET1 is often treated as a compliance checkbox. It is more useful as a strategic indicator.
| Bank | CET1 Ratio | Reporting Date |
|---|---|---|
| Macquarie Bank Group | 12.8% | 31 March 2026 |
| Westpac | 12.5% | 30 September 2025 |
| CBA | 12.3% | FY26 (May 2026) |
| ANZ | 12.0% | 30 September 2025 |
| NAB | 11.7% | 30 September 2025 |
CBA’s 12.3% sits above NAB’s 11.7% (the weakest of the majors) and ANZ’s 12.0%, while sitting fractionally below Westpac’s 12.5% and Macquarie’s 12.8%. The capital story here is less about outperformance and more about confirming there is no weakness to explain away.
One dynamic the headline CET1 ratio does not immediately reveal is the pace of risk-weighted asset growth; CBA’s total RWAs expanded 2.4% in Q3 FY2026 to $517.5 billion, meaning the capital ratio’s stability reflects new capital issuance running alongside loan book expansion rather than a static balance sheet.
A CET1 ratio above APRA’s “unquestionably strong” threshold means CBA carries capacity for capital management actions, including buybacks, dividends, and strategic investment, without regulatory constraint. For investors evaluating downside risk, this ratio is the first line of defence. It confirms no capital adequacy vulnerability that would threaten the dividend or force dilutive capital raising.
Regulatory context: No material new APRA capital rule change post-January 2025 has reset sector-wide CET1 requirements. Current settings reflect ongoing implementation of the existing “unquestionably strong” framework rather than a new regulatory shock.
The metrics case is settled. CBA leads on NIM, leads materially on ROE, and carries a strong CET1 position. The valuation question is not.
CBA trades at approximately 2x book value versus 1.2-1.4x for ANZ, NAB, and Westpac. Its price-to-earnings multiple sits in the high teens compared with the low teens for peers. Reuters describes it as “Australia’s most expensive bank stock.”
Two coherent positions define the institutional debate:
“CBA’s quality is undeniable, but upside is constrained by valuation; we see better risk-reward in ANZ/NAB,” according to UBS Australia.
Macquarie Research adds that “in a lower rate, higher capital environment the ROE gap may narrow, challenging the extent of its multiple premium.”
Rask’s dividend discount model (DDM) analysis produces a base-case average valuation of approximately A$98.33, rising to A$143.80 when franking credits are incorporated at the adjusted dividend forecast. CBA’s prevailing share price of A$164.30 exceeds both estimates.
At a 6% risk rate and 4% growth assumption, the DDM produces A$238.00, though such assumptions would require sustained earnings growth above long-run averages. The current price sits above the central-case estimate, reinforcing the view that the market is pricing in premium-quality assumptions.
The DDM is one methodology among several, and its output depends heavily on the assumptions applied. Its relevance here is as one additional lens confirming that CBA’s current trading level reflects a significant quality premium over fundamental benchmarks.
Investors wanting to stress-test the premium thesis with additional frameworks will find our full explainer on CBA’s valuation against its historical PE median covers the broker consensus targets from Morgan Stanley, Macquarie Research, and Morningstar alongside a full PE peer comparison, with CBA’s trailing multiple of 26.8x sitting nearly 59% above its own 10-year median of 16.88x.
This article is for informational purposes only and should not be considered financial advice. Investors should conduct their own research and consult with financial professionals before making investment decisions.
The three-metric picture is clear in mid-2026:
These gaps are real, but they are not guaranteed to persist. Mortgage and deposit market competition continues to compress NIM across the sector. Westpac’s NIM expansion from 1.86% in FY24 to 1.95% statutory in FY25 is evidence that peer metrics are moving. Macquarie Research’s view that “the ROE gap may narrow” in a lower rate, higher capital environment remains a live risk to the premium thesis.
The RBA’s Financial Stability Review, published in October 2025, identified net interest margin compression as an emerging pressure across the Australian banking sector, noting that mortgage market competition and deposit repricing were the primary drivers narrowing spreads at the major banks.
ANZ and NAB continue to attract institutional attention as relative-value alternatives, with both UBS and Macquarie Research citing better risk-reward at current prices.
The comparison framework used here, NIM, ROE, and CET1 across the five institutions, is the right set of metrics to monitor at each half-year and full-year reporting period. Investors who track these three numbers across the majors will have a clear, evidence-based read on whether CBA’s premium is widening, holding, or compressing.
CBA’s outperformance across net interest margin, return on equity, and capital adequacy is real, documented, and structural. This is not a one-year anomaly; it is a franchise advantage built on deposit scale, digital leadership, and lower credit costs sustained over the better part of a decade.
Quality leadership and valuation premium are two different questions, however. The metrics comparison answers the first definitively. The second remains contested among institutions that agree on CBA’s quality but disagree on what price that quality warrants.
The three metrics examined in this analysis are exactly the data points to track at each upcoming results season. As ANZ, Westpac, NAB, and Macquarie report through the remainder of 2026, investors will have the numbers to assess in real time whether the gap is strengthening, holding, or narrowing, and whether the premium remains justified.
Past performance does not guarantee future results. Financial projections are subject to market conditions and various risk factors.
Net interest margin (NIM) is the spread between what a bank pays for its funding and what it earns from lending. For CBA, lending income makes up approximately 85% of total revenue, making NIM the dominant driver of its earnings profile.
CBA's ROE of 13.1% sits nearly four percentage points above the ASX banking sector average of approximately 9.35%, and materially above ANZ (8.1%), Westpac (around 9.8-9.9%), and NAB (around 11%), placing it in a fundamentally different performance category.
The CET1 ratio measures the proportion of a bank's risk-weighted assets covered by its highest-quality capital, primarily ordinary shares and retained earnings. CBA's CET1 of 12.3% confirms it meets APRA's unquestionably strong threshold, supporting its capacity to pay dividends and conduct buybacks without regulatory constraint.
CBA's roughly 2x book value multiple compares to 1.2-1.4x for its peers because a bank generating 13 cents per dollar of equity warrants a higher valuation than peers generating 8-11 cents, a relationship directly tied to its superior return on equity.
Mortgage and deposit market competition continues to compress NIM across the sector, with Westpac already expanding its NIM toward CBA's levels, while Macquarie Research has flagged that a lower rate, higher capital environment could narrow the ROE gap and challenge the extent of CBA's valuation premium.