A sensitivity table built around Bank of Queensland (BOQ) and the Dividend Discount Model produces estimated intrinsic values ranging from $3.89 to $17.50 per share, all from the same starting dividend. That spread is not a modelling error. It is the model working exactly as designed, and understanding why is the most important thing an Australian bank investor can learn about this tool.
The Dividend Discount Model is one of the oldest equity valuation frameworks in financial markets. It remains a standard approach for bank analysts because banks are unusually well suited to it: they pay predictable, high-yield dividends, often fully franked, across long histories. BOQ’s FY25 dividend of 38 cents per share (fully franked) makes it a live, current worked example with real numbers.
This article builds the model from the formula up, shows how franking credits add a specifically Australian dimension to the calculation, and walks through what happens to the valuation output when the discount rate and growth rate assumptions shift by even a single percentage point. By the end, readers will understand not just how to apply the model but why its outputs must always be read as a range of scenarios rather than a single answer.
What the Dividend Discount Model actually calculates
Before the formula, the logic. If a share pays dividends, and those dividends are expected to grow over time, then the share is worth whatever an investor would pay today for that entire future stream of income. A dollar received next year is worth less than a dollar in hand now, so each future dividend must be discounted back to its present value. The Dividend Discount Model does exactly this: it collapses an infinite series of growing future dividends into a single number.
The most common version, the Gordon Growth Model, compresses the calculation into one formula:
Intrinsic Value = D1 / (r – g)
The three variables are:
- D1: The dividend expected next year (not the dividend just paid, but the next one)
- r: The required rate of return, sometimes called the discount rate, representing what an investor demands for holding the stock instead of a risk-free alternative
- g: The constant rate at which dividends are assumed to grow every year, indefinitely
The formula assumes dividends grow at a constant rate forever. That assumption makes the maths tractable, but it also means the output is only as reliable as the assumptions fed into it. One constraint is absolute: r must exceed g. If the growth rate matches or exceeds the discount rate, the denominator hits zero or turns negative, and the model breaks down entirely.
When big ASX news breaks, our subscribers know first
Why banks are the natural home of the DDM
The model works best when future dividends are relatively predictable. Companies with volatile earnings, irregular payouts, or reinvestment-heavy capital allocation strategies make poor DDM candidates because the constant-growth assumption fails quickly. Banks, particularly Australian banks, sit at the other end of that spectrum.
Australian banks, including BOQ, Bendigo and Adelaide Bank, and Westpac, have historically distributed a high proportion of earnings as fully franked dividends. Payout ratios tend to be elevated. Dividend histories stretch back decades. Retail investors hold these shares specifically for income and franking credits, and management teams understand the signalling cost of cutting a dividend. The result: future dividend streams are more estimable for banks than for most other sectors.
BOQ provides a current worked example. On 15 October 2025, the bank announced an FY25 total dividend of 38 cents per share, fully franked (18 cents interim plus 20 cents final). That was up from 34 cents per share in FY24 (17 cents interim plus 17 cents final, announced 17 October 2024), an increase of 4 cents per share, or approximately 11.8%.
| Financial Year | Interim Dividend | Final Dividend | Total Dividend | Franking |
|---|---|---|---|---|
| FY24 | 17c | 17c | 34c | Fully franked |
| FY25 | 18c | 20c | 38c | Fully franked |
That trajectory, a rising, fully franked dividend paid consistently across interim and final periods, is precisely the profile the DDM is designed to value.
How franking credits change the calculation for Australian investors
A DDM built on the cash dividend alone understates what an eligible Australian shareholder actually receives. The reason is the dividend imputation system. When an Australian company pays the 30% corporate tax rate on its profits and then distributes those profits as dividends, it attaches franking credits representing the tax already paid. Shareholders include both the cash dividend and the franking credits in their assessable income, then use the credits as a tax offset. For eligible low-rate or zero-rate taxpayers, including retirees and self-managed super funds in pension phase, franking credits are refundable where they exceed the tax payable. The Australian Taxation Office confirms this treatment for the 2024-25 income year.
The franking credit calculation follows the same 30/70 formula whether applied to BOQ, NAB, or any other fully franked ASX dividend: the corporate tax rate already paid by the company is expressed as a grossed-up addition to the cash distribution, converting a headline yield into its true before-tax equivalent for eligible investors.
The ATO franking credit refund eligibility rules confirm that where franking credits exceed a shareholder’s tax liability, the excess is paid as a cash refund, making the gross-up calculation particularly consequential for retirees and self-managed superannuation funds in pension phase.
Integrating franking credits into the DDM requires grossing up the cash dividend to its before-tax equivalent. The process has three steps:
- Identify the cash dividend. For BOQ FY25, this is $0.38 per share.
- Calculate the franking credit. The formula, as documented by Davidsons (updated 2025), is: Franking Credit = Dividend x (0.30 / 0.70) = Dividend x 0.4286. Applied to BOQ: $0.38 x 0.4286 = approximately $0.163 per share.
- Sum to the grossed-up dividend. Cash dividend plus franking credit: $0.38 + $0.163 = approximately $0.543 per share.
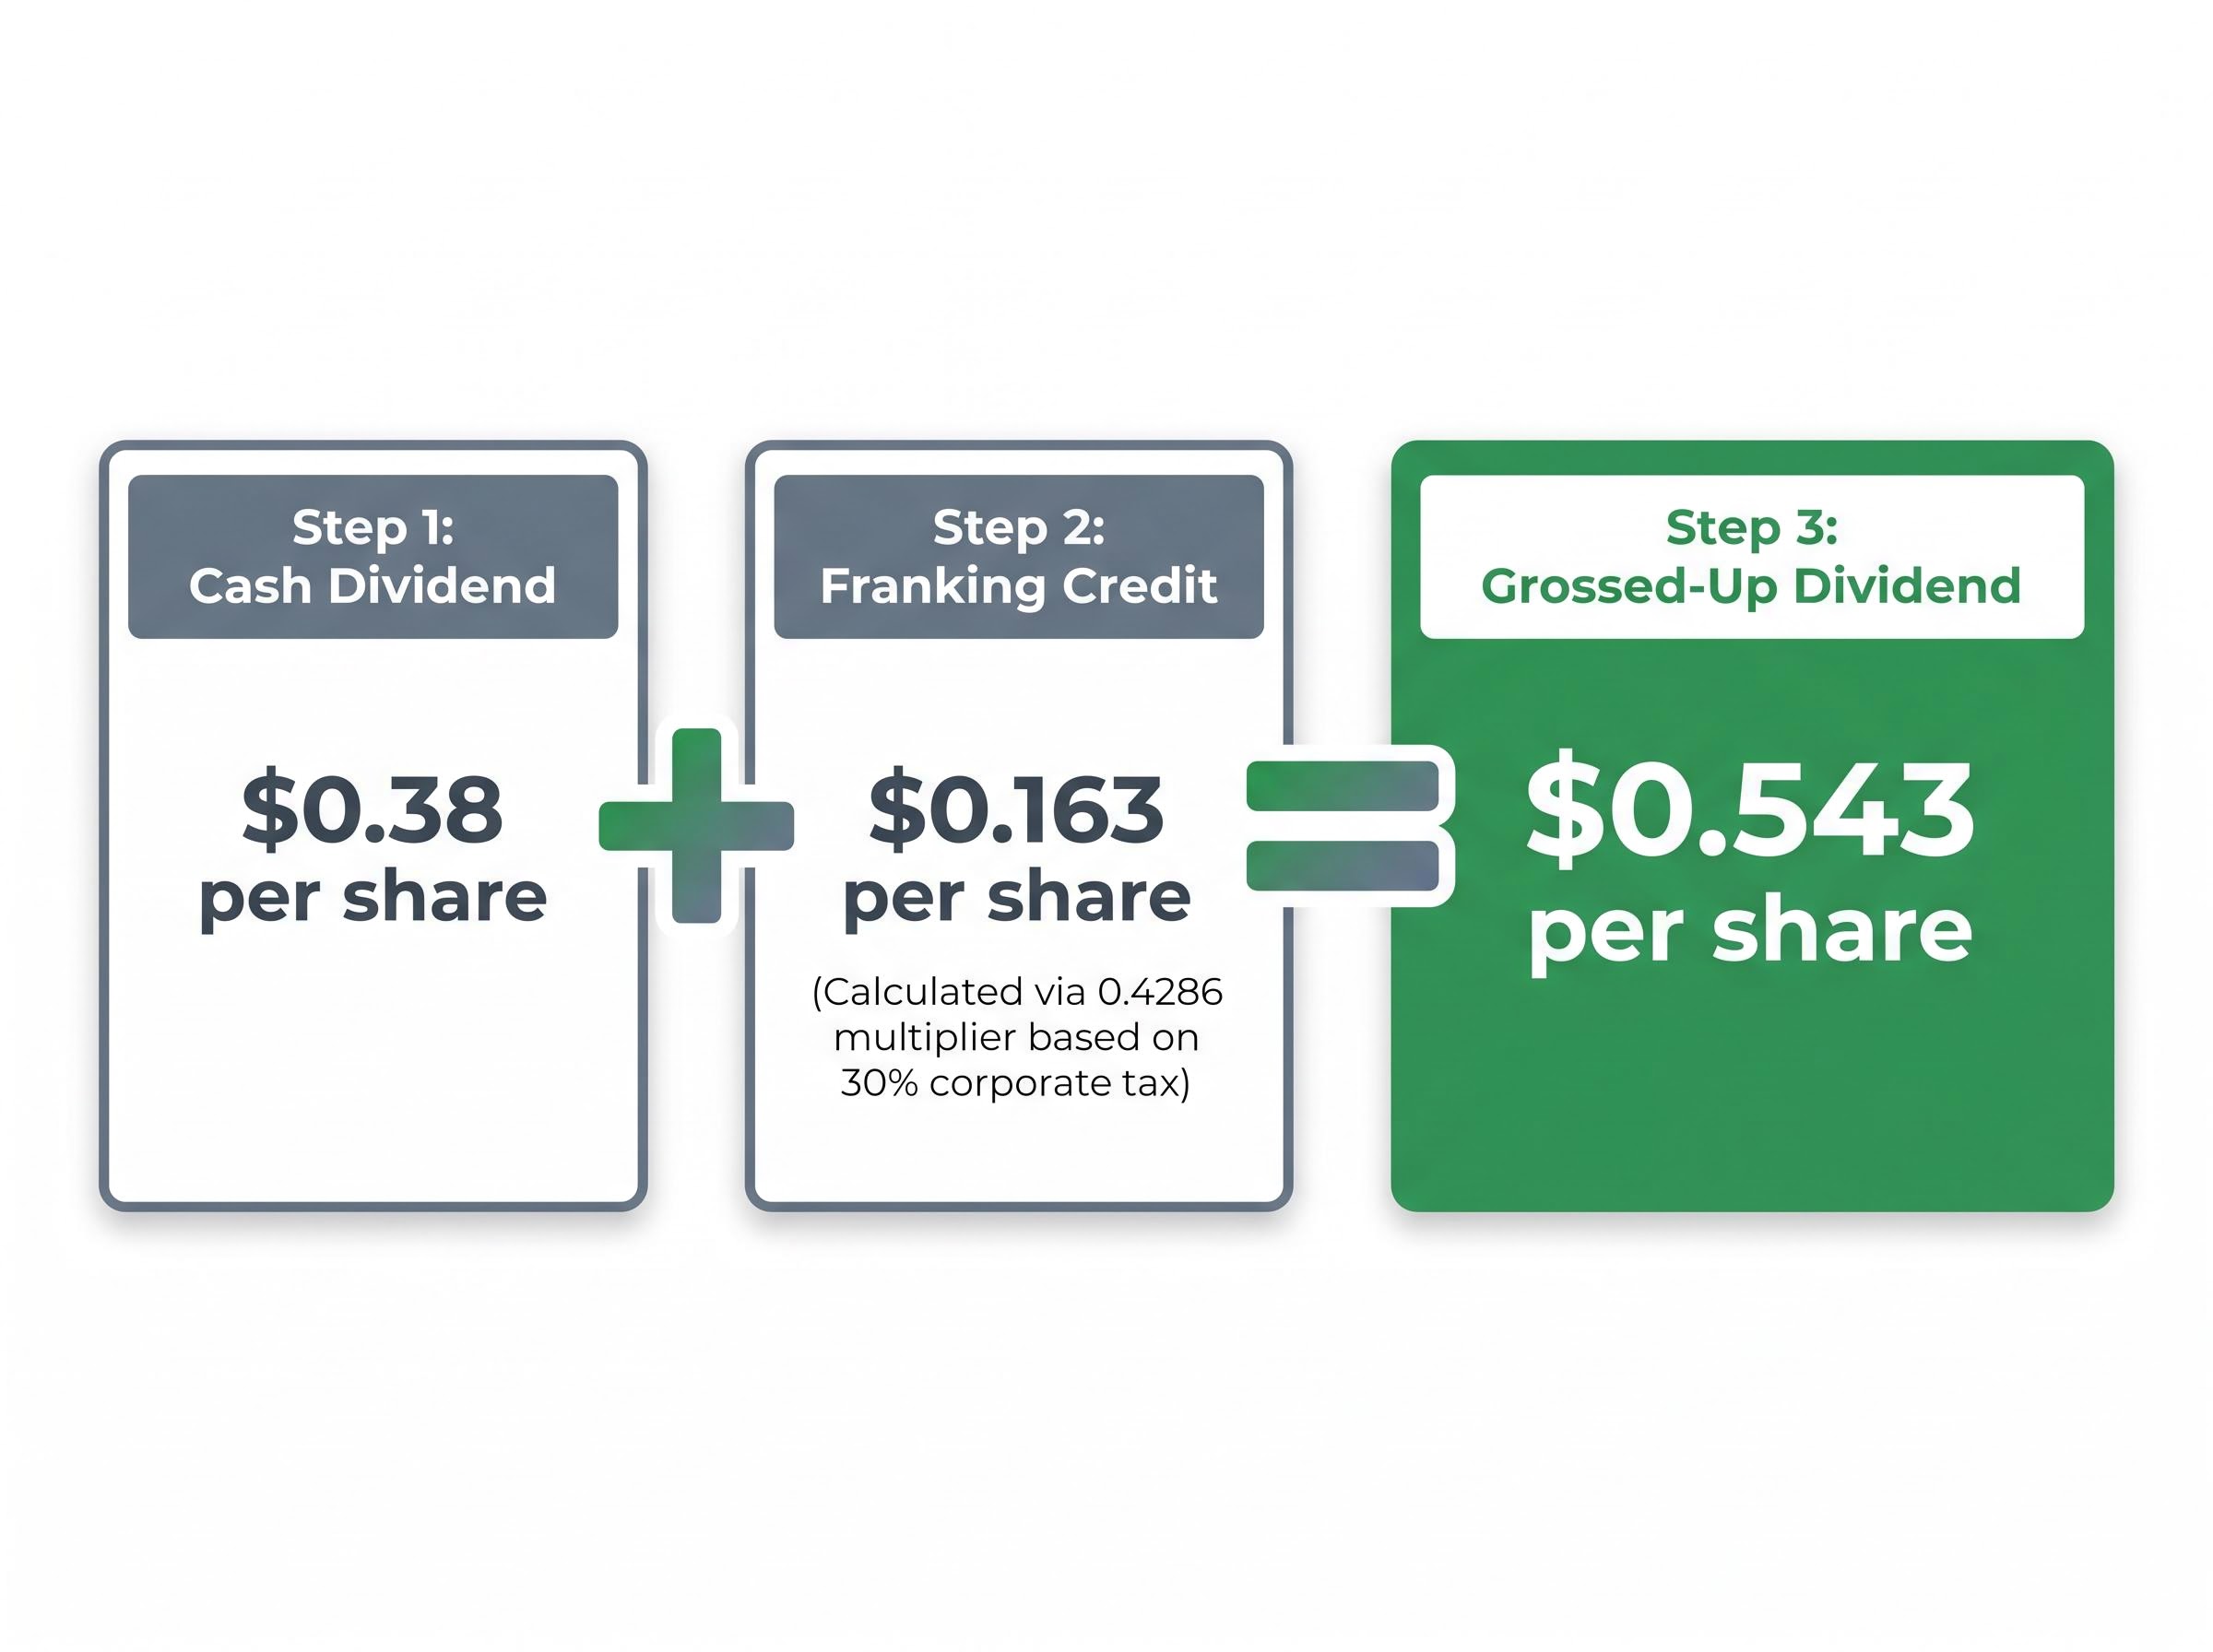
BOQ FY25 grossed-up dividend: approximately $0.543 per share (before-tax equivalent)
The difference this makes inside the DDM is material. Using a grossed-up forecast dividend of $0.50 per share as the D1 input produces an estimated intrinsic value of $10.57 under one set of assumptions, versus $7.40 using the cash dividend alone. For Australian investors eligible to receive the full franking benefit, ignoring the gross-up systematically understates the model’s output.
The sensitivity table: where the model’s real lesson lives
The DDM formula is deceptively simple. Its real behaviour emerges when the inputs are varied across a plausible range and the outputs are laid side by side. The following sensitivity table uses a forecast dividend (D1) of $0.35 per share and calculates the estimated intrinsic value of BOQ across discount rates from 6% to 11% and dividend growth rates from 2% to 4%.
| Growth Rate (g) | r = 6% | r = 7% | r = 8% | r = 9% | r = 10% |
|---|---|---|---|---|---|
| 2% | $8.75 | $7.00 | $5.83 | $5.00 | $4.38 |
| 3% | $11.67 | $8.75 | $7.00 | $5.83 | $5.00 |
| 4% | $17.50 | $11.67 | $8.75 | $7.00 | $5.83 |
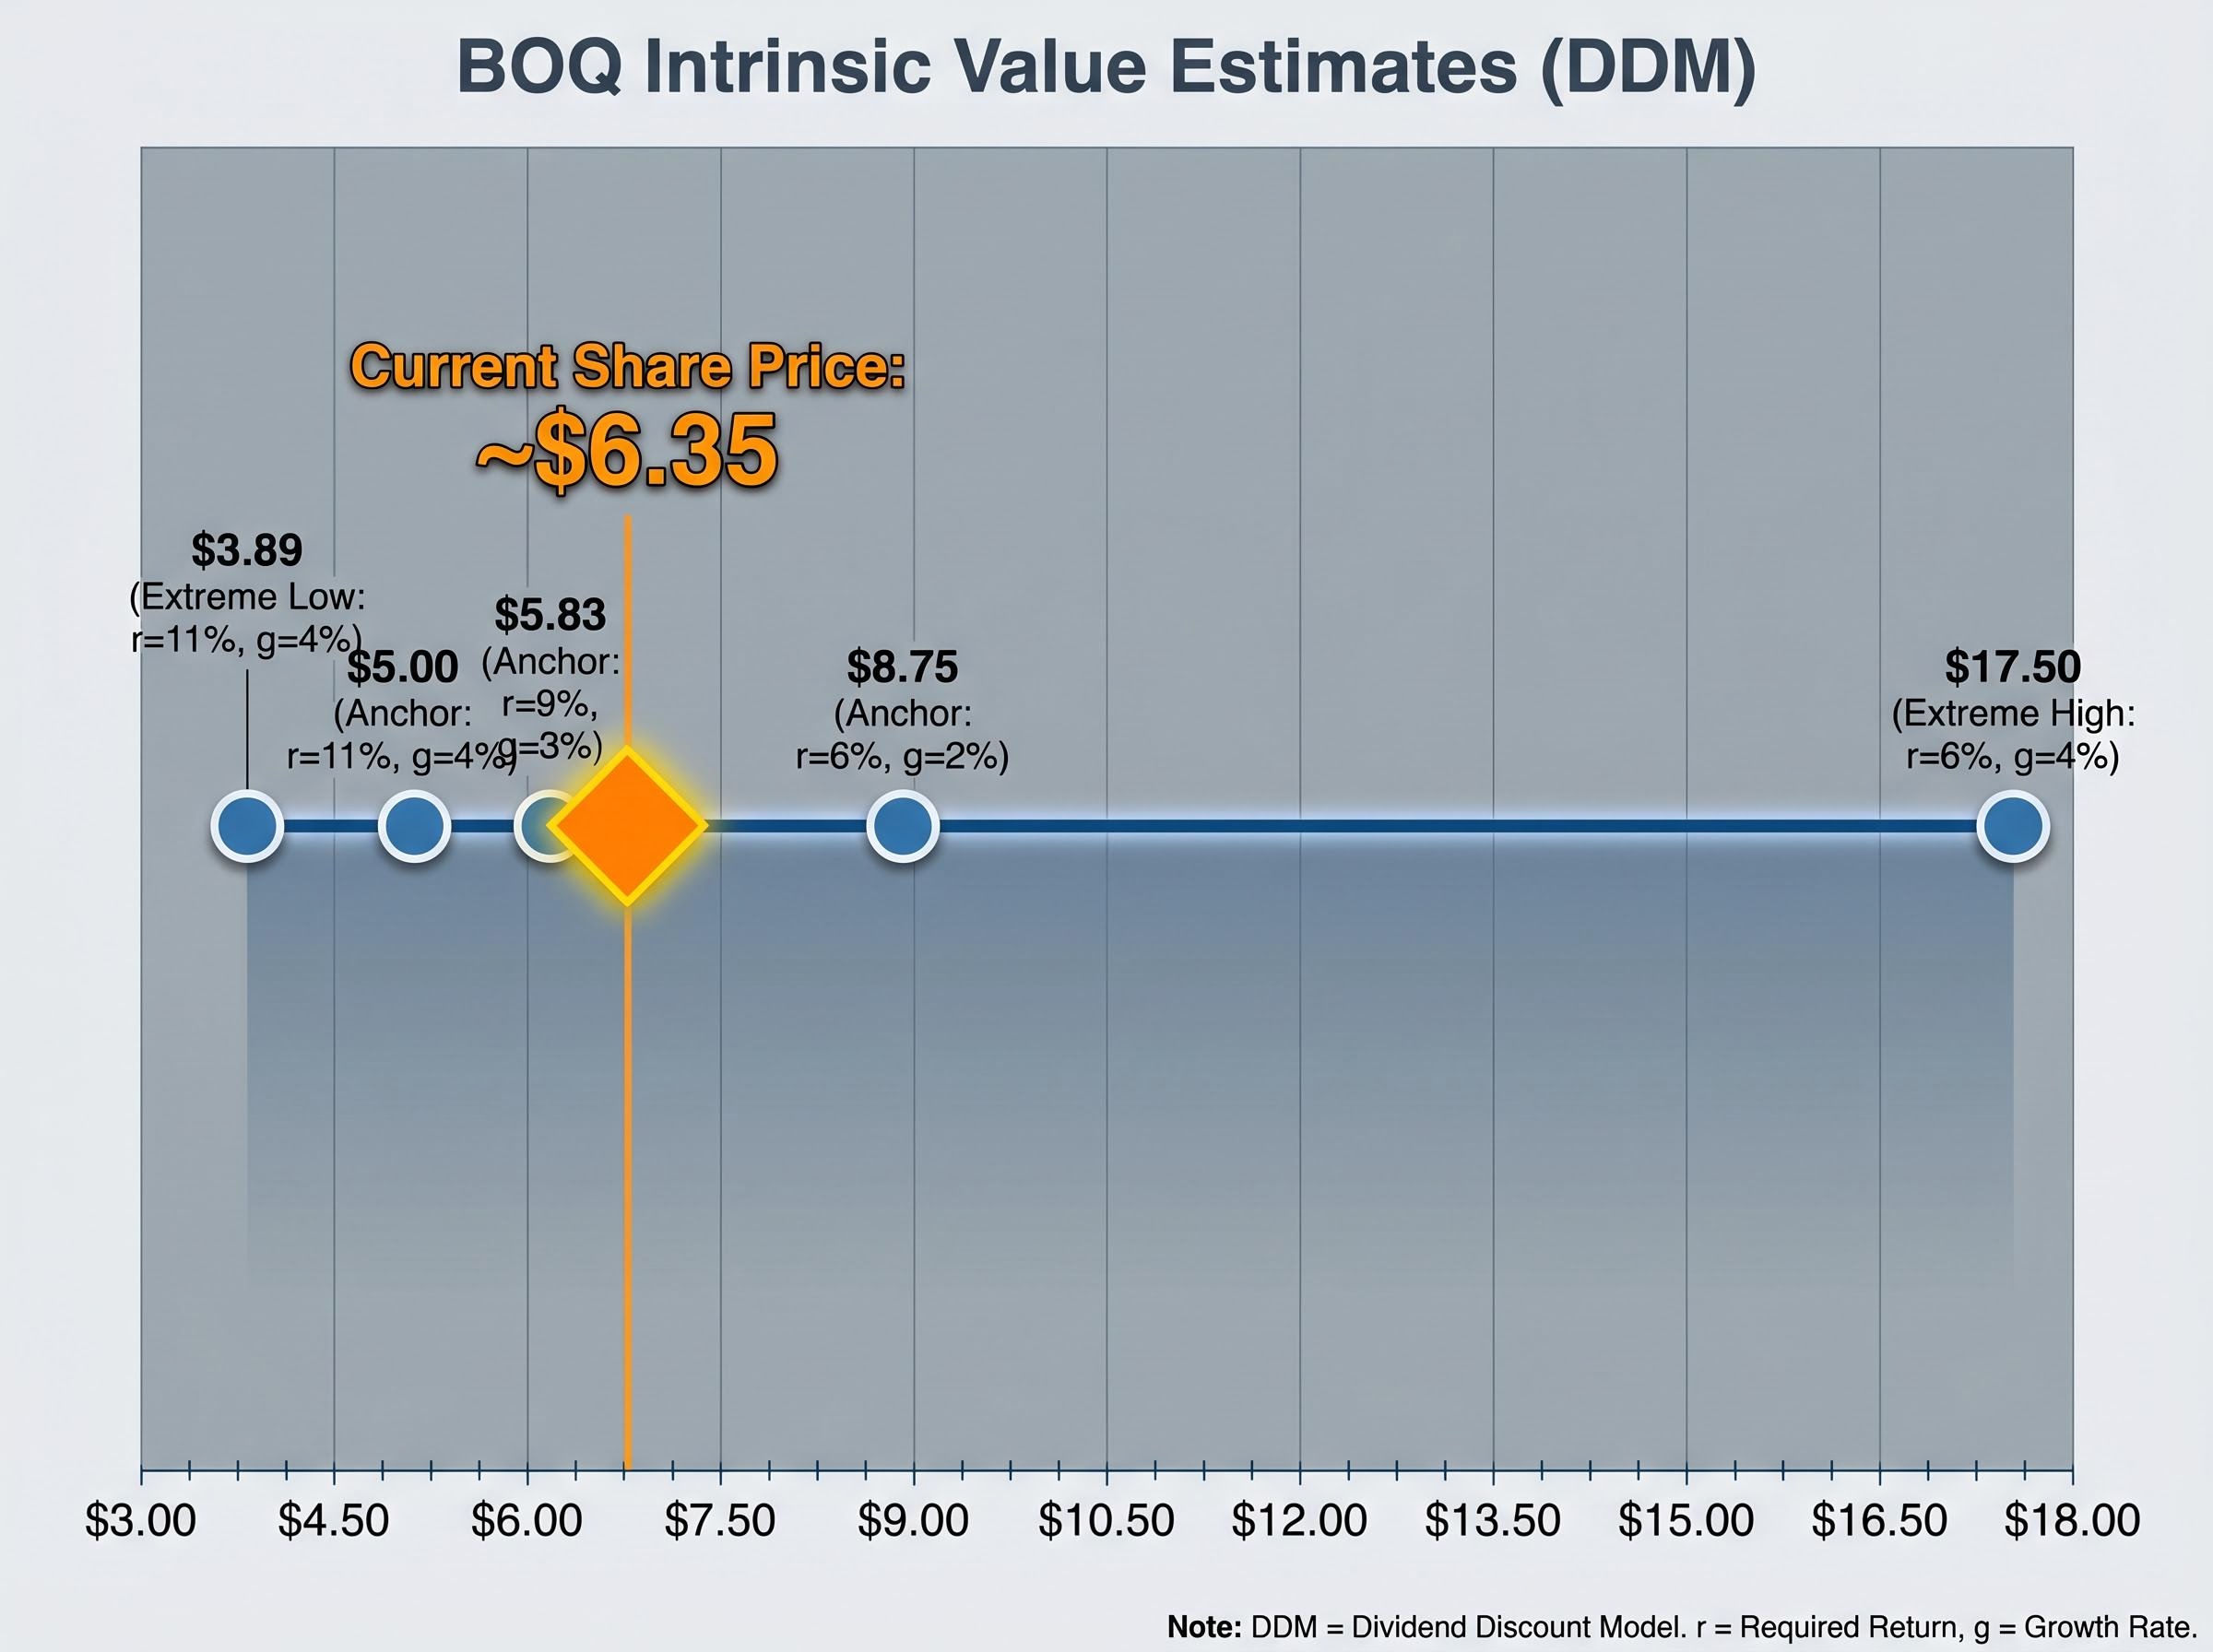
At the extremes, the model places BOQ at $17.50 (a 6% discount rate with 4% perpetual growth) or as low as $3.89 (an 11% discount rate with 4% growth, where the denominator compresses to just 7%). That is a spread of more than four to one, and every number in the table is arithmetically correct.
The DDM range for BOQ spans $3.89 to $17.50 per share. That is not model noise; it is the formula responding to different assumptions about risk and growth.
BOQ’s share price at time of publication sits at approximately $6.35. Some cells in the table produce values above that price; others produce values below it.
Reading the table: three anchor scenarios explained
At a 6% discount rate and 2% growth rate, the model outputs $8.75. This scenario implies a relatively low required return (consistent with an investor who views BOQ as carrying modest risk) and conservative growth expectations. The result sits above the current share price, suggesting the stock may be undervalued under those assumptions.
At a 9% discount rate and 3% growth rate, the output drops to $5.83, even though the assumed growth rate is higher. The higher discount rate more than offsets the additional growth because it enlarges the denominator faster than the growth rate shrinks it. This scenario implies a more demanding return hurdle, perhaps reflecting concerns about credit quality or earnings cyclicality, and places the stock above the current market price.
At an 11% discount rate and 4% growth rate, the estimated value falls to $5.00, below BOQ’s prevailing share price. The model here is not broken. It is reflecting a scenario in which the investor demands a high return for holding the stock, and even optimistic growth assumptions cannot generate enough present value to justify the current price. The DDM can signal potential overvaluation just as readily as undervaluation, depending entirely on the assumptions.
The recommended approach is to run multiple scenarios and consider the range rather than selecting a single point estimate that produces a convenient answer.
Where the DDM breaks down for Australian bank investors
The Gordon Growth Model requires dividends to grow at a constant rate indefinitely. For banks, whose earnings move with credit cycles, interest rate environments, and regulatory capital requirements, that assumption is structurally difficult to sustain.
The main limitation factors for Australian bank DDM analysis are:
- Credit cycle sensitivity: Bank earnings and dividends are materially affected by credit cycles, making a stable long-run growth rate difficult to estimate across a full cycle
- APRA capital constraints: The Australian Prudential Regulation Authority’s capital adequacy requirements can force banks to retain earnings rather than distribute them, even during profitable periods
- Net interest margin compression: Competitive and monetary policy pressures on NIMs affect earnings and therefore dividend capacity over time
- Payout ratio sustainability: High current dividend yields can be misleading when payout ratios are elevated or potentially unsustainable; overseas wholesale debt funding adds further earnings variability compared with domestic deposit funding
APRA’s capital adequacy standard APS 110 sets the framework under which authorised deposit-taking institutions must maintain minimum capital ratios, with distributions including dividends subject to restriction when a bank’s capital position falls within or below its regulatory buffer requirements.
Loan book growth rate serves as a useful monitoring metric in this context: too fast may signal excessive risk appetite, too slow may reflect overly conservative lending. Either extreme complicates the growth rate assumption feeding the DDM.
Australian analysts in 2024-2025, including those at Morningstar and Livewire Markets, predominantly use price-to-earnings (P/E), price-to-book (P/B), and excess return on equity models for ASX bank valuation rather than a standalone Gordon Growth DDM. That preference pattern reflects the concerns above.
Using DDM alongside P/E and P/B for a more complete picture
The DDM becomes more useful when treated as one input among several rather than a standalone answer. As a cross-check, BOQ’s FY24 earnings per share of $0.41 multiplied by a sector average P/E of 18x implies a sector-adjusted value of approximately $7.46, a figure that sits within the DDM’s mid-range scenarios.
Convergence across multiple methods (DDM, P/E, P/B) increases conviction in a valuation estimate. Divergence is a signal to examine assumptions more carefully rather than to choose whichever method produces the preferred answer.
P/E and DDM convergence carries more analytical weight than any single method alone, a pattern visible in the CBA illustrative example where a sector-adjusted PE fair value of approximately $101.54 and a grossed-up DDM estimate of approximately $143.80 both sit below the prevailing share price, with the gap between the two methods then becoming the subject of further investigation rather than a reason to dismiss one output.
The DDM is a lens, not a calculator: what BOQ’s valuation range tells investors
The DDM’s sensitivity to its inputs is not a flaw to be managed. It is the model’s most important feature. By forcing the investor to specify a discount rate and a growth rate, the model makes explicit what might otherwise remain an unstated assumption: what do you actually believe about this company’s risk and its future?
Running multiple scenarios and reading the output as a range, rather than selecting the single set of assumptions that produces the most convenient number, is a more intellectually honest process. The worked BOQ example demonstrates this. The DDM range spans $3.89 to $17.50 using cash dividends, and the grossed-up scenario pushes the midpoint higher (the $10.57 estimate versus the $7.40 cash-only base case). The current share price of approximately $6.35 sits within that range, meaning the model does not clearly signal overvaluation or undervaluation. It signals that the answer depends on the investor’s assumptions.
For readers applying this framework, the practical takeaway is a three-step process:
- Identify the grossed-up dividend by adding the franking credit to the cash dividend for the relevant financial year
- Construct a sensitivity table across a plausible range of discount rates and growth rates, informed by the investor’s own view of the company’s risk profile and earnings trajectory
- Compare the scenario range to the current market price and ask which scenario the market appears to be pricing, and which scenario the investor is implicitly betting on
Valuation is a starting point for analysis, not an endpoint. The DDM output must be set alongside balance sheet indicators, loan book quality, funding mix, and qualitative judgements about management and strategy.
For investors ready to layer quantitative model outputs with macro-level inputs, our comprehensive walkthrough of ASX bank valuation beyond the DDM covers how RBA rate path data, CoreLogic property trends, APRA arrears statistics, and each bank’s strategic execution track record interact with the numerical outputs of PE and DDM models to form a conviction view on Australian bank shares.
This article is for informational purposes only and should not be considered financial advice. Investors should conduct their own research and consult with financial professionals before making investment decisions.
Past performance does not guarantee future results. Financial projections are subject to market conditions and various risk factors.