
ASX bank shares collectively account for roughly one-third of the Australian equity market by capitalisation. They sit in more portfolios than almost any other sector. Yet most retail investors who hold them would struggle to explain whether the current price is cheap, fair, or expensive. The gap between ownership and understanding is wide, and it matters. Bank valuation sits at the intersection of two disciplines: the numerical mechanics of PE ratios and dividend discount models, and the qualitative judgment required to assess management quality, regulatory exposure, and sustainable dividend capacity. Neither alone is sufficient. This guide walks through both disciplines in sequence, using ASX banking sector data as illustrative examples. By the end, readers will have a reusable framework for evaluating any ASX bank stock, including how to build a dividend discount model (DDM) sensitivity table, account for franking credits, and stress-test assumptions across different discount and growth rate scenarios.
Why bank shares need their own valuation playbook
The instinct is understandable: a bank is a company, a company has earnings, and earnings can be valued. But banks are structurally unlike industrial or technology businesses in ways that change which valuation tools work and which ones mislead.
The most fundamental difference is that a bank’s inventory is money itself. Traditional free-cash-flow models, designed for companies that manufacture products or deliver services, become less reliable when the core business involves borrowing and lending capital. Dividend-centric approaches suit the sector better.
Three features make bank valuation distinctive:
- Money as inventory. Banks earn returns on the spread between borrowing and lending rates, not on manufacturing margins, making cash flow definitions less intuitive.
- High, regulated payout ratios. The Big Four generally distribute 65-75% of cash earnings as dividends, creating more predictable income streams than most other ASX sectors.
- Capital adequacy constraints. APRA’s prudential framework directly limits how much profit can leave the business, meaning regulatory developments are inseparable from dividend forecasting.
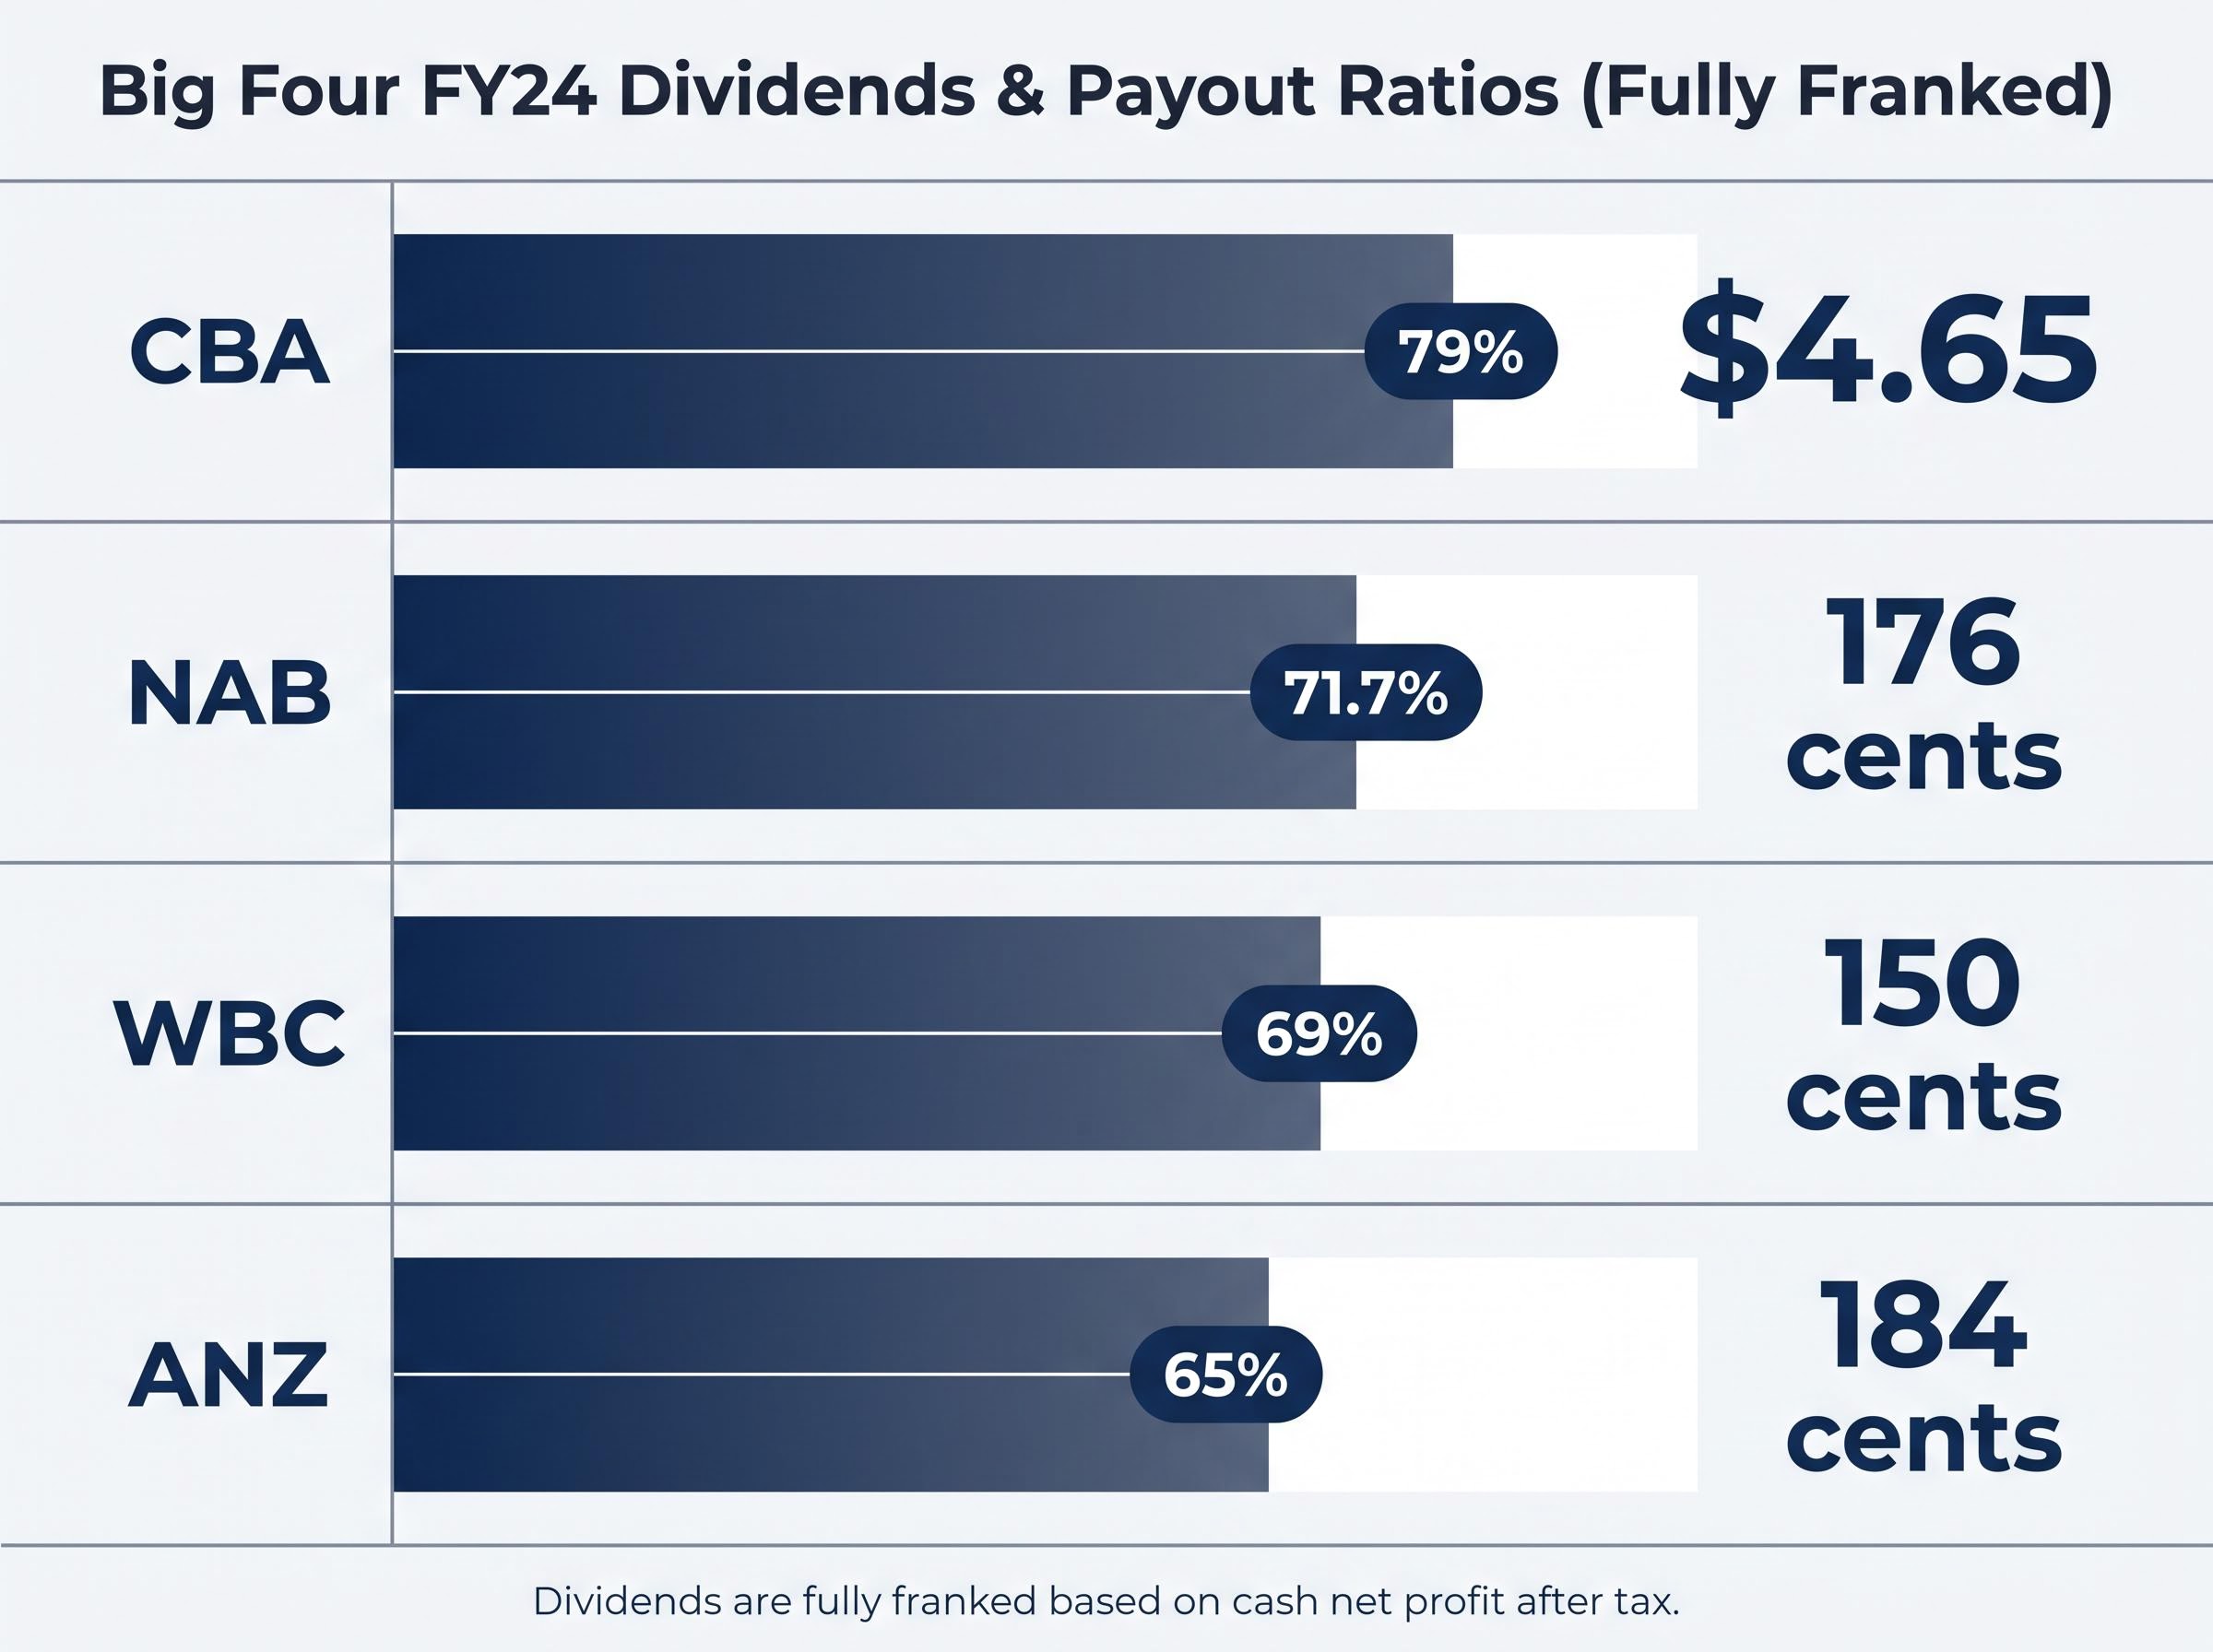
The Big Four’s FY24 payout ratios illustrate the point. CBA distributed 79% of cash net profit after tax, NAB paid out 71.7%, WBC returned 69%, and ANZ distributed 65%. These ratios reflect deliberate policy shaped by regulatory requirements, not discretionary generosity.
The APRA constraint every valuation must account for
The Australian Prudential Regulation Authority (APRA) operates an “unquestionably strong” Common Equity Tier 1 (CET1) capital framework that effectively caps how much profit exits as dividends. APRA is an implicit participant in every DDM model an investor builds.
The CBA capital adequacy position illustrates how the APRA constraint operates in practice: with a CET1 ratio of 11.6% sitting 110 basis points above the regulatory minimum, the buffer available for dividend distribution is real but bounded, and any quarter in which risk-weighted assets expand faster than retained earnings compresses that headroom further.
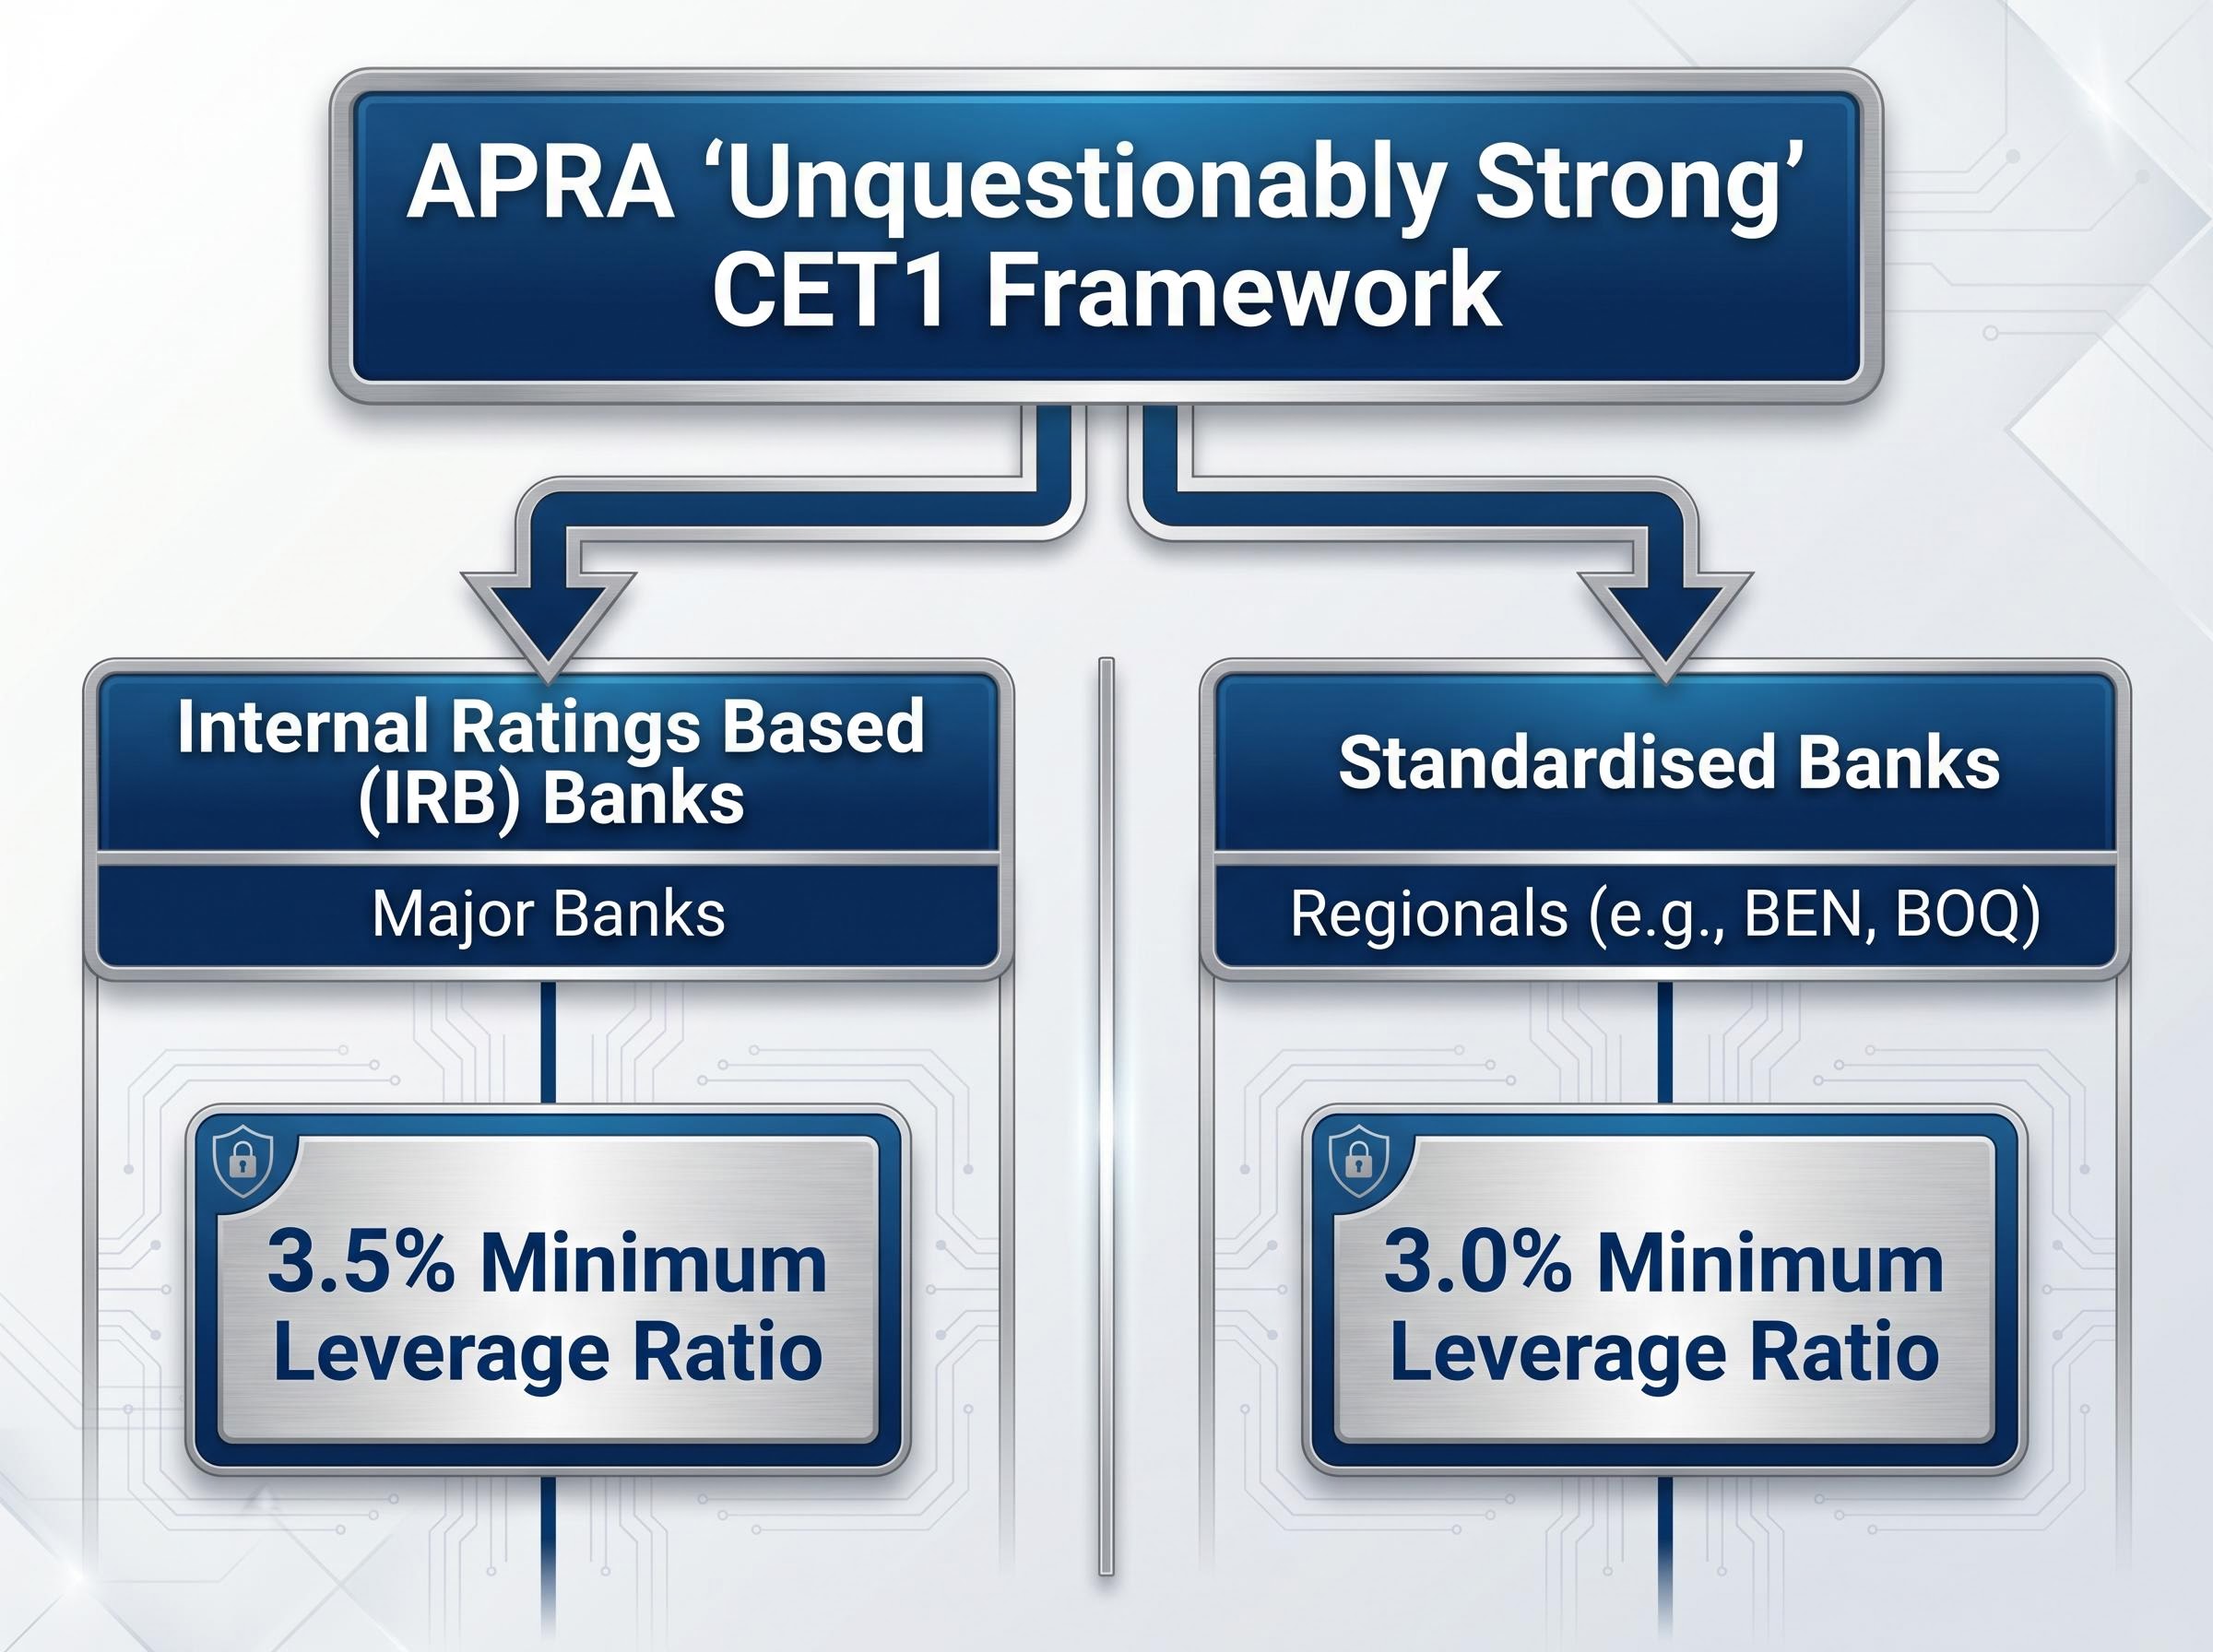
The constraint operates differently across the sector. Internal Ratings Based (IRB) banks, meaning the major banks, face a minimum leverage ratio of 3.5%. Standardised banks, including regionals such as Bendigo and Adelaide Bank (BEN) and Bank of Queensland (BOQ), face a 3.0% minimum. These differing requirements affect sustainable dividend capacity, and by extension, valuation inputs, at each tier of the sector.
APRA Prudential Standard APS 110 codifies the capital adequacy requirements that sit beneath every dividend forecast for Australian authorised deposit-taking institutions, specifying the minimum CET1 ratios and leverage requirements that determine how much profit can leave each institution as a distribution.
When big ASX news breaks, our subscribers know first
Reading PE ratios across the banking sector
The price-to-earnings ratio, calculated by dividing the share price by earnings per share, is the fastest way to gauge how the market prices a bank’s profitability relative to its peers. The logic is mean-reversion: similarly positioned companies should, in theory, trade at comparable multiples. When one does not, the gap raises a question worth answering.
BEN provides a useful worked example. With a share price of $10.46 and FY24 earnings per share (EPS) of $0.87, BEN traded on a PE multiple of approximately 12x. The broader ASX banking sector average PE sat at approximately 18x. Multiplying BEN’s EPS by the sector-average PE produces a sector-adjusted valuation of approximately $15.84 per share, well above the market price.
| Bank | Share Price | FY24 EPS | Own PE (Approx.) | Sector-Adjusted Valuation |
|---|---|---|---|---|
| BEN | $10.46 | $0.87 | ~12x | ~$15.84 |
| CBA | — | — | ~19x* | — |
| WBC | — | — | ~13x* | — |
| NAB | — | — | ~13x* | — |
| ANZ | — | — | ~12x* | — |
Forward PE figures are indicative and should be verified against current broker research or live market data. FY25 results are now available or imminent for all major banks.
Does this mean BEN is undervalued? Not necessarily. The PE ratio is a relative tool, not an absolute verdict. The gap may reflect legitimate differences in franchise quality, return on equity, or growth outlook.
Applying a sector-average PE mechanically to every bank assumes equivalent franchise quality. CBA’s premium of approximately 19x, compared to 12-13x for most peers, demonstrates why that assumption fails. The market pays more for CBA’s return stability, digital leadership, and franchise durability. Mechanically applying the sector average to CBA would undervalue the moat; mechanically applying it to a regional may overstate it.
The PE ratio raises the right questions. It does not, on its own, answer them.
How the dividend discount model works for bank shares
If the PE ratio asks “how does the market price this bank’s earnings?”, the DDM asks a different and more personal question: “what is this income stream worth to me?”
The Gordon Growth Model, the most common form of DDM, translates that question into a formula. A bank’s share value equals the annual dividend divided by the difference between the investor’s required return (the discount rate) and the expected long-run dividend growth rate.
Building one from scratch involves four steps:
- Identify the base dividend. Use the most recent full-year dividend per share, sourced directly from the company’s ASX announcement.
- Select a discount rate. This represents the annual return the investor requires to justify holding the stock.
- Select a growth rate. This is the rate at which dividends are expected to grow indefinitely.
- Apply the formula. Divide the base dividend by the discount rate minus the growth rate.
For BEN, using a base dividend of $0.61, a discount rate of 9%, and a growth rate of 3%, the DDM yields approximately $10.17 (that is, $0.61 divided by 0.06). Using an adjusted forecast dividend of $0.65, the output rises to approximately $10.83. The denominator, 0.06 in the base case, functions as a capitalisation rate; the smaller it gets, the higher the valuation, which is why small assumption changes produce large output swings.
Choosing a discount rate that reflects today’s environment
The discount rate anchors the entire model. With the 10-year Commonwealth Government Securities yield sitting at approximately 4%, and the equity risk premium for bank shares historically averaging 4-6 percentage points above the risk-free rate, discount rates below 8.5% are difficult to justify in the current environment.
Market commentary places the appropriate cost of equity for the Big Four at approximately 8.5-10% and for regionals at 9.5-10% or higher, reflecting the post-rate-hike shift from pre-COVID ranges of 7-8%. The difference between major and regional banks reflects the regionals’ standardised capital treatment, narrower diversification, and higher earnings volatility.
Franking credits and why they change the DDM calculation
Australian bank dividends carry a feature that makes them structurally more valuable than they first appear. Franking credits, formally known as imputation credits, represent the corporate tax a company has already paid on the profits it distributes. When a company pays a fully franked dividend, eligible shareholders receive a tax offset equal to 30% (the corporate tax rate) of the pre-tax equivalent, effectively “grossing up” the dividend’s value.
The mechanics are straightforward. For a fully franked dividend of $0.63, the grossed-up value is $0.63 divided by (1 minus 0.30), which equals $0.90. Using a slightly adjusted gross dividend of $0.93 per share (as cited in market commentary) and applying the same DDM parameters of a 9% discount rate and 3% growth rate, the franking-adjusted DDM yields approximately $15.50.
The difference between the cash-only DDM and the grossed-up DDM is material. For Australian investors, particularly self-managed superannuation funds in pension phase paying 0% tax, the full franking benefit flows through. Higher-rate taxpayers receive a partial benefit. Foreign investors receive none.
Franking credit eligibility rules introduce a wrinkle that the DDM formula does not automatically accommodate: to qualify for both the cash dividend and the attached credit, investors must hold shares genuinely at risk for a minimum of 45 days around the ex-dividend date, a condition that affects active traders and anyone who rotates into high-yield positions specifically around dividend periods.
All Big Four FY24 dividends were disclosed as fully franked: CBA at $4.65 per share, NAB at 176 cents, WBC at 150 cents, ANZ at 184 cents, and BEN at 61 cents.
| Discount Rate | 2% Growth | 3% Growth | 4% Growth |
|---|---|---|---|
| 6% | $15.75 | $21.00 | $31.50 |
| 7% | $12.60 | $15.75 | $21.00 |
| 8% | $10.50 | $12.60 | $15.75 |
| 9% | $9.00 | $10.50 | $12.60 |
| 10% | $7.88 | $9.00 | $10.50 |
| 11% | $7.00 | $7.88 | $9.00 |
Sensitivity outputs assume a $0.61 base dividend and are illustrative only. Grossed-up DDM outputs will be higher for eligible Australian taxpayers. Verify current dividend data against ASX announcements.
The franking-adjusted DDM output is not a “buy signal” in isolation. When a model suggests a value materially above the market price, the first response should be to interrogate why the market disagrees, not to assume the market is wrong.
Stress-testing your assumptions before you trust the numbers
A DDM produces a single number. That precision is seductive and misleading. Small changes in the discount rate and growth rate produce disproportionately large swings in output, and the sensitivity table above demonstrates exactly how large.
At a 6% discount rate and 2% growth, the BEN model yields $15.75. At 11% discount and 4% growth, it drops to $9.00. That range spans more than the actual market price. Both outputs use the same base dividend. The only difference is two assumptions the investor must choose.
The growth rate assumption deserves the most aggressive scrutiny. Sustainable long-run dividend growth for Australian banks is constrained by credit growth, net interest margin compression, and APRA capital requirements. Market commentary suggests real dividend growth of approximately 2-3% as a ceiling for the mature majors. Assuming perpetual growth above this level, without a specific catalyst to justify it, flatters the model and misleads the investor.
The four most common DDM assumption errors are:
- Using a discount rate below 8.5% in the current yield environment, which understates the required return for holding bank equity.
- Assuming perpetual dividend growth above historical GDP growth, which implies the bank will capture an ever-larger share of the economy.
- Ignoring capital buffer constraints on payout ratios, which treats dividends as uncapped when APRA’s framework places an effective ceiling.
- Treating headline EPS as equivalent to sustainable earnings, which overlooks “recurring one-off items” such as remediation charges, notable items, and write-downs that inflate the normalised figure.
APRA capital adequacy standards establish the effective ceiling on payout ratios by requiring banks to maintain specified CET1 buffers above minimum thresholds before discretionary distributions are approved, which is why regulatory developments translate directly into dividend forecast revisions.
Readers should return to the sensitivity table in the previous section and identify where their own assumptions sit. If the preferred scenario produces a valuation that looks too good, that is exactly the scenario to stress-test hardest.
The numbers are a starting point, not a verdict
Two banks with identical PE ratios and DDM outputs can be fundamentally different investments. The difference lies in what the numbers cannot capture: the quality of capital allocation, risk culture, regulatory conduct, and management transparency.
The qualitative dimensions of bank valuation, covering management credibility, loan-book discipline, net interest margin durability, and governance culture, determine whether the earnings and dividend assumptions built into any model will hold up across a full reporting cycle, and they cannot be derived from the financial statements alone.
Quantitative analysis identifies candidates. Qualitative due diligence determines whether those candidates deserve capital.
Red flags that should make you revisit your model inputs
The following checklist provides a practical framework for assessing management quality and identifying warning signs that should prompt a revision of growth rate or discount rate assumptions:
- Capital allocation track record. Examine at least three years of acquisition, divestment, and buyback decisions for consistency between stated strategy and actual deployment.
- Return on equity trend versus cost of equity. A bank consistently generating ROE below its cost of equity is destroying shareholder value regardless of the dividend yield it pays.
- Frequency of “notable items.” Recurring remediation charges, write-downs, or one-off adjustments that appear in multiple reporting periods suggest normalised earnings may be lower than headline figures indicate.
- APRA or ASIC enforcement actions. Regulatory findings signal risk culture failures that may not yet be reflected in the share price.
- Executive team stability. High turnover at senior levels can indicate strategic drift or internal dysfunction.
- IT and digital execution. Failed or delayed core banking transformations increase cost-to-income ratios and erode competitive positioning.
- Results presentation transparency. Review analyst Q&A sessions and assess whether management answers questions directly or deflects. Consistent deflection is a warning sign.
- Customer satisfaction data. Net Promoter Score (NPS) trends and industry rankings serve as a directional indicator of franchise durability.
Actively seeking perspectives that challenge an investment thesis, including analyst downgrades, short-seller research, and critical commentary, is a discipline that identifies errors before capital is committed. Recording research notes and forming a written thesis against which future results can be measured turns qualitative assessment from a one-off exercise into a repeatable process.
A reusable framework for every ASX bank you evaluate
The value of this guide is not any single number. It is the repeatable process. The following five-step framework applies to any ASX bank stock:
- Calculate the PE ratio and compare to the sector. Identify whether the stock trades at a premium or discount to peers, and investigate why.
- Build a base DDM using the latest full-year dividend. Source the dividend figure directly from the company’s ASX announcement, not secondary sources.
- Adjust for franking credits. Gross up the dividend to reflect the after-tax value for eligible Australian investors.
- Build a sensitivity table across discount rate and growth rate ranges. Use at least three discount rates and three growth rates to map the output range.
- Overlay the qualitative due diligence checklist. No model output should inform a decision until it has passed through the management quality filter.
When the PE-implied valuation, the base DDM, and the grossed-up DDM all point in the same direction, conviction is higher. When they diverge materially, the investor’s job is to understand why before acting.
For FY25 results, the current reporting cycle as of May 2026, updated dividend and EPS figures are available or imminent for all major banks. Valuations built on FY24 data are now one full results cycle old. Investors should update their models with each annual result and source current data from ASX announcements directly for accuracy.
Bank share valuation rewards process more than prediction
No valuation model predicts the future. The DDM and PE ratio are tools for structuring judgment, not replacing it. A model that produces a precise number creates an illusion of certainty that the inputs do not support. The investor’s edge lies not in the number itself but in the rigour of the process that produced it.
Treating the first application of this framework as a learning exercise rather than a trading decision is a reasonable approach. Building the model, recording the assumptions, and then revisiting the outputs against actual results over subsequent reporting periods is how the process compounds into genuine analytical skill.
For current data, ASX announcements remain the primary source for dividend and earnings figures. APRA publications provide regulatory context. Current broker research offers updated forward PE multiples. None of these sources should be substituted with secondary summaries when the investment decision is real.
This article is for informational purposes only and should not be considered financial advice. Investors should conduct their own research and consult with financial professionals before making investment decisions. Past performance does not guarantee future results. Financial projections are subject to market conditions and various risk factors.