Thirty-three ASX-listed securities are flashing technical downtrend signals as of 20 May 2026, with 15 of them showing selling pressure severe enough to warrant special attention. The losses are steep: Dimerix is down 66% over one year, Boss Energy has fallen 69%, and WiseTech Global has shed 62%. These are not isolated cases. Elevated interest rates, commodity price reversals, consumer spending headwinds, and post-COVID earnings normalisation are conspiring to keep supply-side pressure locked in across multiple ASX sectors simultaneously. What follows is a breakdown of every stock flagged by the scan, a sector-by-sector look at the 15 names under the most intense selling pressure, the macro forces driving the weakness, and a practical framework for using downtrend signals to manage portfolio risk.
What the ASX downtrend scan actually measures
The scan is a systematic, trend-following technical analysis screen. It identifies securities where price action has moved into a sustained downtrend based on chart-based criteria, not fundamental valuation models or personalised financial advice. As of 20 May 2026, 33 ASX-listed securities met the downtrend criteria, with 15 specifically flagged as “feature downtrend charts,” meaning they exhibit the strongest supply-side conditions.
The methodology is curated by Carl Capolingua, Senior Editor at Market Index, who draws on over 30 years of investing experience. Scan data published on 20 May 2026 reflects chart analysis dated 19 May 2026.
Investors typically apply the scan in four ways:
Short-selling confirmed downtrends is one of the four stated applications of the scan, and institutional short sellers have shown a consistent pattern of adding positions into post-earnings selloffs rather than exiting them, using downgrade momentum as an entry signal once price action has already confirmed the trend direction.
- Avoiding new positions in stocks showing confirmed downtrends
- Exiting existing holdings where the trend has turned against them
- Short-selling confirmed downtrends (for those with the risk appetite and tools)
- Using the list as a risk management filter when reviewing sector or portfolio allocation
A stock appearing on this list is a signal about price-trend momentum. It is not a verdict on the underlying business’s long-term value, and the distinction matters when deciding how to respond.
When big ASX news breaks, our subscribers know first
The full downtrend list: all 33 ASX securities flagged on 20 May 2026
The table below presents every security that met the downtrend criteria. The first 15 entries are the “feature downtrend” stocks, those showing the most intense supply-side conditions. The remaining 18 are additional names on the broader list. Investors can use this as a quick reference to check whether a stock they hold or are watching has been flagged.
| Ticker | Company Name | Price (AUD) | 1-Month Change | 1-Year Change |
|---|---|---|---|---|
| Feature downtrend stocks (15) | ||||
| 360 | Life360 | $18.00 | -19.9% | -40.2% |
| ARB | ARB Corporation | $17.53 | -12.4% | -45.3% |
| C79 | Chrysos | On list | ||
| CAT | Catapult Sports | $2.88 | -12.2% | -31.6% |
| CXL | Calix | On list | ||
| DXB | Dimerix | $0.200 | -47.4% | -66.4% |
| EBR | EBR Systems | $0.505 | -22.3% | -53.7% |
| FLT | Flight Centre | $9.98 | -15.6% | -26.6% |
| GLF | Gulf Manganese | On list | ||
| GNC | GrainCorp | $4.87 | -22.7% | -36.6% |
| HUM | Humm Group | On list | ||
| QOR | Qoria | $0.245 | -22.2% | -38.8% |
| SDR | SiteMinder | $2.77 | -16.6% | -37.0% |
| SHL | Sonic Healthcare | $18.43 | -9.3% | -30.7% |
| SNL | Supply Network | On list | ||
| Additional downtrend stocks (18) | ||||
| APE | Eagers Automotive | On list | ||
| APX | Appen | On list | ||
| ASG | Autosports Group | On list | ||
| AUC | Ausgold | On list | ||
| BCI | BCI Minerals | On list | ||
| BOE | Boss Energy | $1.255 | -25.1% | -68.7% |
| BTR | Brightstar Resources | On list | ||
| CHN | Chalice Mining | On list | ||
| IDX | Integral Diagnostics | On list | ||
| JBH | JB Hi-Fi | $70.62 | On list | |
| KPG | Kelly Partners | $4.09 | -13.3% | -62.8% |
| LOV | Lovisa | On list | ||
| MEK | Meeka Metals | On list | ||
| MGX | Mount Gibson Iron | On list | ||
| PEN | Peninsula Energy | $0.365 | -33.1% | -62.0% |
| PPS | Praemium | On list | ||
| WEB | Webjet | $2.38 | -17.4% | -47.5% |
| WTC | WiseTech Global | $38.12 | -16.2% | -62.4% |
The full list offers a starting framework for further due diligence. The next section zooms in on the 15 feature downtrend names, grouped by sector, to show what is driving each one lower.
The 15 stocks with the most intense selling pressure, broken down by sector
The 15 feature downtrend stocks are not spread randomly across the market. They cluster around a handful of sectors, and those clusters tell a story about the thematic forces behind the weakness.
Biotech
- Dimerix (DXB): $0.200, -47.4% one-month, -66.4% one-year. Clinical trial uncertainty around its kidney disease programme and small-cap funding risk in a hostile environment for pre-revenue biotechs have driven one of the steepest declines on the list.
- EBR Systems (EBR): $0.505, -22.3% one-month, -53.7% one-year. Another clinical-stage name under pressure from tighter capital markets and investor caution toward pre-profit medical device companies.
Dimerix’s -47.4% single-month decline makes it the most severe one-month performer on the entire 33-stock list, a pace of selling that reflects concentrated small-cap liquidity risk more than gradual sentiment erosion.
Resources and uranium
- Boss Energy (BOE): $1.255, -25.1% one-month, -68.7% one-year. The post-rally uranium price reversal, combined with higher FY27 cost guidance and slower-than-hoped ramp-up progress at the Honeymoon project, has compressed what broker commentary repeatedly described as a “priced for perfection” valuation.
- Peninsula Energy (PEN): $0.365, -33.1% one-month, -62.0% one-year. Lance project restart delays in Wyoming, ongoing balance sheet constraints, and the added complexity of US federal permitting have compounded the broader uranium sell-off.
Uranium sector headwinds extend well beyond Boss Energy and Peninsula Energy: short interest in Lotus Resources reached 16.01% as of 12 May 2026, the highest on the ASX, with professional short sellers continuing to build positions long after the initial price shock, underscoring how persistent the supply-side pressure across uranium names has become.
Technology and SaaS
- WiseTech Global (WTC): $38.12, -16.2% one-month, -62.4% one-year. Rates-driven multiple compression has hit one of the ASX’s most richly valued software names, with investors taking profits after multi-year outperformance and questioning the sustainability of premium pricing for its CargoWise platform.
- SiteMinder (SDR): $2.77, -16.6% one-month, -37.0% one-year. Persistent operating losses and thin profitability have made SDR a casualty of investor rotation away from long-duration growth names as bond yields rose.
- Life360 (360): $18.00, -19.9% one-month, -40.2% one-year.
- Qoria (QOR): $0.245, -22.2% one-month, -38.8% one-year.
- Catapult Sports (CAT): $2.88, -12.2% one-month, -31.6% one-year.
- Kelly Partners (KPG): $4.09, -13.3% one-month, -62.8% one-year.
Travel
- Flight Centre (FLT): $9.98, -15.6% one-month, -26.6% one-year. Post-pandemic normalisation, compressed margins, and weakening consumer confidence around discretionary travel spending have weighed on the stock.
- Webjet (WEB): $2.38, -17.4% one-month, -47.5% one-year. Macro spending pressure and competitive headwinds from global online travel agencies and direct airline booking channels continue to erode commission margins.
Consumer discretionary
- ARB Corporation (ARB): $17.53, -12.4% one-month, -45.3% one-year. Slower discretionary spending under higher rates, margin compression from input-cost inflation and currency movements, and a softer 4WD/SUV market compared with the post-COVID boom have driven a sustained de-rating.
Healthcare and agriculture
- Sonic Healthcare (SHL): $18.43, -9.3% one-month, -30.7% one-year. COVID testing revenue has normalised, and modest underlying volume growth in pathology and imaging has left SHL re-rating on lower, normalised earnings.
- GrainCorp (GNC): $4.87, -22.7% one-month, -36.6% one-year. Profits are normalising lower after several bumper crop seasons, while weather variability and rising logistics costs add to the negative sentiment.
Why so many ASX stocks are falling at the same time
The sector-level weakness is not coincidence. Five macro forces are bearing down on the ASX simultaneously, and the stocks appearing on the downtrend scan are the ones most exposed to them:
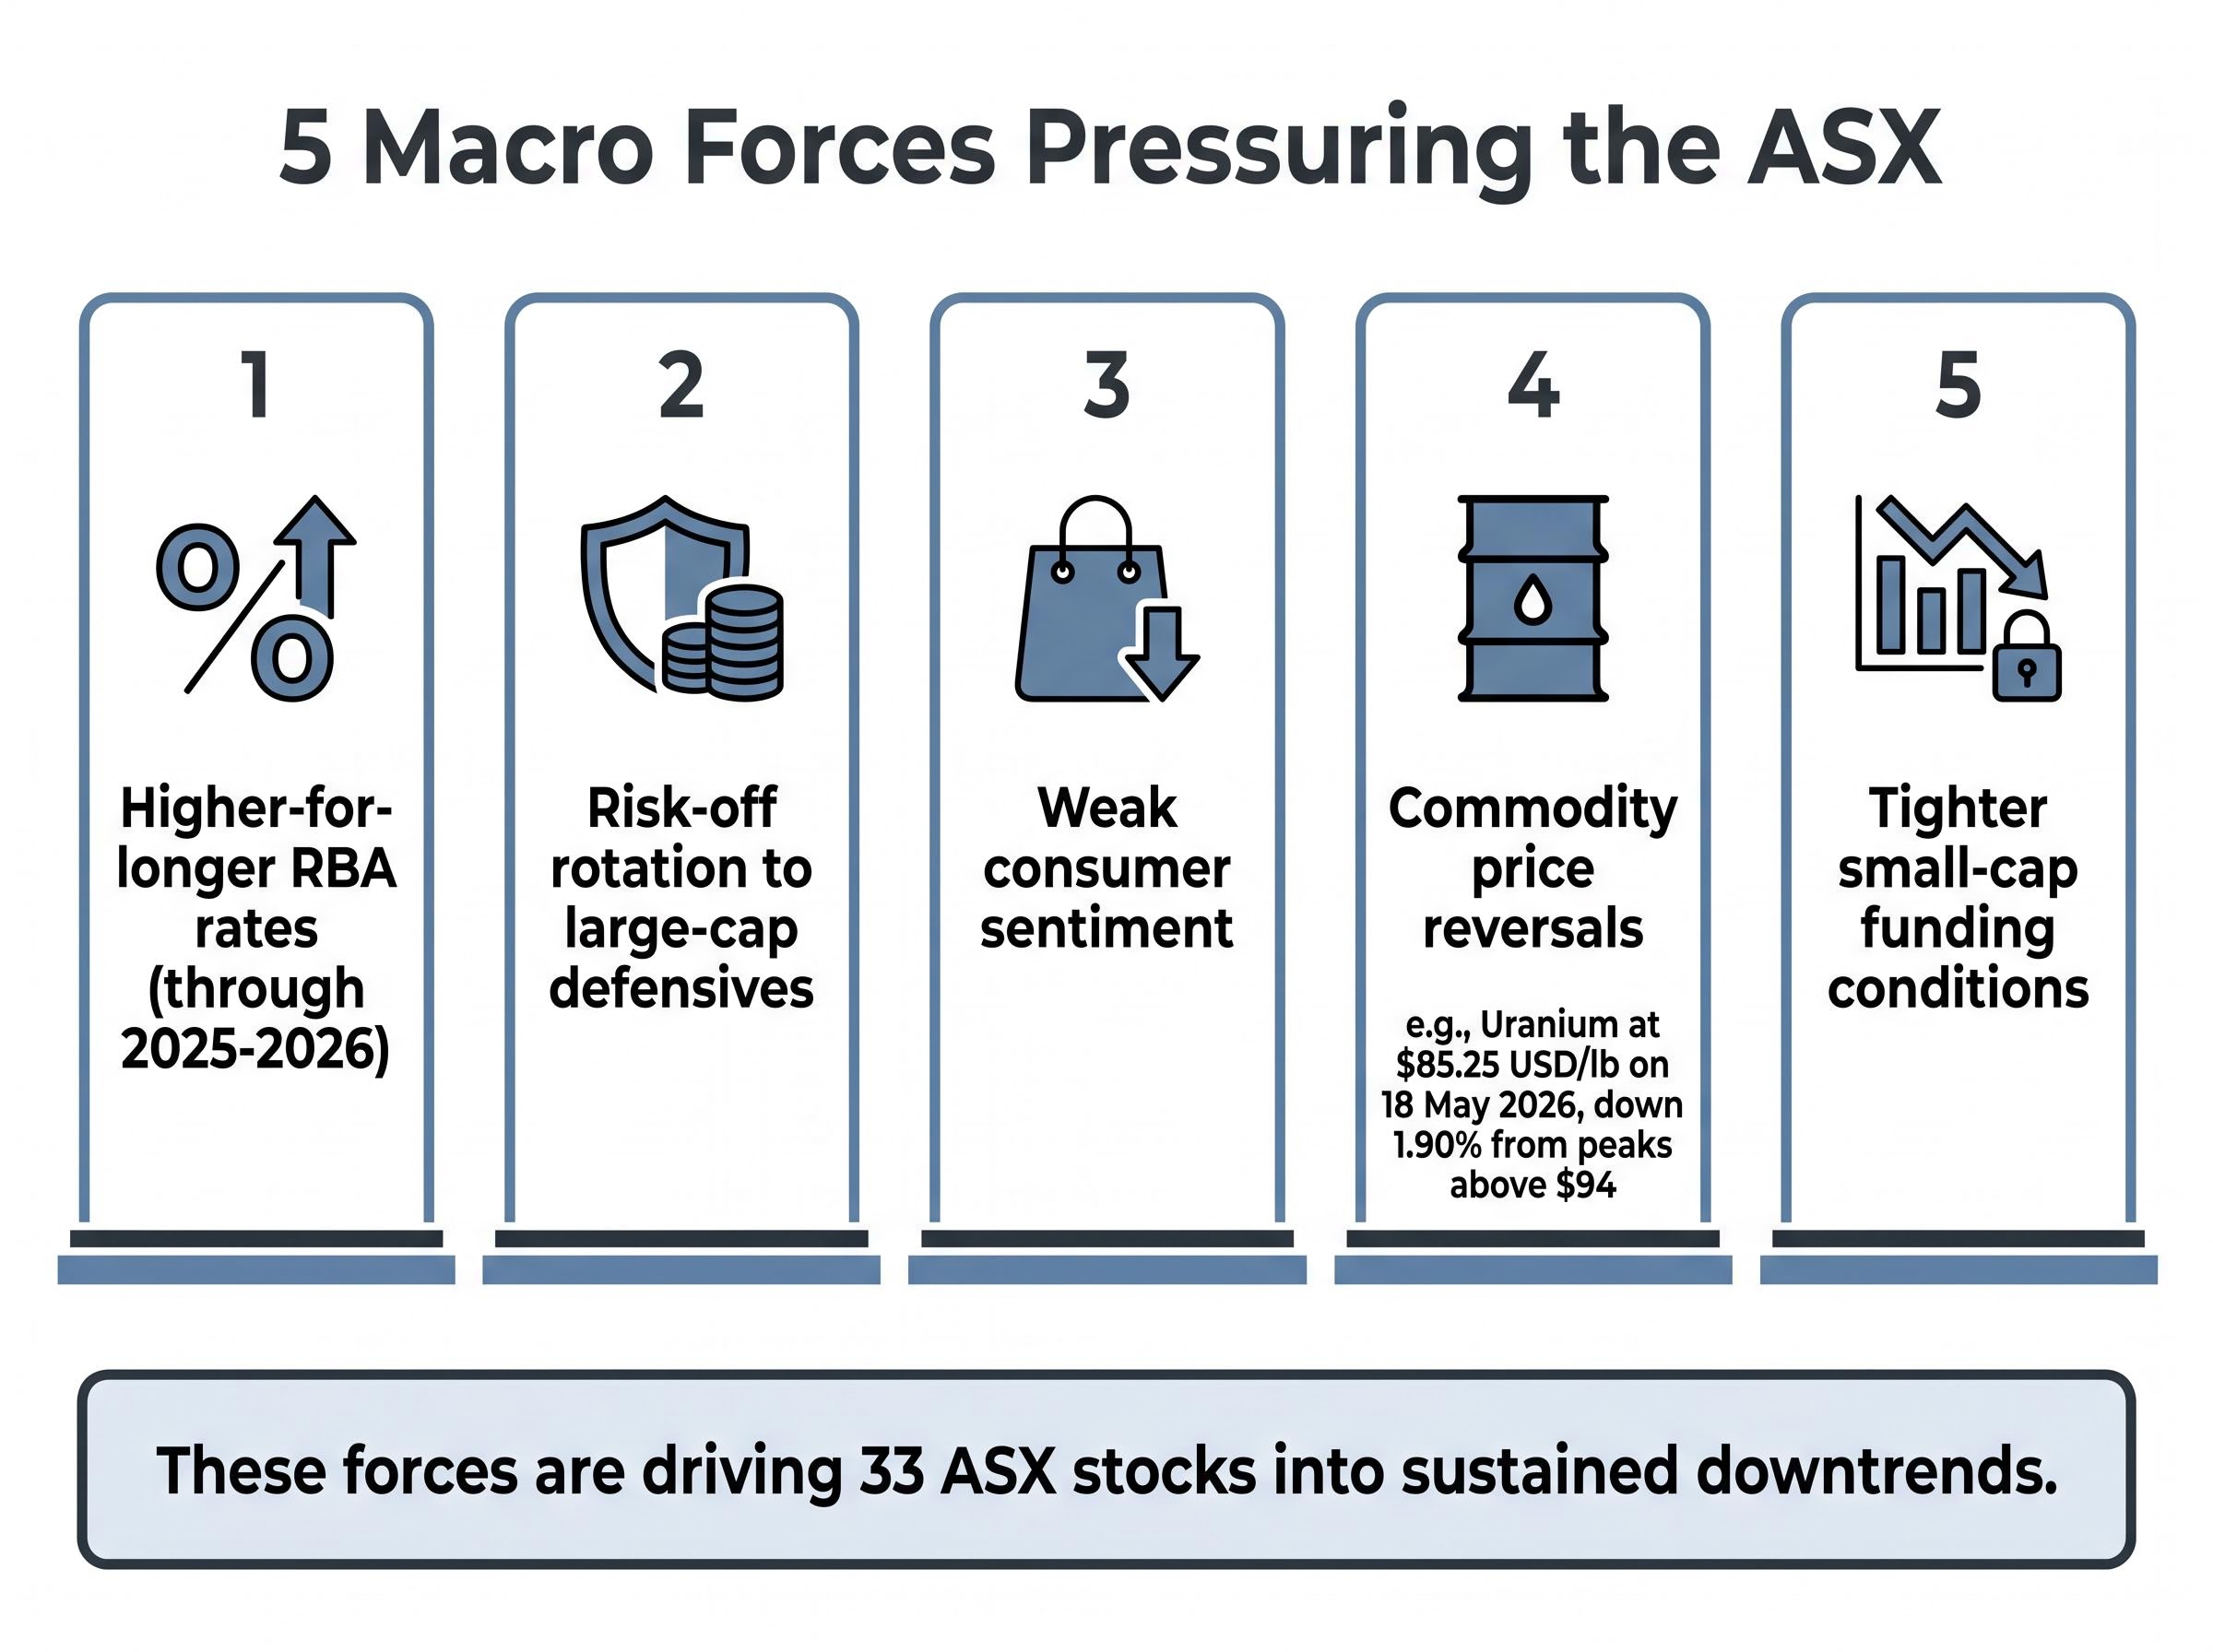
- Higher-for-longer RBA rates: The Reserve Bank’s elevated rate settings through 2025-2026 have increased discount rates applied to growth and tech stocks, compressing multiples across high-PE sectors that dominate the small- and mid-cap indices.
- Risk-off rotation to large-cap defensives: Fund managers have favoured liquidity and earnings certainty, rotating capital toward large-cap banks and resource majors at the expense of speculative or less liquid names. Small-cap indices have underperformed as a result.
- Weak consumer sentiment: Cost-of-living pressures have tightened household budgets. Consumer-exposed names in retail, travel, and discretionary services are absorbing the impact directly through softer demand.
- Commodity price reversals: Post-rally pull-backs in uranium and other commodities have rapidly de-rated resources-heavy small caps, particularly producers and developers that were priced for continued price strength.
- Tighter small-cap funding conditions: A higher cost of capital and more selective equity markets have increased dilution risk for early-stage resources and biotech names, weighing on valuations and making capital raises more punitive for shareholders.
The RBA’s May 2026 Statement on Monetary Policy confirms that the cash rate target has been raised to 4.35 per cent, with the central bank projecting the rate to reach 4.7 per cent by end of 2026, sustaining the discount-rate pressure that has compressed multiples across high-PE ASX sectors throughout this period.
Uranium spot price stood at approximately $85.25 USD/lb as of 18 May 2026, down roughly 1.90% over the prior month and well below earlier peaks above $94 USD/lb, illustrating the post-rally dynamic compressing resources names across the ASX.
These five forces explain why the downtrend scan is not flagging a handful of idiosyncratic failures. It is capturing the tail end of a broader, multi-sector re-pricing.
How to use a downtrend scan to manage risk in your portfolio
Knowing which stocks are under pressure is useful. Knowing what to do with that information is more useful. The scan translates into a three-step framework:
The falling knife trap is one of the costliest mistakes investors make when confronted with a heavily sold-down name: blue-chip reputation and a big percentage decline create the illusion of value, while the underlying technical structure continues to signal no confirmed reversal.
- Identify exposure. Check the 33-stock list against current holdings and watchlists. Any overlap warrants review.
- Review the severity. Stocks showing both large one-month and large one-year declines simultaneously carry the most urgent signal. These are not brief pullbacks; they are sustained trends with accelerating momentum.
- Decide on action. Options include tightening stop-loss levels, reducing position size, exiting entirely, or simply removing the stock from a buy watchlist. The scan is a prompt for active review, not a binary sell instruction.
The six stocks showing the most severe dual-signal declines, warranting priority review:
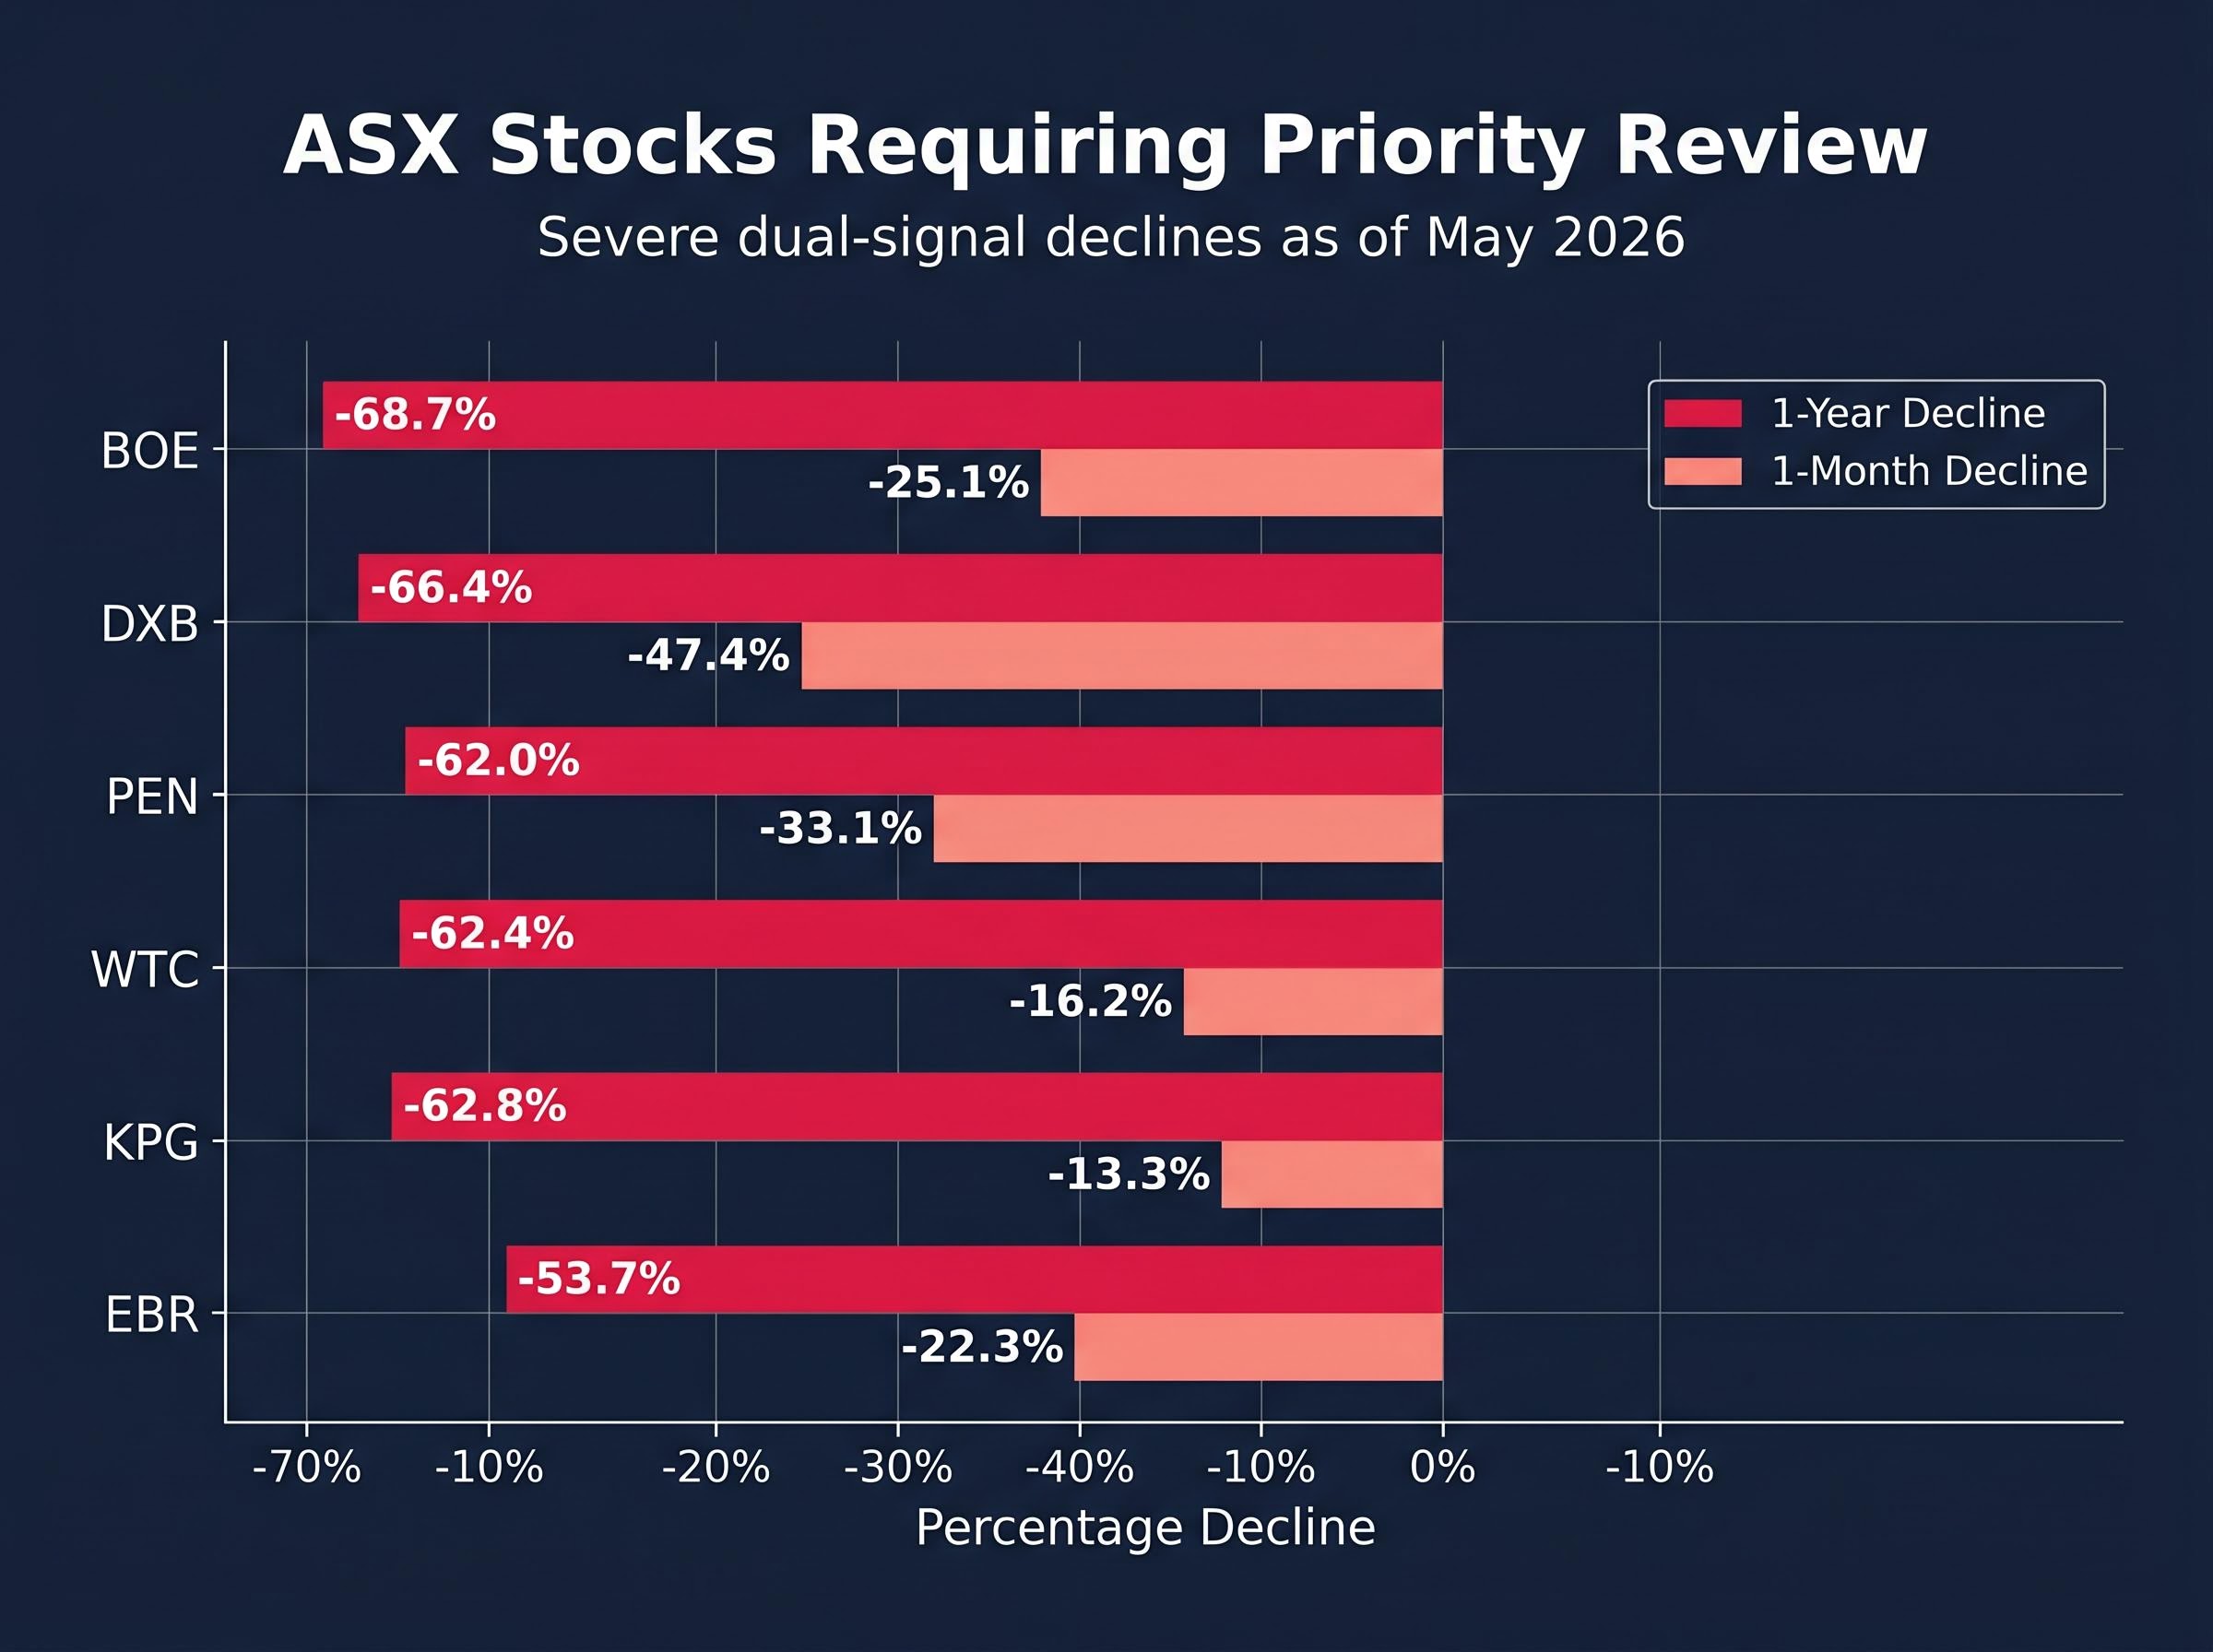
- BOE: -25.1% one-month / -68.7% one-year
- DXB: -47.4% one-month / -66.4% one-year
- PEN: -33.1% one-month / -62.0% one-year
- WTC: -16.2% one-month / -62.4% one-year
- KPG: -13.3% one-month / -62.8% one-year
- EBR: -22.3% one-month / -53.7% one-year
Stocks can remain on the downtrend list across multiple scan editions for as long as they continue satisfying the criteria. No automatic notification is issued when a stock is removed, so investors need to monitor subsequent scans independently. The scan data can be exported via TradingView for sequential chart review, and Market Index hosts a live webinar each Wednesday at 12pm AEDT for real-time stock analysis.
The sell-side signals will clear when these conditions shift
The 33 stocks on the downtrend list reflect a specific macro and market moment in May 2026, not a permanent verdict on these businesses. The pressure would logically ease with RBA rate cuts reducing discount rates on growth equities, uranium price stabilisation restoring confidence in resources producers, improved consumer sentiment lifting discretionary names, and a more receptive small-cap funding market reducing dilution risk for early-stage companies.
Until those conditions shift, the scan remains a systematic, chart-based tool for navigating current supply-side momentum. It is designed to be consulted regularly alongside individual research, not treated as definitive from any single edition. Securities can appear across multiple scans, and what matters is whether the technical conditions have changed, not whether the name was flagged before.
For investors wanting to understand what institutional capital is rotating into while the downtrend list grows, our full explainer on ASX lithium stocks hitting 52-week highs examines how spodumene prices quadrupling to US$2,500 per tonne have driven Pilbara Minerals, Liontown, and IGO sharply higher in the same period that has seen 33 names enter confirmed downtrends, revealing a deliberate sector rotation rather than broad market pessimism.
This article is for informational purposes only and should not be considered financial advice. Investors should conduct their own research and consult with financial professionals before making investment decisions. Past performance does not guarantee future results.