
Why Crude Oil Prices Won’t Return to Pre-War Levels
just now

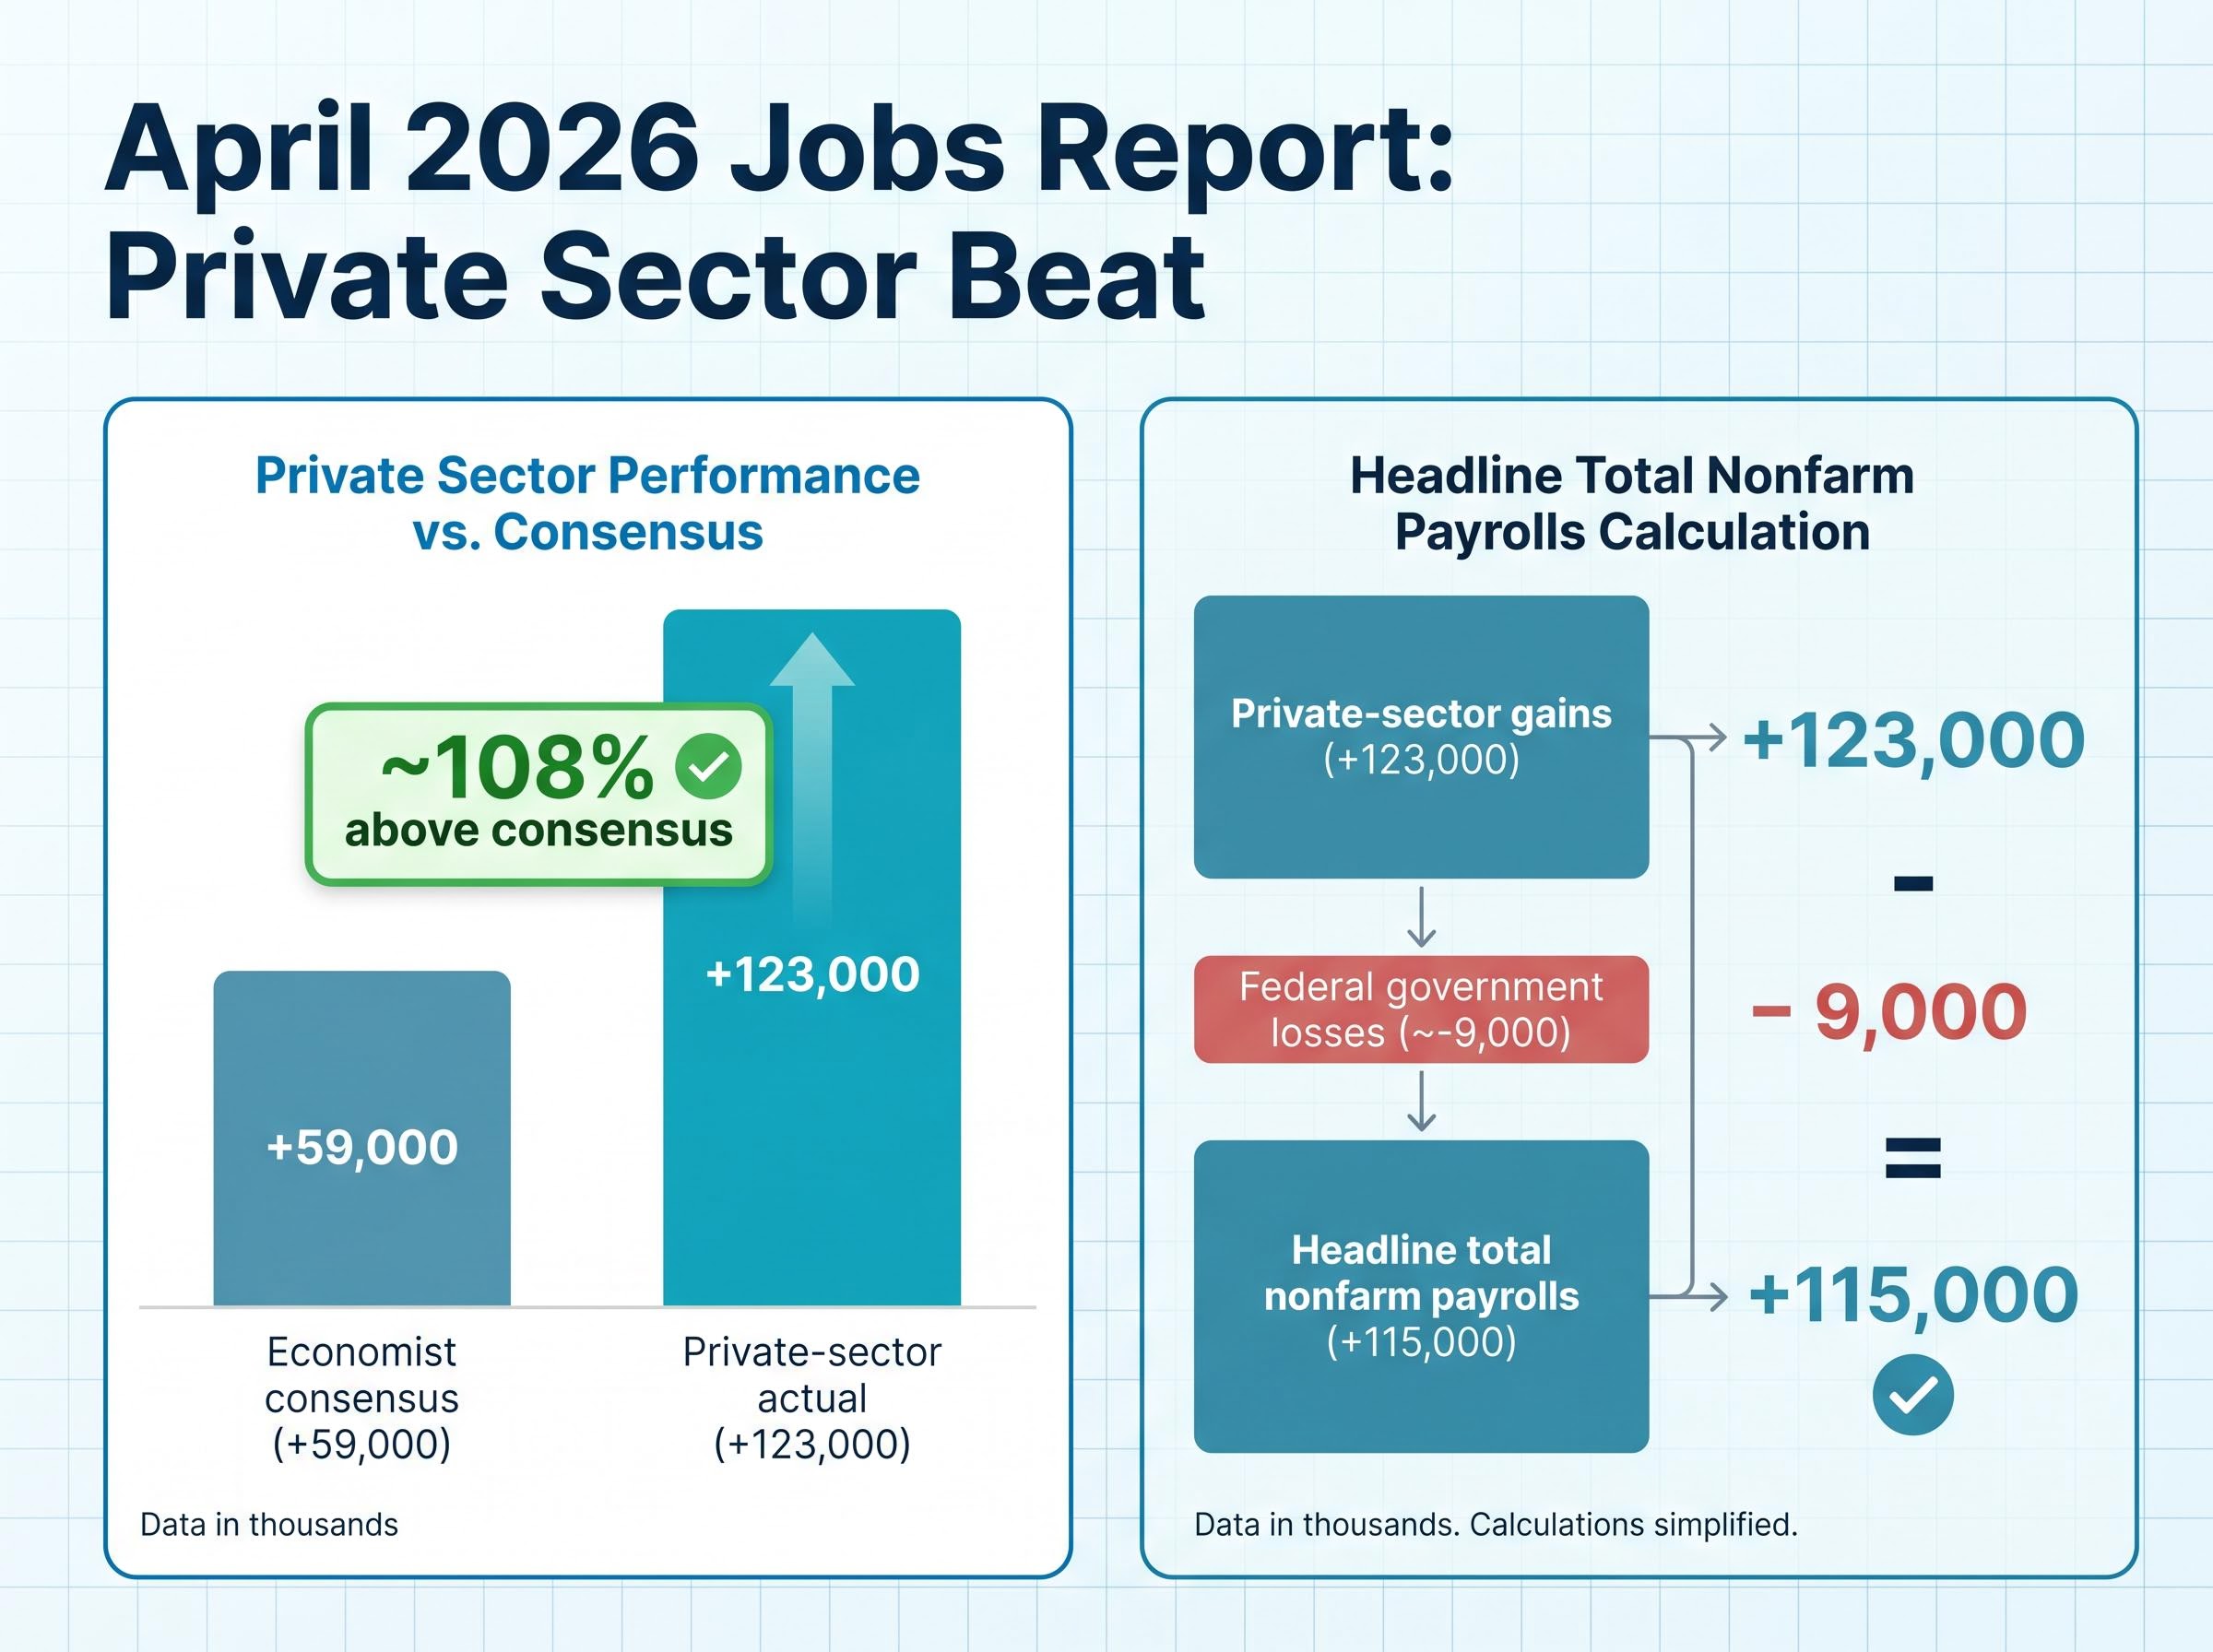
Private-sector employers added 123,000 jobs in April 2026, more than double the 59,000 economists had forecast. Yet the headline nonfarm payrolls figure of 115,000 told a more complicated story, shaped by ongoing federal government contraction and persistent manufacturing weakness beneath the surface.
The Bureau of Labor Statistics (BLS) released the April 2026 Employment Situation report on 8 May, and the data arrives at a moment when markets are parsing every labour market signal for clues about the Federal Reserve’s next move, the durability of the current expansion, and whether tariff-related uncertainty is beginning to leave visible marks on hiring. This analysis breaks down what the numbers actually show: which sectors drove the private-sector beat, where structural drags remain, and how a strong jobs print fits within the broader question of what employment data does and does not tell investors about the road ahead.
The headline figure was 115,000 total nonfarm payrolls added in April. The private-sector figure was 123,000. The gap between those two numbers is the story.
Federal government employment contracted by approximately 9,000 positions during the month, pulling the total below what private-sector hiring alone would have delivered. The result: a headline that looked like modest growth concealed a private-sector beat that more than doubled the consensus estimate.
Private-sector beat: 123,000 actual versus 59,000 estimated, a result roughly 108 percent above consensus.
March’s upward revision to 185,000 adds further context. Two consecutive months of solid private-sector gains establish a baseline that makes April’s beat harder to dismiss as noise. For investors who rely on the headline number alone, the composition gap matters: underlying labour demand was substantially stronger than the top-line figure suggested.
The payrolls forecasting context heading into May 8 matters for interpreting the beat: the April consensus of 62,000-70,000 was already shaped by the unwinding of a one-off healthcare strike-return effect that had inflated March’s 178,000 print, which means the private-sector outperformance carries more signal weight than a headline comparison to a depressed base would suggest.
Health care added 37,000 positions in April, the largest single-sector contribution. This continues a pattern of structural hiring driven by demographic demand rather than cyclical momentum.
Transportation and warehousing followed with 30,000 new jobs, a figure that suggests consumer activity and supply-chain throughput remained resilient through the month. Retail trade added 22,000 positions, reinforcing the consumer spending signal. Social assistance contributed 17,000.
Goods-producing industries added a net 10,000 positions, with construction as the primary driver within that segment. State government employment contributed approximately 1,000 jobs, largely from education hiring, which accounts for the arithmetic difference between the 123,000 private-sector figure and the 115,000 headline total.
| Sector | Jobs Added (April 2026) | Category |
|---|---|---|
| Health care | +37,000 | Service |
| Transportation and warehousing | +30,000 | Service |
| Retail trade | +22,000 | Service |
| Social assistance | +17,000 | Service |
| Goods-producing (led by construction) | +10,000 | Goods |
| State government (education) | ~+1,000 | Government |
| Federal government | ~-9,000 | Government |
The composition reinforces a service-sector-led expansion. Health care’s continued dominance reflects long-term structural demand, while transportation and retail gains point to consumer-facing resilience that tariff uncertainty has not yet visibly disrupted.
Three figures anchor the broader labour market picture beyond the payrolls headline:
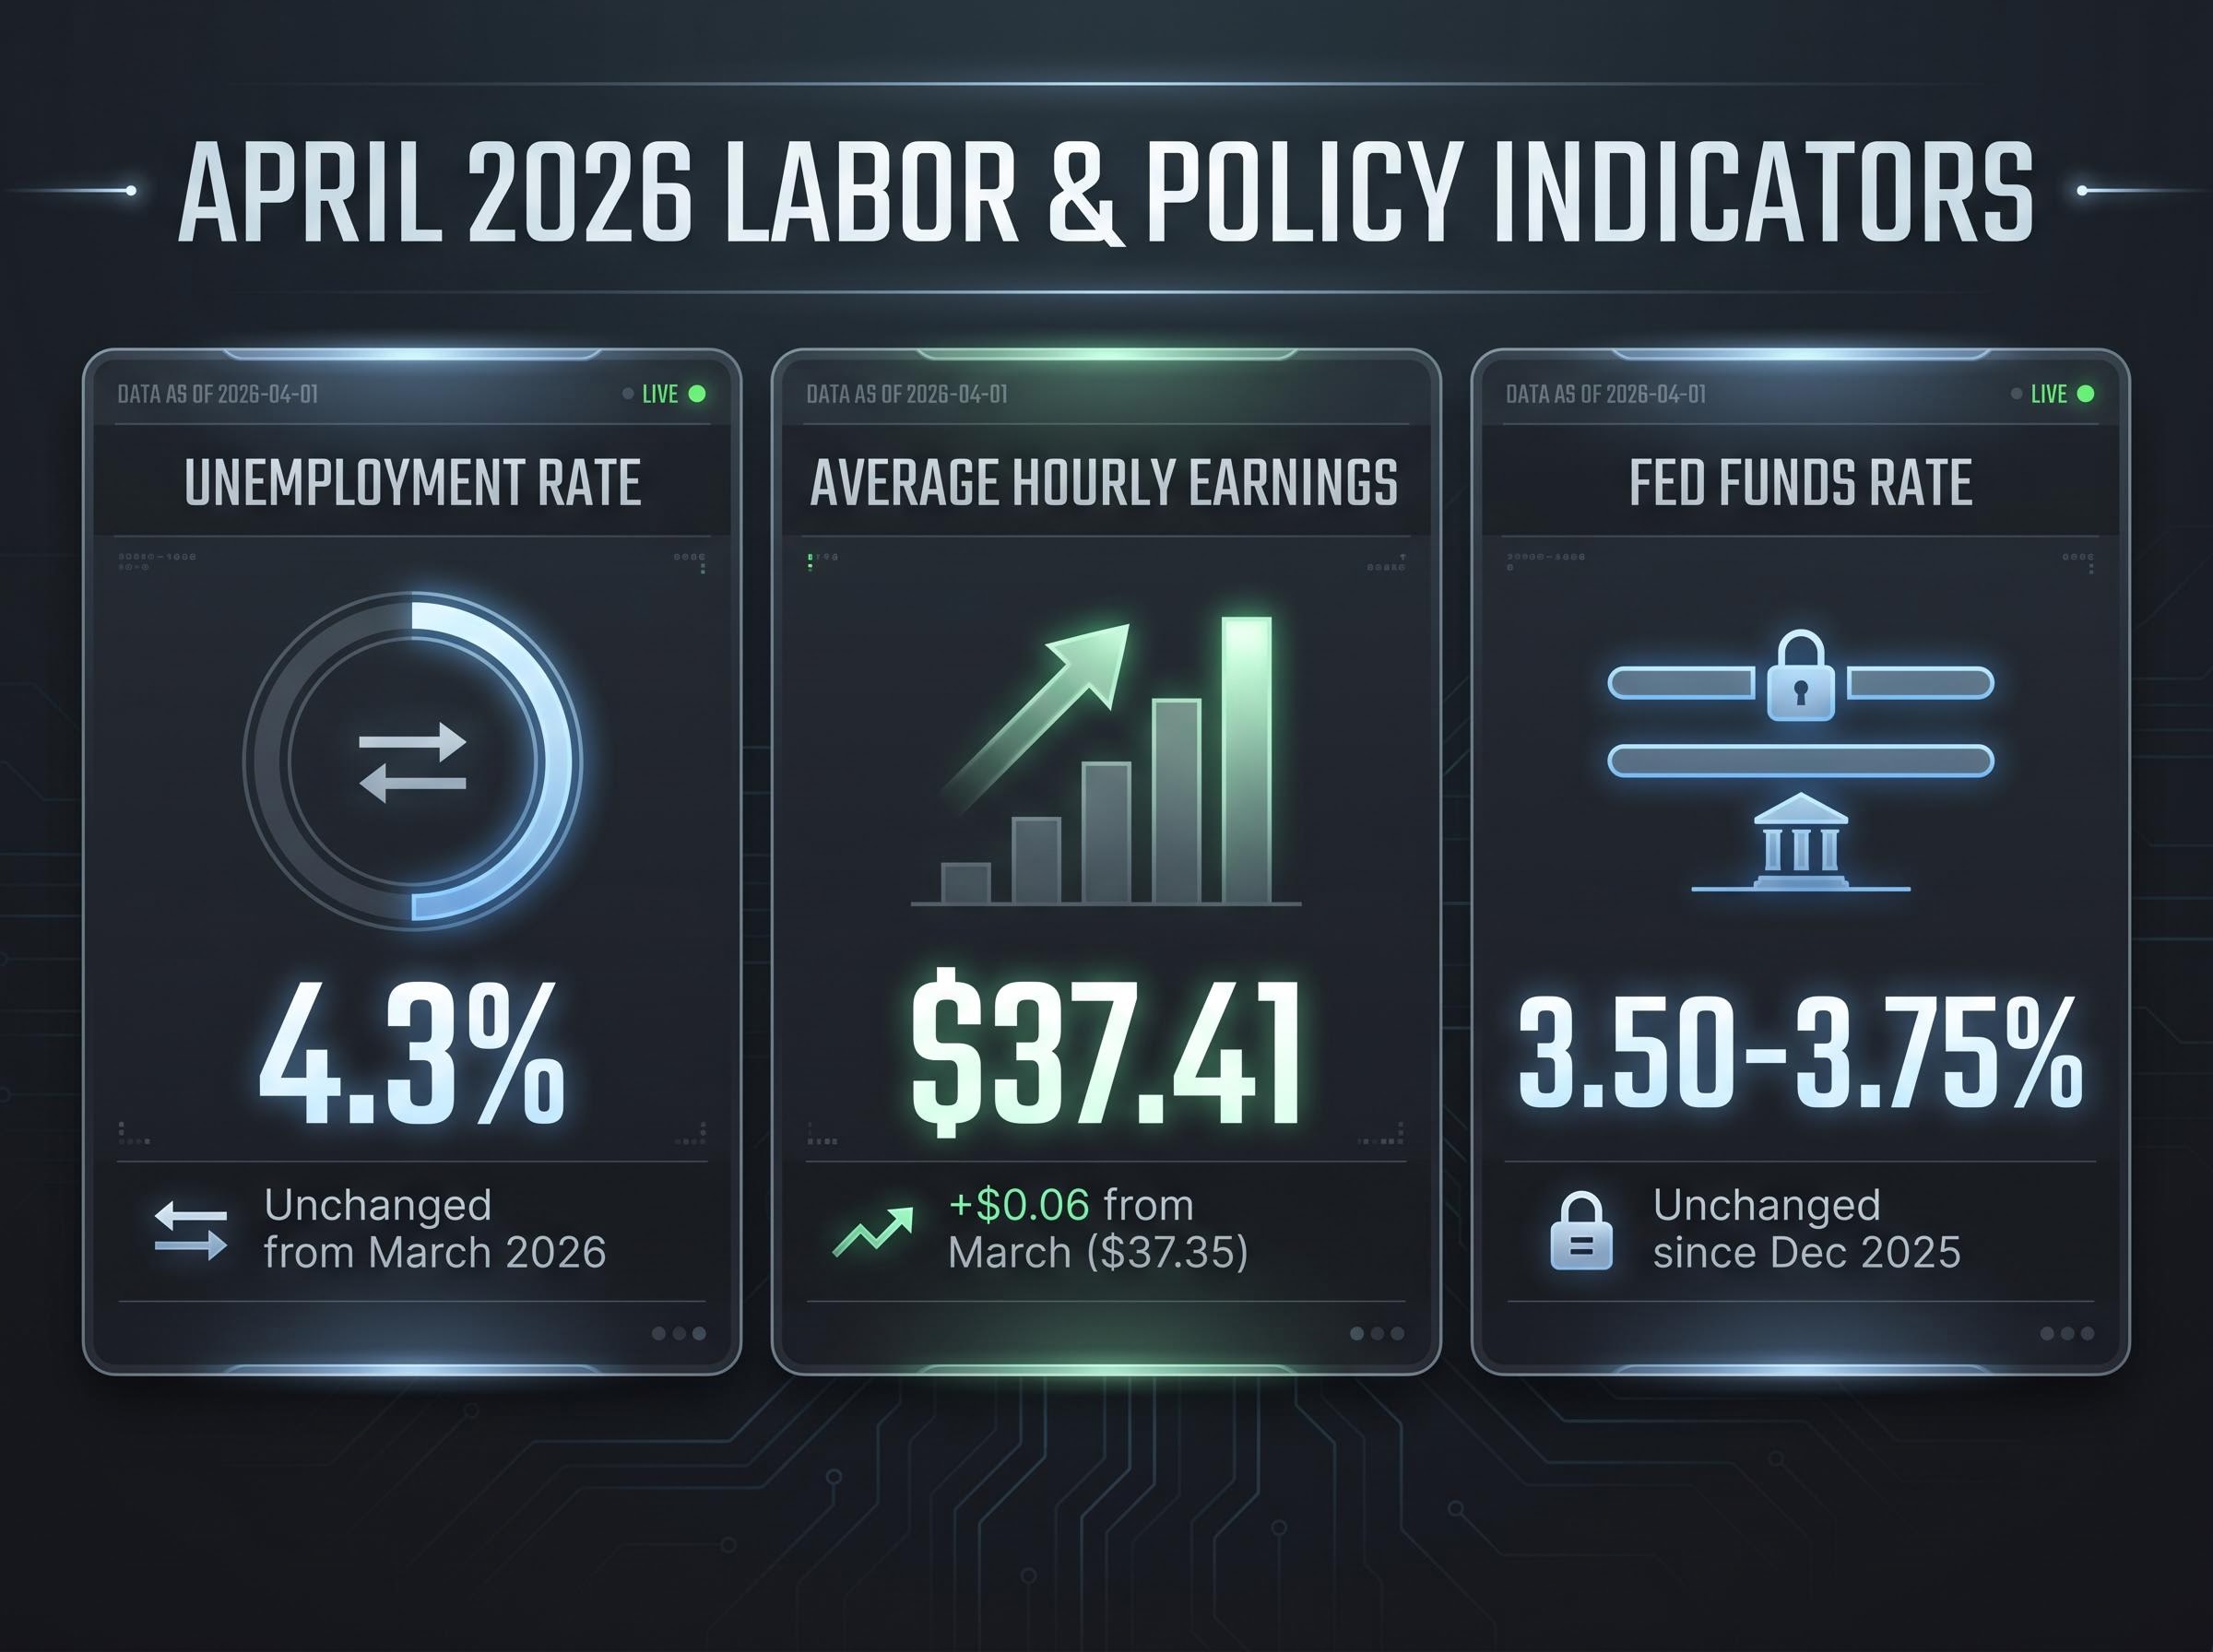
The unemployment rate held at 4.3% for the second consecutive month, a level that remains historically subdued without signalling further tightening.
The earnings increase of $0.06 month-over-month represents modest nominal wage growth. It is enough to suggest that workers retain some bargaining power in a labour market with low unemployment, but not enough to raise concerns about a wage-price spiral feeding into inflationary pressure.
Taken together, the combination points to a labour market that is neither overheating nor deteriorating. For Federal Reserve watchers, this is a data profile that reduces urgency on both sides: it does not compel rate cuts to support employment, nor does it compel hikes to contain wage-driven inflation. The stability, rather than any single figure, is the signal.
The Federal Reserve dual mandate charges the central bank with pursuing maximum employment alongside price stability, a two-part framework that means any single payrolls print must be weighed against inflation data before a policy response can be inferred.
The Federal Reserve has held the federal funds rate target range at 3.50-3.75% since December 2025, having already reduced it from a prior 5.25-5.50% level during earlier 2025 actions. The rate remained on hold through both the January and March 2026 FOMC meetings.
Following the stronger-than-expected private-sector result, some market participants concluded that near-term rate cuts moved further from consideration. This view should be understood as market interpretation rather than sourced Federal Reserve guidance; no verified FOMC member statement or futures-market summary explicitly revising the 2026 rate-cut path in response to April’s data has been identified.
The Fed operates under a dual mandate: full employment and price stability. How it weighs incoming data against forward-looking forecasts remains an open question with no definitive answer. A single strong payrolls print does not resolve that ambiguity, particularly when rate changes affect demand with a lengthy and unpredictable lag.
Incoming Fed Chair Kevin Warsh’s stated views suggest potential shifts in how the central bank interprets its mandate, adding further uncertainty to any rate-path projection. The April jobs report narrows no doors conclusively. It provides one more data point in a series that the Fed weighs alongside inflation readings, financial conditions, and its own staff forecasts.
The FOMC committee fracture adds a layer of complexity to any rate-path reading derived from the jobs data: with dissenters pulling in opposite directions and inflation running above the 2% target for five consecutive years, the incoming April employment print lands in an institution where consensus on the appropriate policy response is genuinely absent.
For investors, the implication is straightforward: overconfident rate-path assumptions built on a single employment release carry risk. The data supports a range of interpretations, not a singular conclusion.
Two countercurrents run beneath April’s headline optimism:
Goods-producing employment sits slightly below year-ago levels on a year-over-year basis, adding to the picture of a manufacturing sector that has not participated in the broader private-sector recovery.
These are not minor footnotes. Manufacturing and federal employment represent the two most closely monitored fault lines in the current labour market. Their persistent weakness, even against a strong service-sector backdrop, signals that structural headwinds remain active and warrant close attention in subsequent monthly reports.
April’s solid private-sector hiring did not resolve the macro headwinds converging on the expansion: Brent crude above $120 per barrel, hawkish Fed dissent constraining the rate-cut path, and Q1 earnings growth of 27.8% year-over-year that set a high baseline for markets to sustain through a period of ongoing tariff uncertainty.
Businesses hire when demand has already materialised. They reduce headcount when revenue fails to sustain staffing levels. This sequencing makes employment a lagging indicator by structure: payrolls data confirms where the economy has been, not where it is going.
Leading indicators work differently. Equity markets, for instance, survey anticipated earnings and economic conditions anywhere from three to 30 months ahead. Bond yields incorporate rate expectations that reflect forward-looking inflation and growth assumptions. Employment data does neither. It tells investors what employers decided to do last month based on conditions that may have shifted since.
The S&P 500 total return index stood at record highs as of 12 May 2026, according to FactSet, even as the federal funds rate has remained unchanged since December 2025. Equity markets had already priced the growth that April’s employment data is now confirming.
This does not mean the private-sector beat is irrelevant. It confirms that the expansion underway through early 2026 had genuine labour market backing, which matters for the durability of the cycle. But it does not predict whether May, June, or July will look the same.
The distinction is worth holding clearly. Widespread coverage treated April’s payrolls beat as a forward-looking positive signal. As a matter of economic structure, it is a backward-looking confirmation. Investors who treat each monthly release as new directional information risk acting on data that markets have already absorbed.
April 2026 delivered private-sector strength well above consensus, stable unemployment at 4.3%, and moderate wage growth of $0.06 month-over-month. Manufacturing contraction and federal employment losses remain persistent counterweights that the headline optimism does not resolve.
The report confirms the expansion already underway. It does not resolve the open questions around tariff uncertainty, monetary policy direction, or how long service-sector hiring can carry the weight of broader labour market health. The next Employment Situation release becomes the checkpoint for determining whether April’s private-sector beat represents the start of a trend or a single-month anomaly.
For investors wanting to place April’s US labour market result within a global frame, our deep-dive into global PMI divergence examines how the US payrolls beat sits alongside a collapsing eurozone services PMI at 47.6, a China trade surge that may be distorted by tariff front-loading ahead of June tariffs, and manufacturing signals that complicate any single-country read of where the global cycle stands.
This article is for informational purposes only and should not be considered financial advice. Investors should conduct their own research and consult with financial professionals before making investment decisions. Past performance does not guarantee future results.
The nonfarm payrolls report, released monthly by the Bureau of Labor Statistics, measures the number of jobs added or lost across most sectors of the US economy. Investors use it to gauge labour market health, assess Federal Reserve rate policy direction, and evaluate the durability of the broader economic expansion.
The total nonfarm payrolls figure of 115,000 was pulled below the private-sector result of 123,000 because federal government employment contracted by approximately 9,000 positions during the month. This gap means the headline number understated the underlying strength of private hiring demand.
Health care led with 37,000 new positions, followed by transportation and warehousing at 30,000, retail trade at 22,000, and social assistance at 17,000. Goods-producing industries, led by construction, added a net 10,000 jobs, while manufacturing showed little change month-over-month.
A strong payrolls print reduces urgency for near-term rate cuts by signalling that the labour market does not require policy support, but it does not automatically delay cuts either, since the Fed weighs employment data alongside inflation readings, financial conditions, and forward-looking forecasts before adjusting the federal funds rate.
Employment data is a lagging indicator by structure, meaning it confirms hiring decisions employers already made based on past demand rather than predicting future conditions. Markets such as equities and bonds typically price anticipated growth ahead of what payrolls data later confirms.