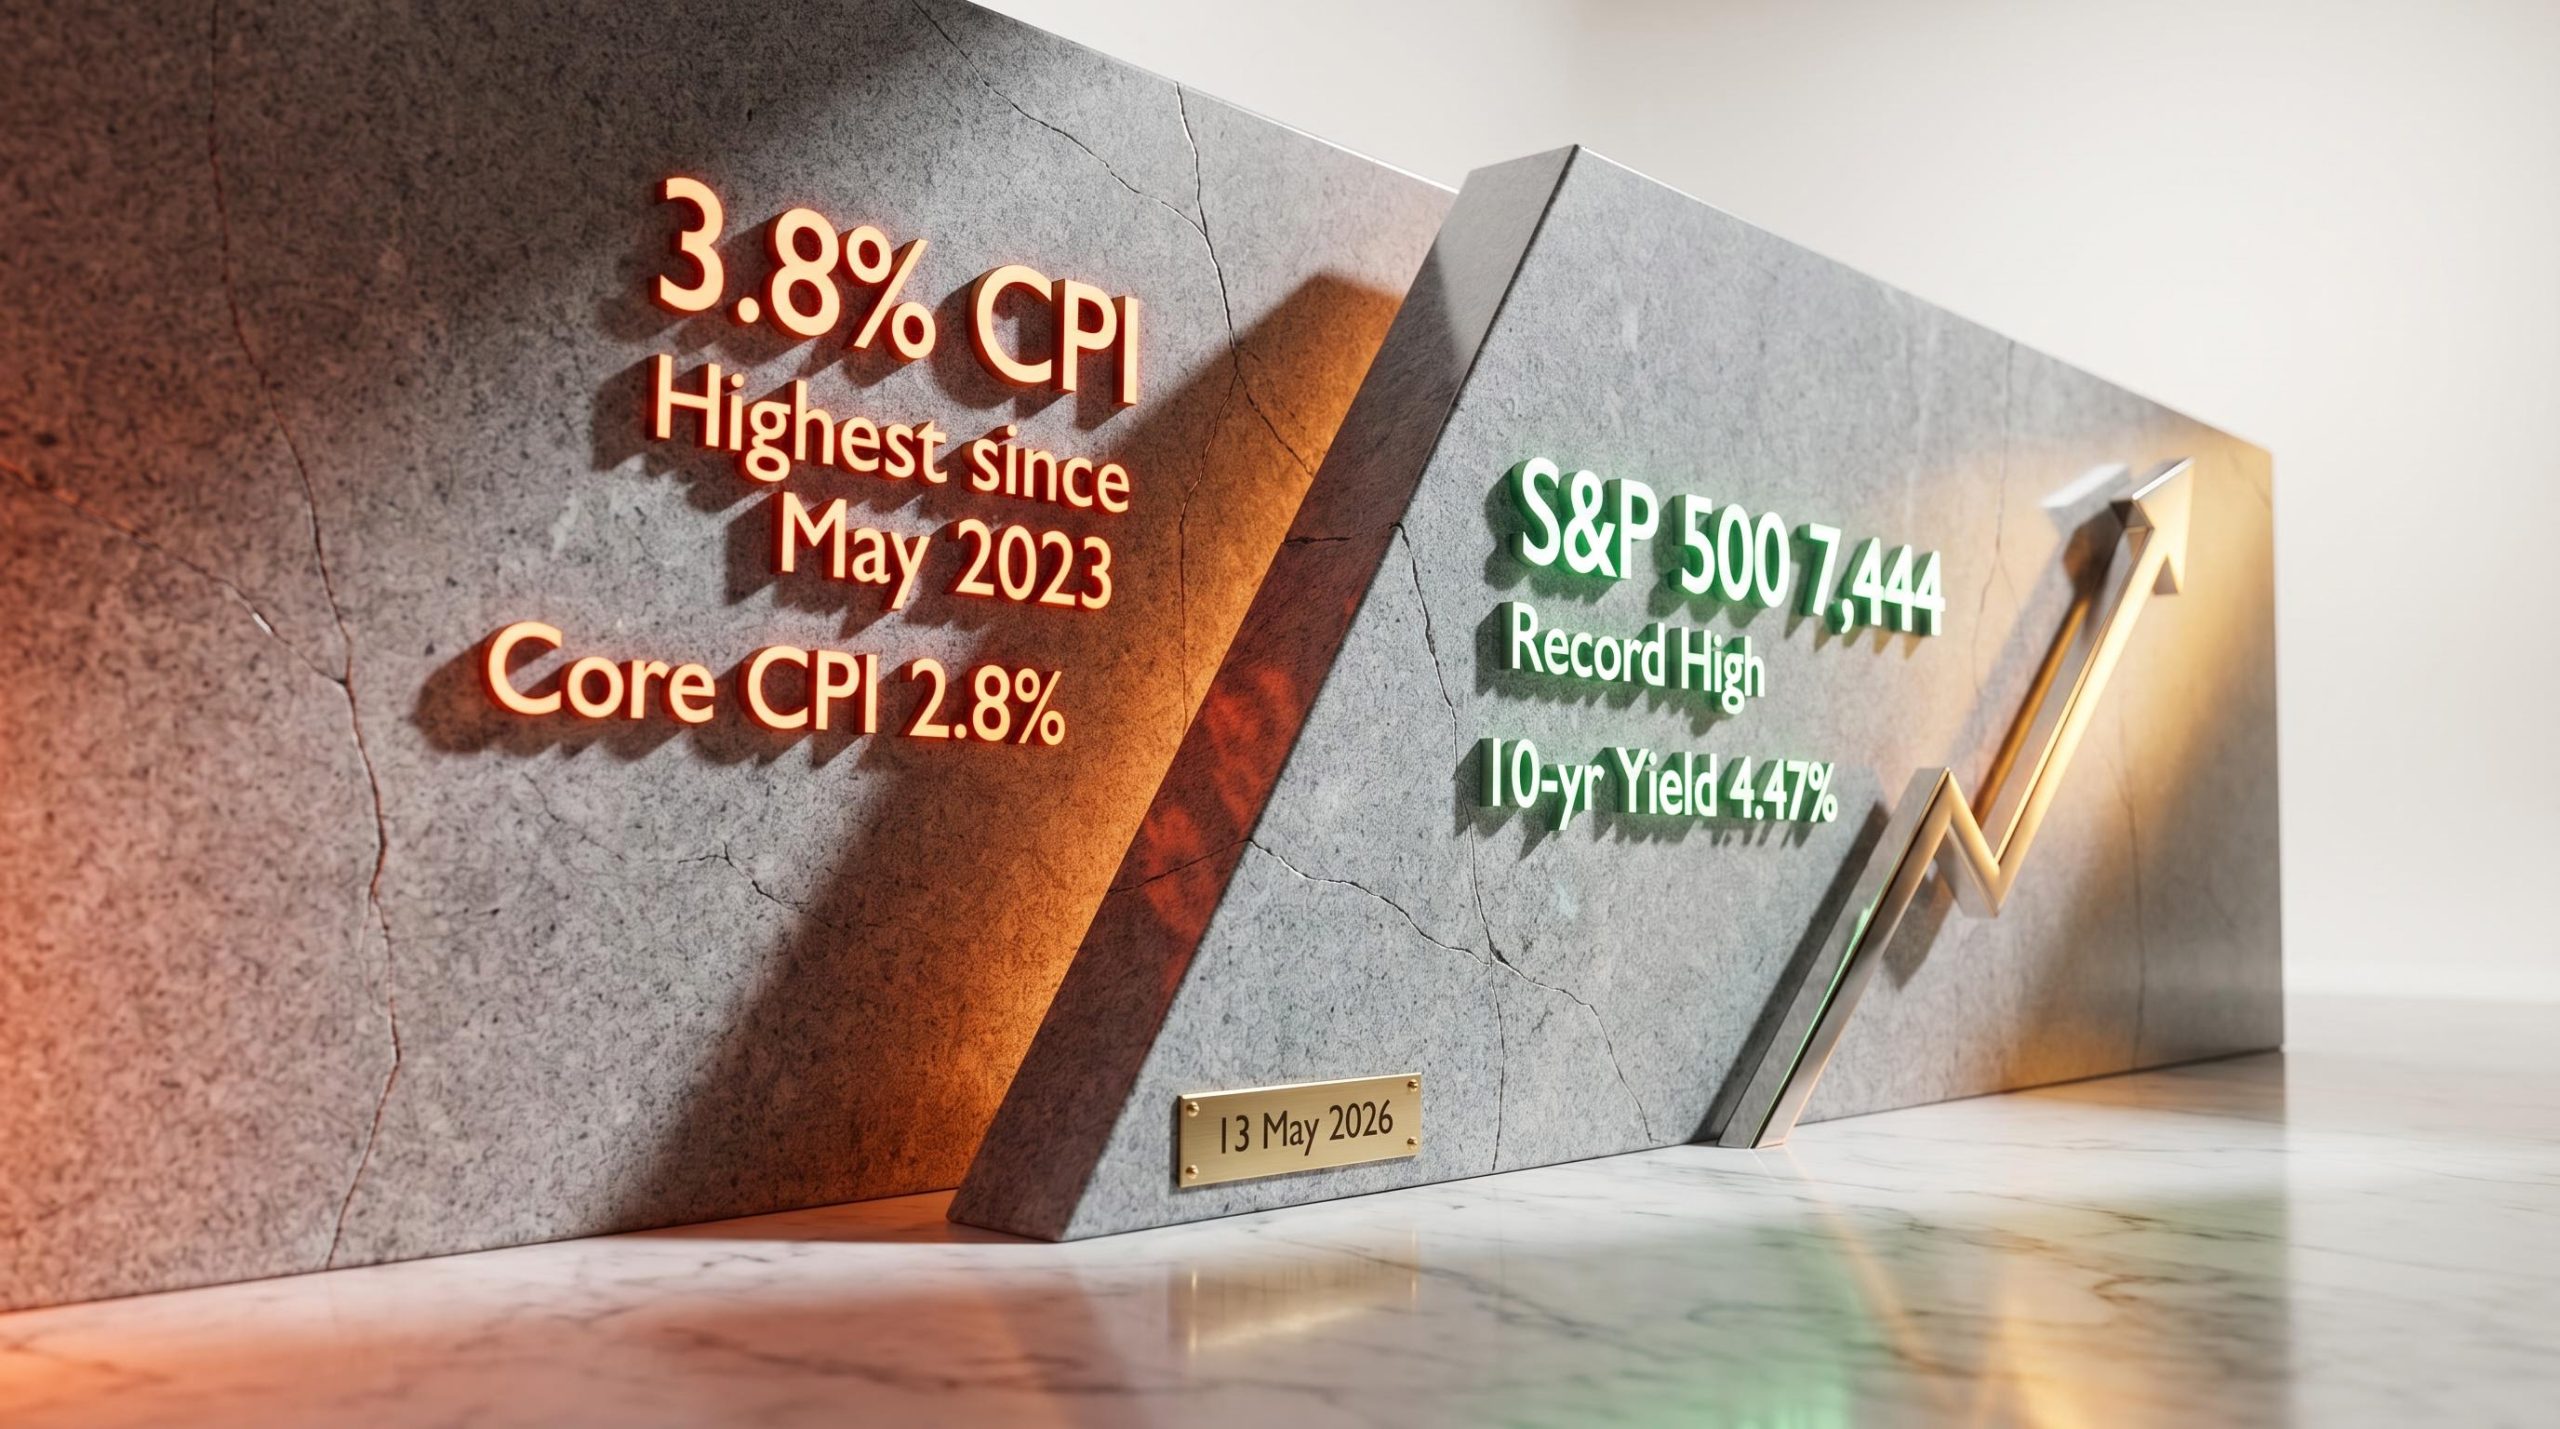
On 12 May 2026, the Bureau of Labor Statistics reported US headline inflation at 3.8% year-over-year, the steepest reading since May 2023 and well above consensus forecasts. One day later, the Senate confirmed Kevin Warsh as Federal Reserve Chair by a 54-45 vote. Two macro shocks in 48 hours have reset the debate over interest rates, inflation durability, and equity market resilience. Investors who had grown accustomed to a disinflationary trend through 2024 and 2025 now face a markedly different environment: fewer rate cuts priced for 2026, 10-year Treasury yields near annual highs, and a new Fed leadership regime with a hawkish reputation.
What follows is a breakdown of what the April Consumer Price Index (CPI) data actually shows, whether the re-acceleration signals a lasting shift or a temporary distortion, and what the Warsh-led Federal Reserve means for portfolios. The goal is a framework for interpreting the US inflation rate and its market consequences without overreacting to a single print.
The April 2026 CPI report in numbers: what the data actually shows
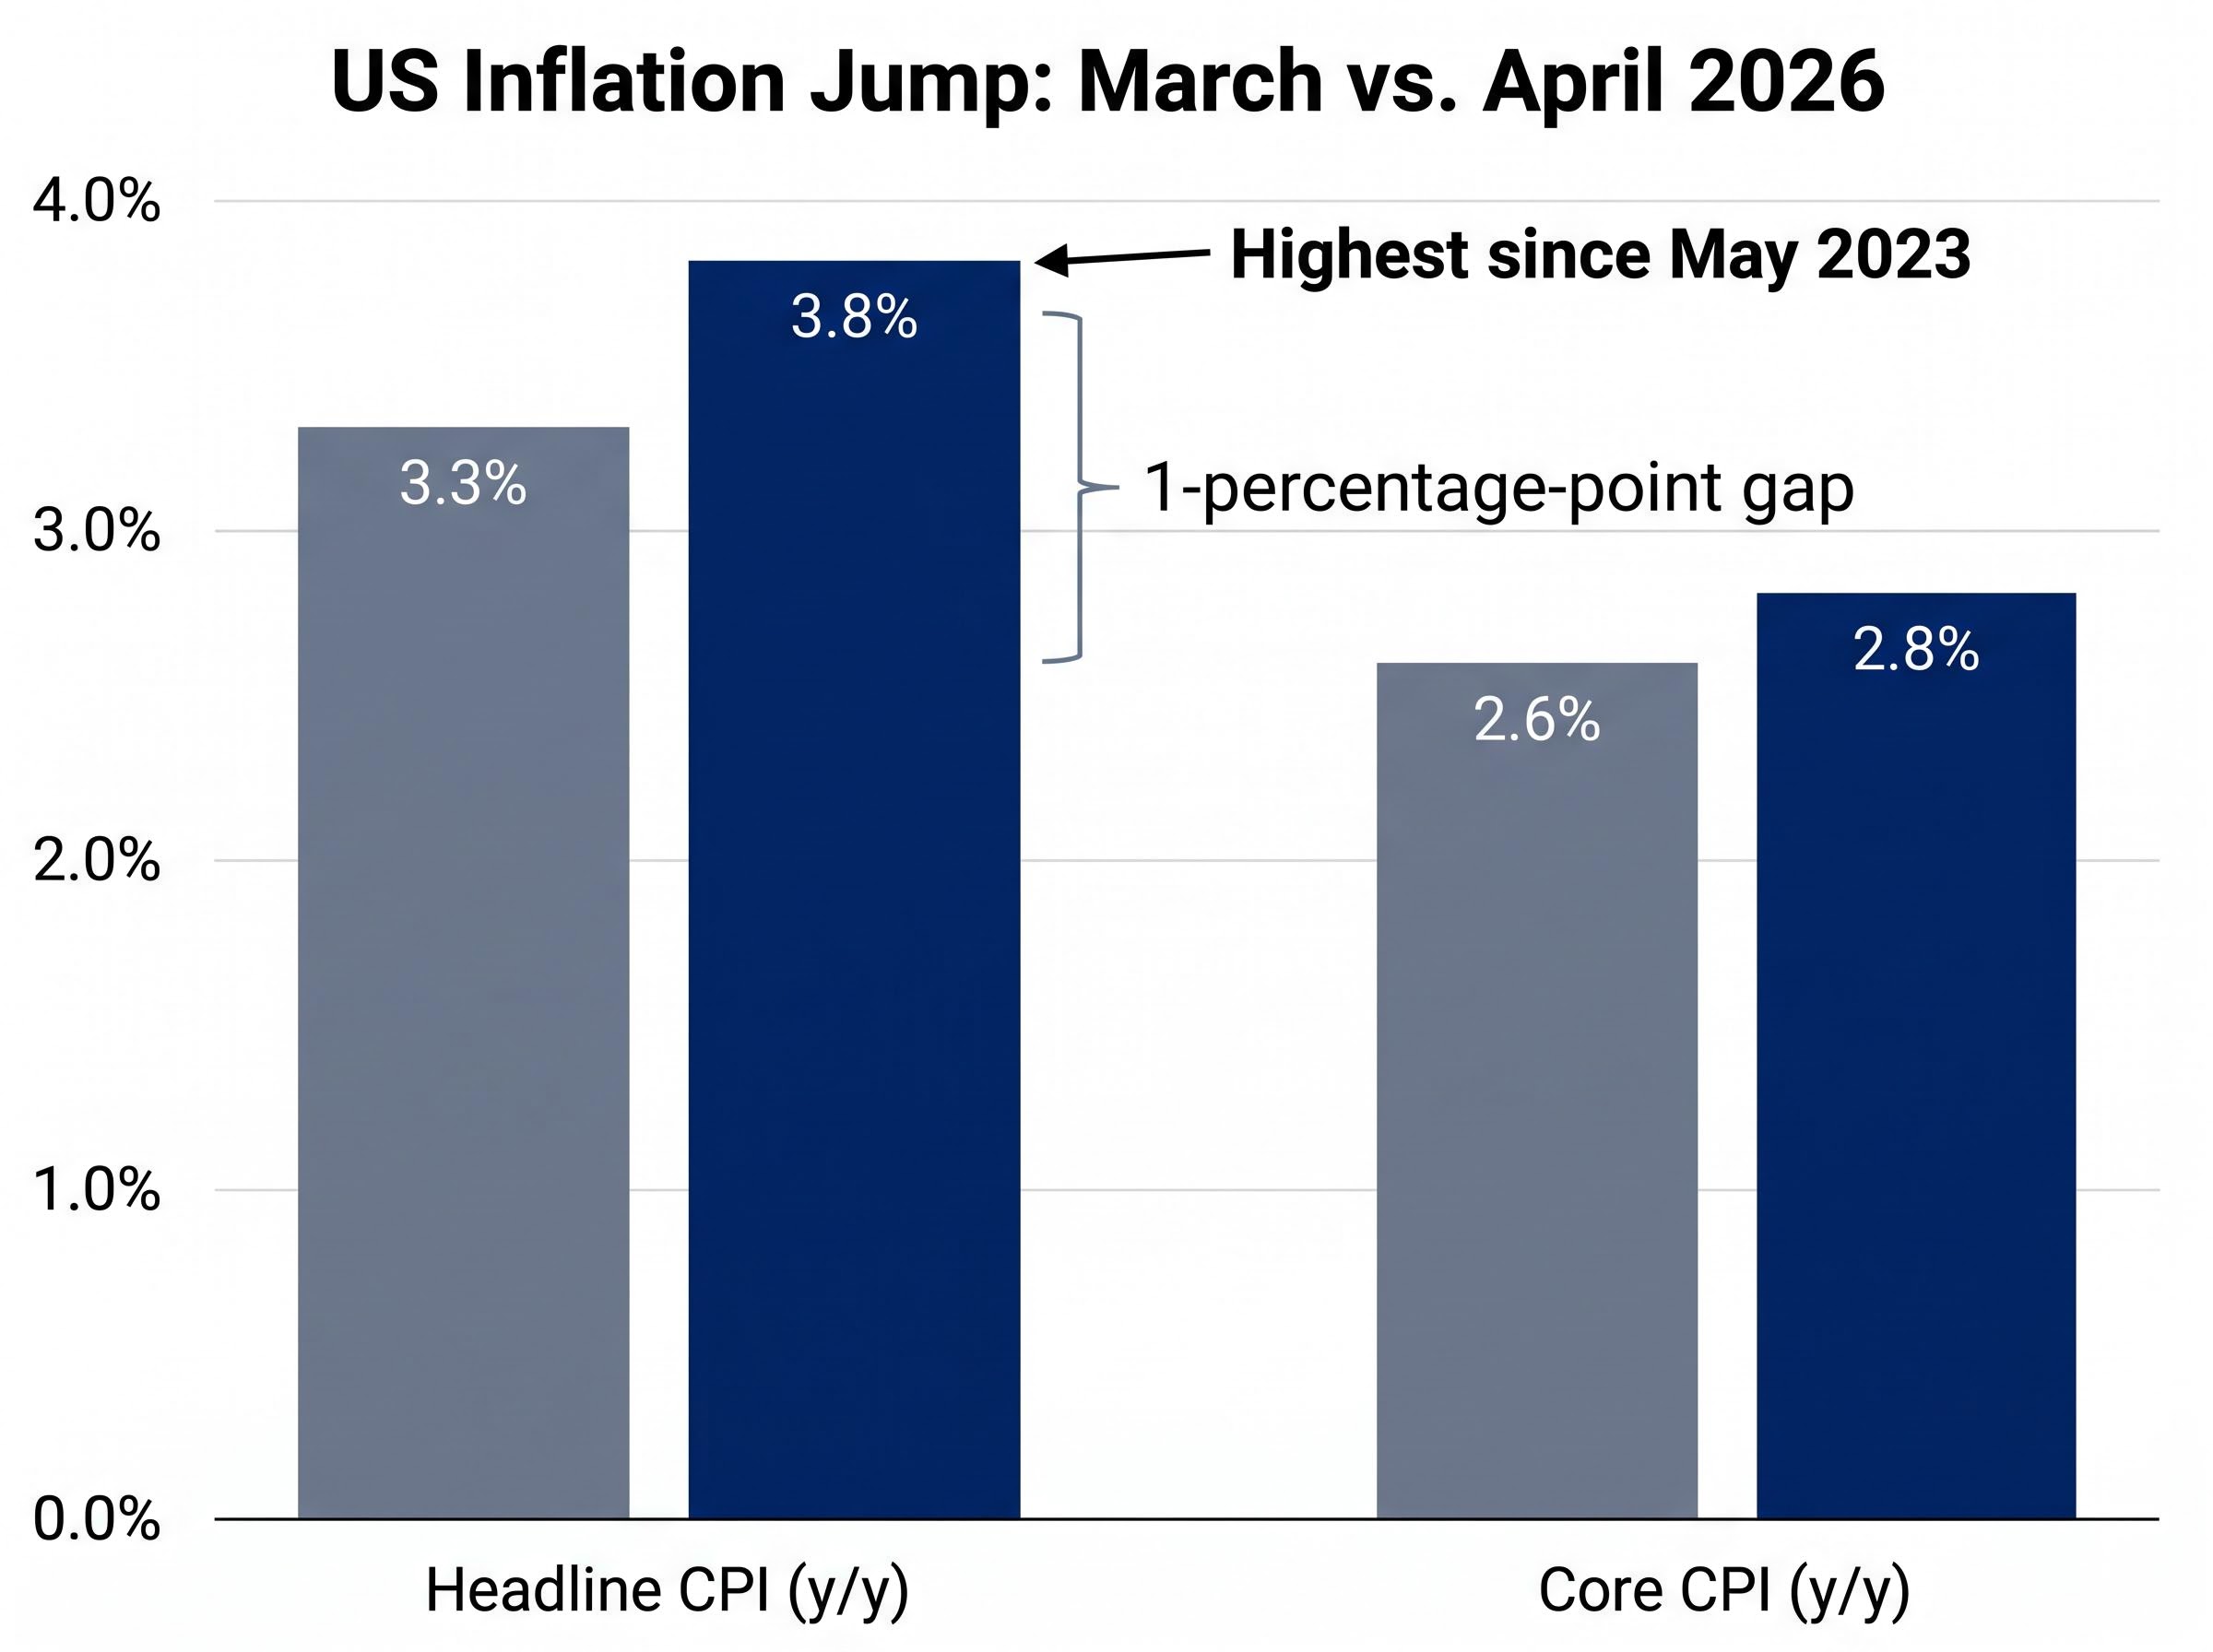
3.8% headline CPI (year-over-year): the highest reading since May 2023, up from 3.3% in March 2026.
The monthly increase of +0.6% represents a sharp acceleration. In March, headline CPI had sat at 3.3%, a level that still allowed markets to price in at least one rate cut before year-end. The jump to 3.8% in a single month eliminated that pricing almost overnight.
The April reading represented a broad-based inflation surprise, not a single-category distortion: core CPI rose 0.4% on a monthly basis, double the pace that would be consistent with a return to the Fed’s 2% target, and Wall Street banks responded by pushing their first rate-cut forecasts into 2027.
Core CPI, which strips out food and energy, rose to 2.8% year-over-year from 2.6% in March. That is the number worth watching closely. The one-percentage-point gap between headline and core readings is the central interpretive tension in this report: it suggests that much of the acceleration is concentrated in volatile categories rather than broad-based price pressure.
| Metric | March 2026 | April 2026 |
|---|---|---|
| Headline CPI (y/y) | 3.3% | 3.8% |
| Monthly CPI Change | — | +0.6% |
| Core CPI (y/y) | 2.6% | 2.8% |
Whether the headline or the core figure better represents the underlying trend is the question that divides analysts, and the question that should drive any portfolio response.
When big ASX news breaks, our subscribers know first
Why inflation hasn’t been defeated: understanding CPI and what drives it
Prices feel high. Groceries, insurance, rent: the categories that shape household budgets have been stubbornly elevated for over a year. CPI captures this by measuring the average change in prices paid by urban consumers across a basket of goods and services. But headline CPI and core CPI can diverge sharply when specific categories move in isolation.
The BLS CPI methodology and data define how the consumer price index basket is constructed and weighted across shelter, energy, food, and goods categories, which is why a single month’s divergence between headline and core readings can carry such different policy implications depending on which components are driving the move.
The main categories capable of inflating the headline figure disproportionately include:
- Shelter costs: The largest single component of CPI, reflecting rents and owners’ equivalent rent, which tend to be sticky and slow to reverse.
- Energy: Petrol and utility prices are volatile and can swing headline CPI by several tenths of a percentage point in a single month.
- Food: Subject to supply-chain disruptions, weather events, and trade policy changes.
- Tariff-sensitive imports: Consumer goods affected by trade levies can push headline inflation higher without reflecting domestic demand-side pressure.
Each of these categories can spike independently of underlying demand conditions. When several move together, as appears to have happened in April, headline CPI can jump without core inflation following at the same pace.
2022 vs. 2026: why the money supply comparison matters
The 2021-2022 inflation surge was partly fuelled by an unprecedented expansion of broad money supply, with year-over-year growth reaching as high as 30% during pandemic-era monetary interventions. That flood of liquidity created demand-side pressure across nearly every category simultaneously.
No comparable monetary expansion has occurred ahead of the April 2026 reading. This is one structural argument against a sustained resurgence: without excess money chasing goods, the transmission mechanism that drove inflation above 9% in mid-2022 is absent. That does not rule out persistence driven by tariffs or sticky services inflation, but it changes the risk profile meaningfully. Core CPI at 2.8% remains above the Fed’s 2% target, yet it is nowhere near the peaks of the prior cycle.
The stock market hit record highs on the same day: what that tells investors
On 13 May 2026, one day after the hottest CPI print in nearly three years and hours after the Senate confirmed a hawkish new Fed Chair, the S&P 500 closed at approximately 7,444, up 0.58-0.6% on the day. It was a record high.
The reaction, or rather the lack of a negative one, is instructive. Equity markets are forward-looking pricing mechanisms. By the time the CPI data hit at 8:30 a.m. ET on 12 May, much of the inflation anxiety had already been reflected in bond yields, options pricing, and sector rotation. The confirmation of Warsh the following day added another layer of uncertainty, yet equities absorbed both events without a meaningful decline.
The “wall of worry” is a market phenomenon in which equity indices climb despite, and sometimes because of, a stream of negative macro headlines. Investors who have already positioned defensively create a base of pent-up demand that supports prices when the feared outcome fails to materialise as severely as anticipated.
The 10-year Treasury yield settled near 4.47-4.48%, close to 2026 highs, reflecting genuine concern about rate policy. But the equity market’s message was different: corporate earnings growth and economic resilience, for now, outweigh the inflation signal. The session stands as a concrete reminder that selling equities on inflation headlines has frequently underperformed staying invested through periods of macro anxiety.
The pattern of equity markets price forward earnings rather than current headlines was reinforced in April 2026, when the S&P 500 gained 10.42% in a single month while the Strait of Hormuz remained partially blocked, with Goldman Sachs attributing the move to 11% projected EPS growth rather than any resolution of the underlying geopolitical risk.
Kevin Warsh at the Fed: a new chair, a hawkish bias, and fewer rate cuts ahead
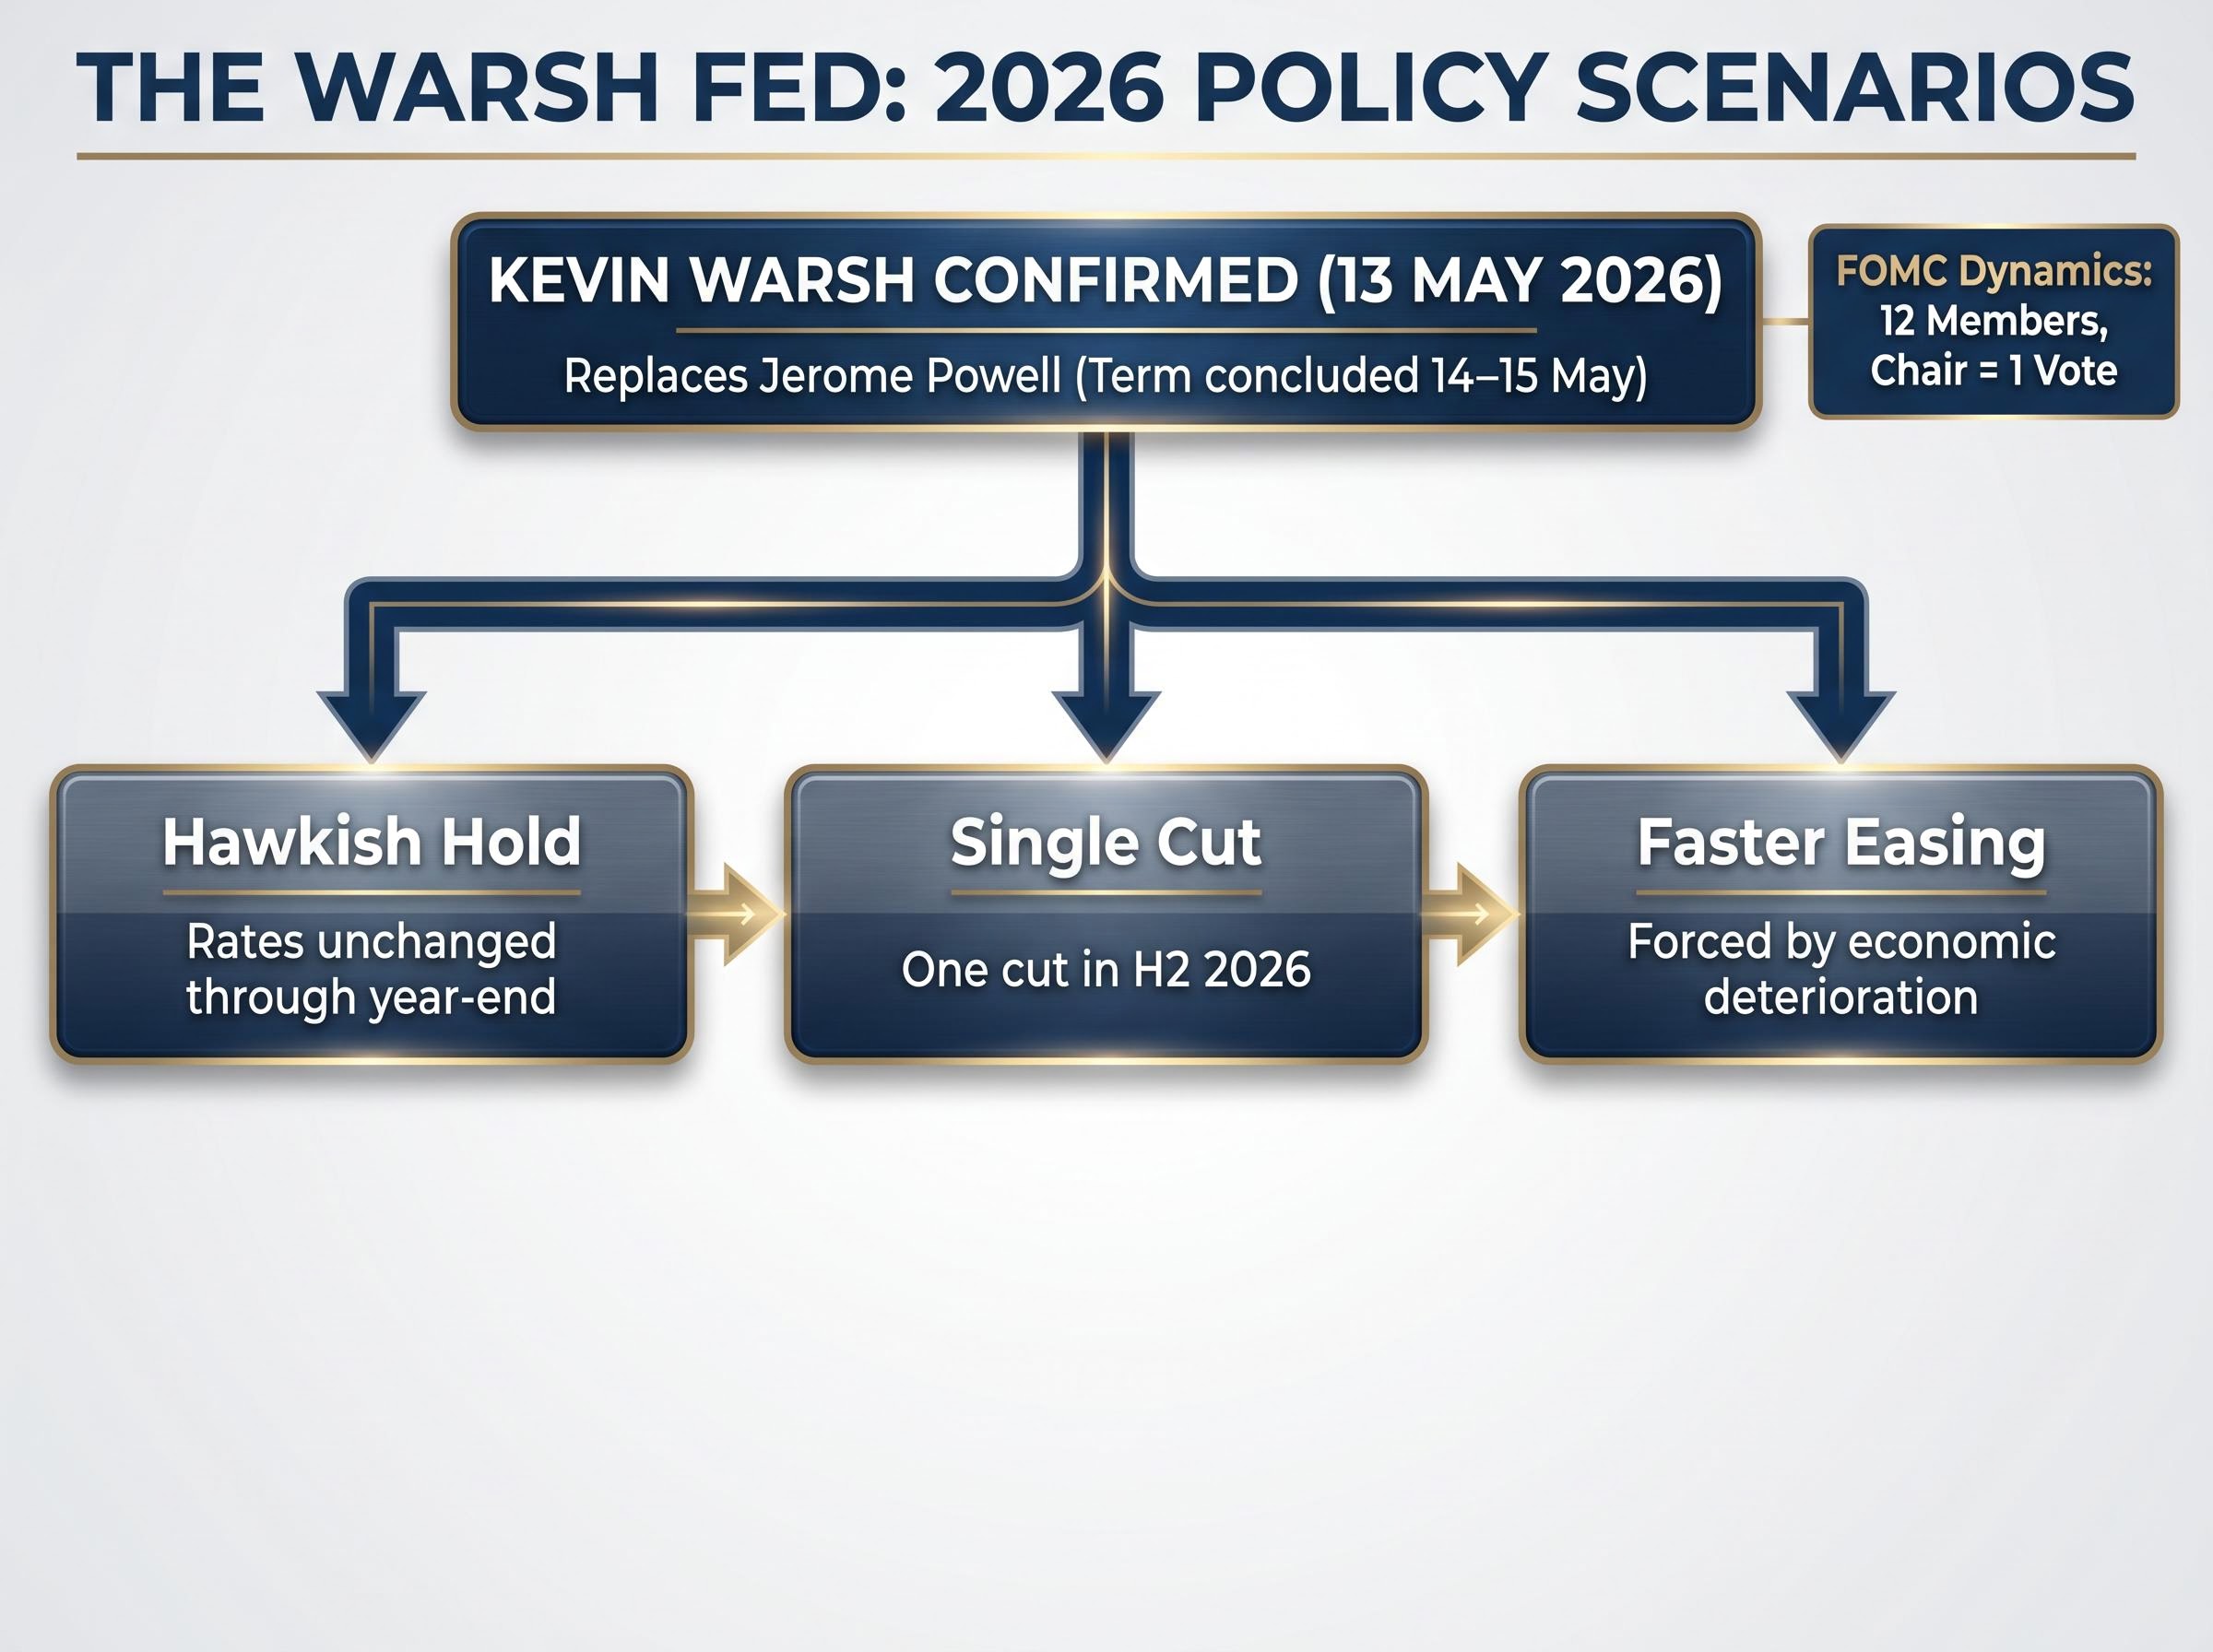
The Senate confirmed Kevin Warsh on 13 May 2026 by a 54-45 vote. He assumed the chair role replacing Jerome Powell, whose term concluded on 14-15 May. Warsh brings a reputation as a policy hawk, and fed-funds futures adjusted accordingly: markets are now pricing fewer rate cuts in 2026 than they were a week earlier.
Three scenarios capture the range of plausible Fed policy paths under Warsh for the remainder of 2026:
- Hawkish hold: The Fed keeps rates unchanged through year-end, citing persistent above-target inflation and a resilient labour market. This is the path currently best reflected in futures pricing.
- Single cut: If core CPI decelerates meaningfully over two to three consecutive prints, the FOMC delivers one cut in the second half of 2026 as a concession to slowing growth indicators.
- Faster easing: An unexpected deterioration in economic data (rising unemployment, credit stress) forces the Fed’s hand regardless of Warsh’s stated preferences.
How much can one Fed chair actually move rates?
The Federal Open Market Committee (FOMC) has 12 members, and the chair holds one vote. The chair leads deliberation, sets the agenda, and shapes the public narrative, but cannot unilaterally set the federal funds rate. Historical precedent reinforces this constraint: newly confirmed Fed chairs have frequently pursued policy directions that diverged from positions taken during confirmation hearings. The institutional dynamics of the FOMC tend to moderate any individual’s influence over time.
Investors recalibrating rate-cut timelines should weigh Warsh’s stated preferences against these structural realities.
Beyond rate decisions, Warsh has pledged to accelerate quantitative tightening, reducing the Fed’s $6.7 trillion balance sheet at a pace that could steepen the yield curve independently of where the federal funds rate sits, a dynamic that has historically pressured long-duration Treasuries and leveraged real estate even during cutting cycles.
Bond yields are rising but stocks keep climbing: how to read the divergence
The 10-year Treasury yield at approximately 4.47-4.48% and the S&P 500 at record highs represent two markets sending apparently contradictory signals. Bonds are pricing in a prolonged pause on rate cuts, possibly an extended period of restrictive monetary policy. Equities are pricing in continued earnings growth and an economy resilient enough to absorb higher borrowing costs.
Both signals can be correct simultaneously. Bond markets are reacting to the near-term inflation data and the hawkish shift at the Fed. Equity markets are looking through the inflation print toward corporate earnings, which have continued to grow, and toward the historical pattern in which moderate inflation (below 5%) has not prevented equity gains.
The practical implication is that investors do not need to choose sides. Rather than treating either signal as definitive, the divergence argues for maintaining diversified positioning.
Sectors most exposed to prolonged high yields include:
- Utilities: Higher discount rates compress valuations for yield-sensitive equities.
- Real estate investment trusts (REITs): Elevated mortgage and financing costs weigh on property valuations and transaction volumes.
- Consumer discretionary (credit-dependent): Higher borrowing costs reduce consumer purchasing power for financed goods.
Sectors historically more resilient in high-yield environments include:
- Energy: Benefits from the inflationary commodity price environment.
- Financials: Net interest margins widen when rates remain elevated.
- Short-duration value stocks: Less sensitive to discount rate changes than long-duration growth equities.
Inflation anxiety is the wall, not the ceiling: what investors should do now
Three analytical conclusions emerge from the data and market action of the past week. First, the re-acceleration in headline CPI is real, but structurally different from 2022: the absence of a comparable money supply expansion limits the probability of a sustained resurgence. Second, the Warsh Fed adds a hawkish bias to monetary policy but does not represent a policy cliff; the FOMC’s collective structure constrains any single chair’s influence. Third, equity markets absorbed both shocks, the hot CPI print and the leadership transition, without a meaningful decline.
Inflation anxiety is functioning as a wall of worry rather than a ceiling on returns. Markets have historically climbed these walls when the underlying economic fundamentals, earnings growth, labour market strength, and consumer spending, remain intact.
Core CPI at 2.8% is above the Fed’s 2% target but well below 2022 peaks. Fed-funds futures reflect a hawkish near-term bias, not a rate-hike cycle. The S&P 500 at record highs suggests the market has already processed the dual shock.
Specific considerations for investors navigating this environment:
- Monitor the core CPI trend over the next three to six months for confirmation of whether the April print represents a new trajectory or a one-month anomaly.
- Review exposure to rate-sensitive sectors (utilities, REITs, long-duration bonds) and assess whether current allocations reflect a prolonged high-yield scenario.
- Avoid overweighting cash or short-term instruments based on a single print; the opportunity cost of mistiming inflation peaks has historically exceeded the cost of staying invested.
- Maintain diversified equity exposure across both rate-sensitive and rate-resilient sectors rather than making concentrated tactical bets on a single macro outcome.
Investors wanting to translate this macro framework into specific portfolio adjustments will find our dedicated guide to inflation investment strategy, which maps the case for Treasury Inflation-Protected Securities, commodity equities, and quality-factor stocks, and outlines a dollar-cost-averaging approach designed to build positions through inflationary volatility rather than waiting for an all-clear signal.
This article is for informational purposes only and should not be considered financial advice. Investors should conduct their own research and consult with financial professionals before making investment decisions. Past performance does not guarantee future results. Financial projections are subject to market conditions and various risk factors.