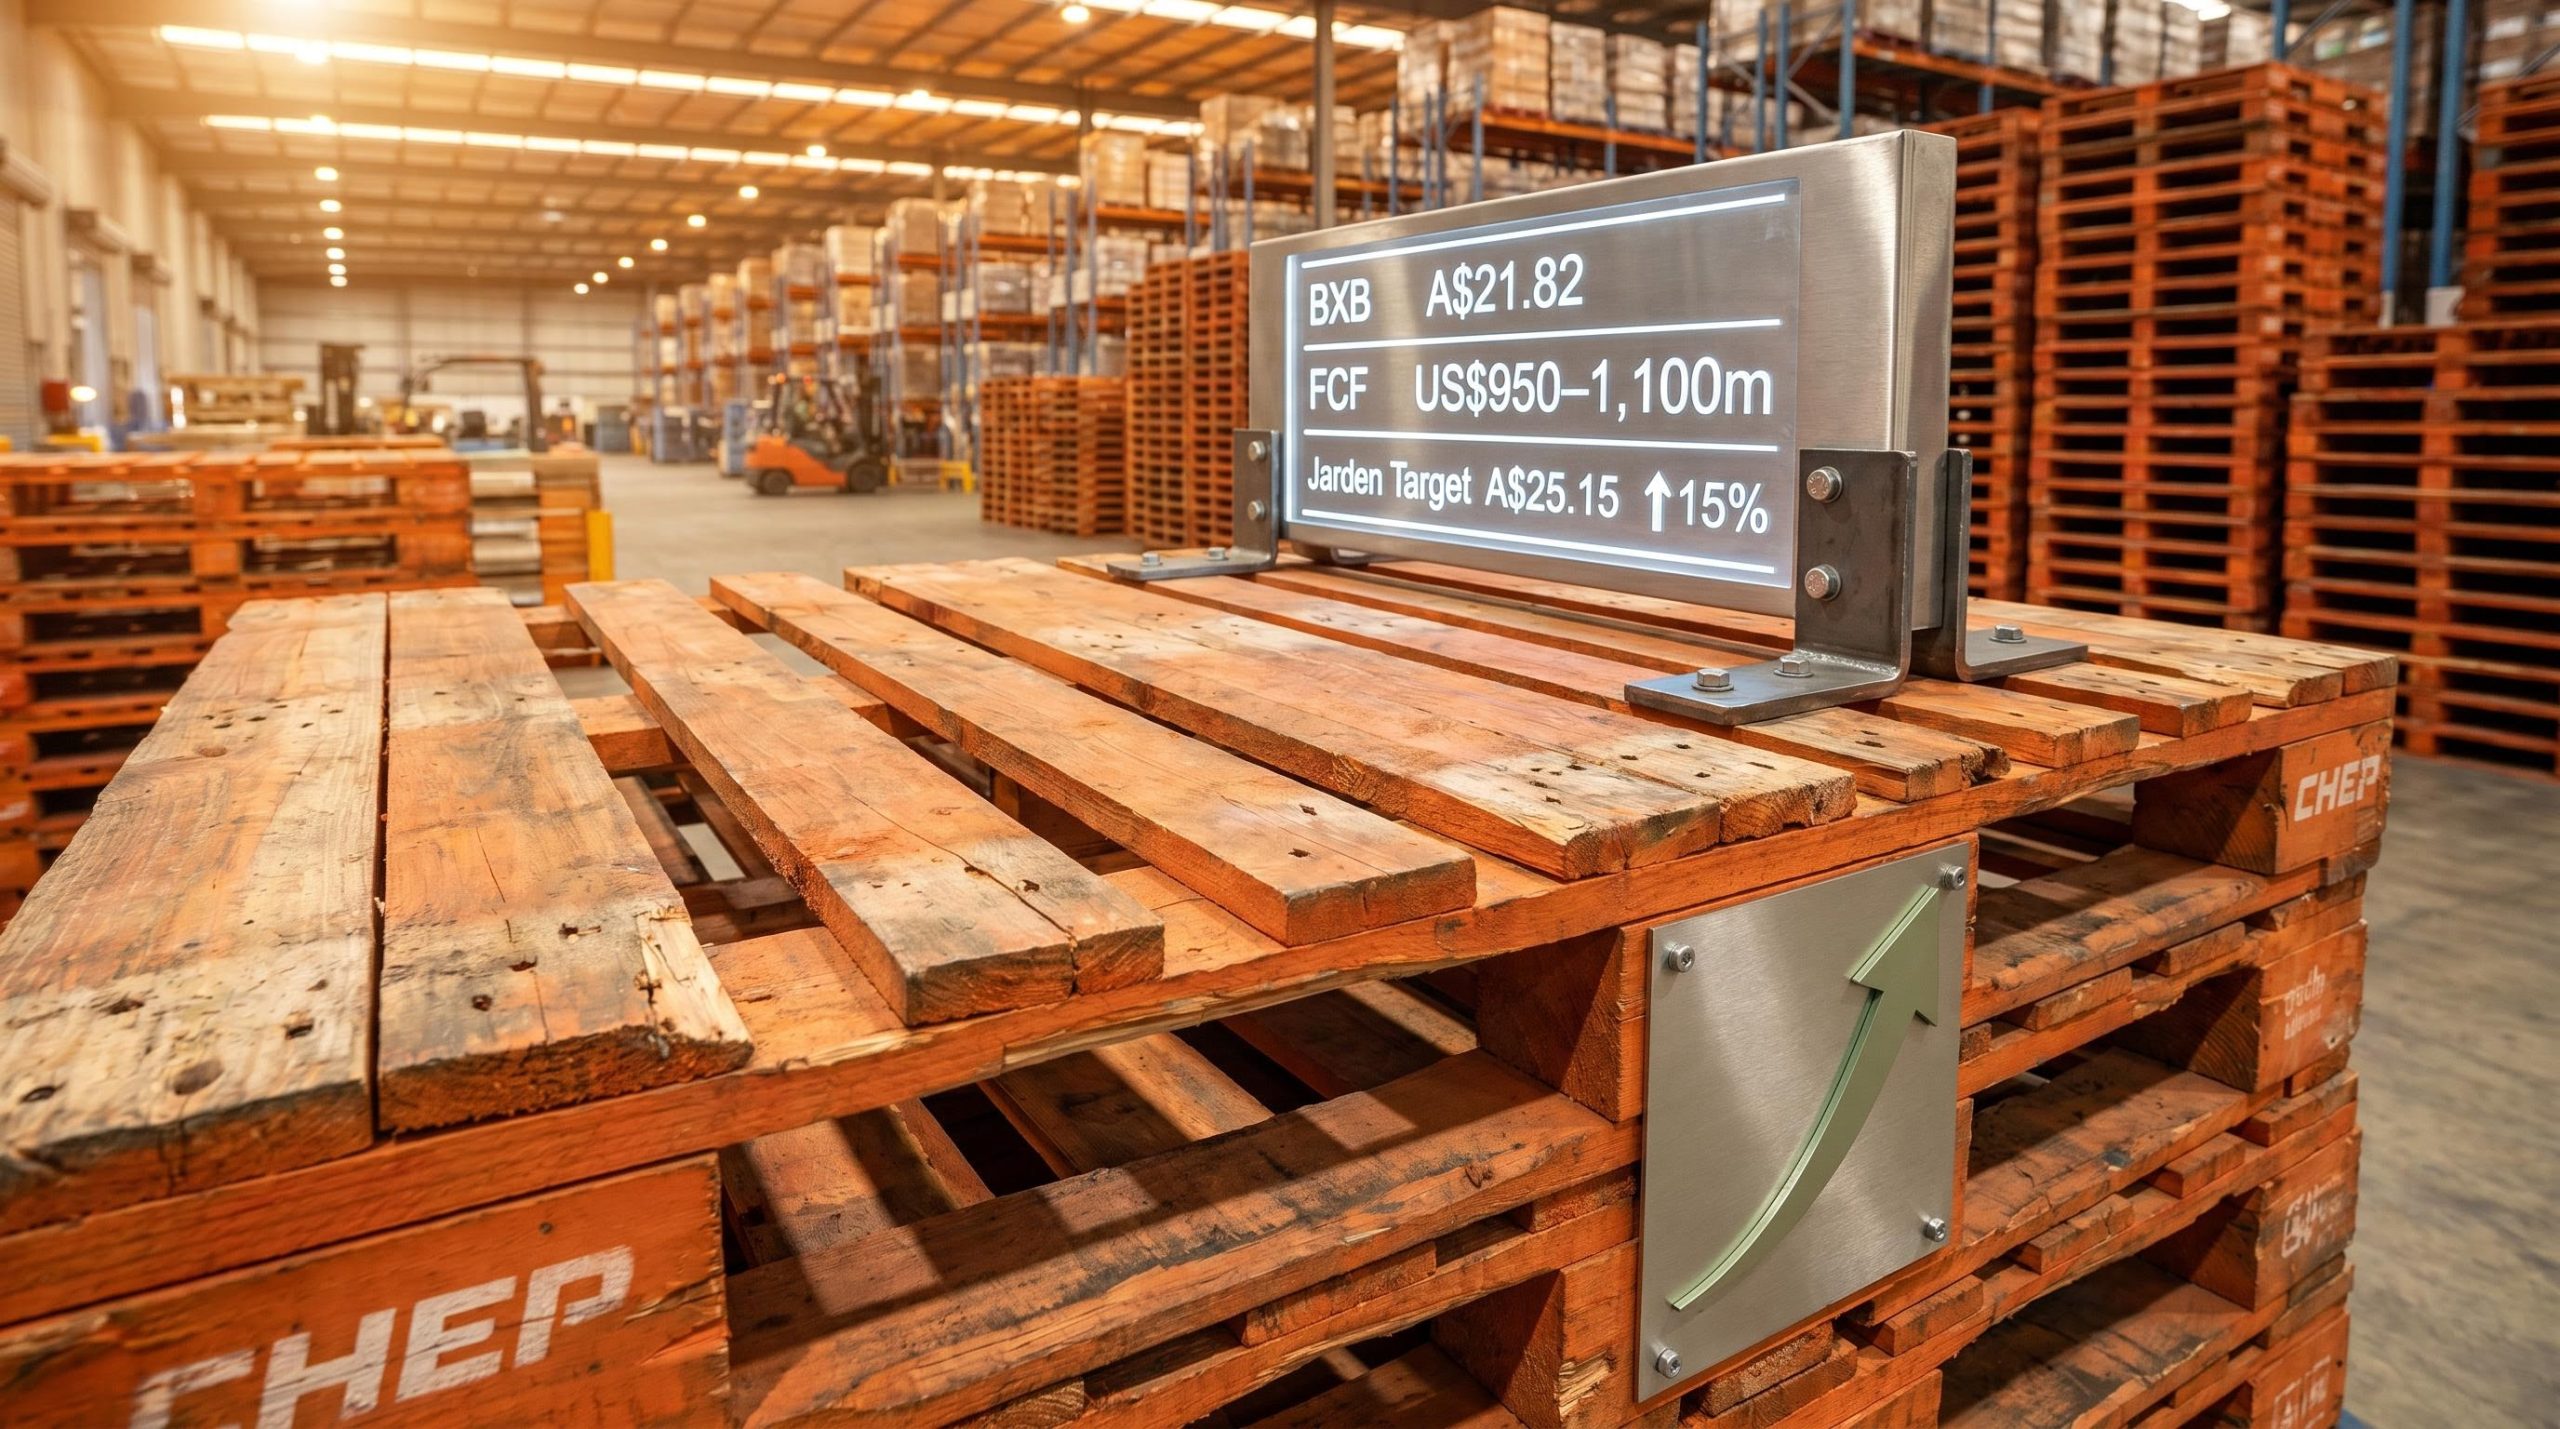
At a verified closing price of A$21.82 on 14 May 2026, Brambles (ASX: BXB) sits roughly 15% below the Jarden analyst price target of A$25.15, yet its dividend yield has compressed to approximately 2.33%, below the five-year historical average of 2.66%. That combination sends mixed signals to value-conscious investors.
The 1H26 results released in February 2026 delivered a free cash flow guidance upgrade to US$950-1,100m and underlying profit growth of 8-11% at constant currency, making BXB one of the few ASX industrials names with accelerating cash conversion in a soft consumer demand environment. That operational momentum is now offset by an unresolved adverse class action judgment handed down in April 2026, the first successful shareholder class action trial on both liability and loss in Australian history.
This analysis provides Australian investors with a structured framework to assess whether BXB at current prices represents a reasonable entry point or a premium to fair value, covering the business model, recent financial performance, dividend yield benchmarking, sector positioning, and the risks that complicate the bull case.
What Brambles actually sells, and why it is hard to replicate
Brambles operates a hire-and-return pooling model under the CHEP brand. The mechanics are straightforward, but the economics they generate are not.
- Manufacturers hire CHEP pallets to ship goods to retailers
- Retailers receive goods and return pallets into the pooling network
- Brambles collects a hire fee at each transfer point in the cycle
This model produces recurring, usage-based revenue tied directly to the volume of goods moving through consumer supply chains. Brambles operates across three geographic segments (Asia-Pacific, Americas, and EMEA), embedding itself in fast-moving consumer goods (FMCG) and food and beverage supply chains where switching to an alternative provider would require significant logistics disruption. According to Rask Invest research, Brambles’ services are “deeply embedded in everyday commerce,” with the company delivering a revenue compound annual growth rate (CAGR) of 7.6% over the prior three-year period.
The competitive moat: network scale and customer lock-in
Pallet pooling economics improve with scale. The larger the installed fleet, the lower the per-unit cost of retrieval and servicing, and the harder it becomes for a new entrant to match geographic coverage or price competitiveness. Service density, retrieval efficiency, and pricing power all compound as the network grows.
Strong net new business wins in 1H26 indicate Brambles is gaining market share even in a soft macro environment. That pattern reinforces the durability of the moat: customers are choosing CHEP over alternatives precisely when cost discipline matters most.
When big ASX news breaks, our subscribers know first
How the 1H26 numbers changed the investment conversation
The headline revenue growth figure from Brambles’ 1H26 results was modest: +2% at constant currency. The earnings growth underneath it told a different story.
Operating profit after tax rose 11% to US$507.4m. Basic earnings per share climbed 13% to 37.2 US cents. Underlying profit reached US$792.0m, up 7% at constant currency, or +9% excluding approximately US$15m of one-off restructuring costs. Return on capital invested (ROCI) hit 24.3%, up 1.1 percentage points, a signal that capital efficiency is improving rather than costs simply being cut.
| Metric | 1H26 Result | Growth (Constant FX) |
|---|---|---|
| Sales Revenue | US$3,533.5m | +2% |
| Underlying Profit | US$792.0m | +7% (+9% ex restructuring) |
| Basic EPS (Continuing Ops) | 37.2 US cents | +13% |
| FCF Before Dividends | US$481.7m | Up US$52.5m YoY |
The single most commercially significant signal, however, was the free cash flow guidance upgrade.
FY26 FCF Guidance Upgraded Brambles raised its FY26 free cash flow guidance to US$950-1,100m, up from a prior range of US$850-950m, driven by lower pooling capex, disciplined deferral of automation investment, and ongoing cost efficiencies.
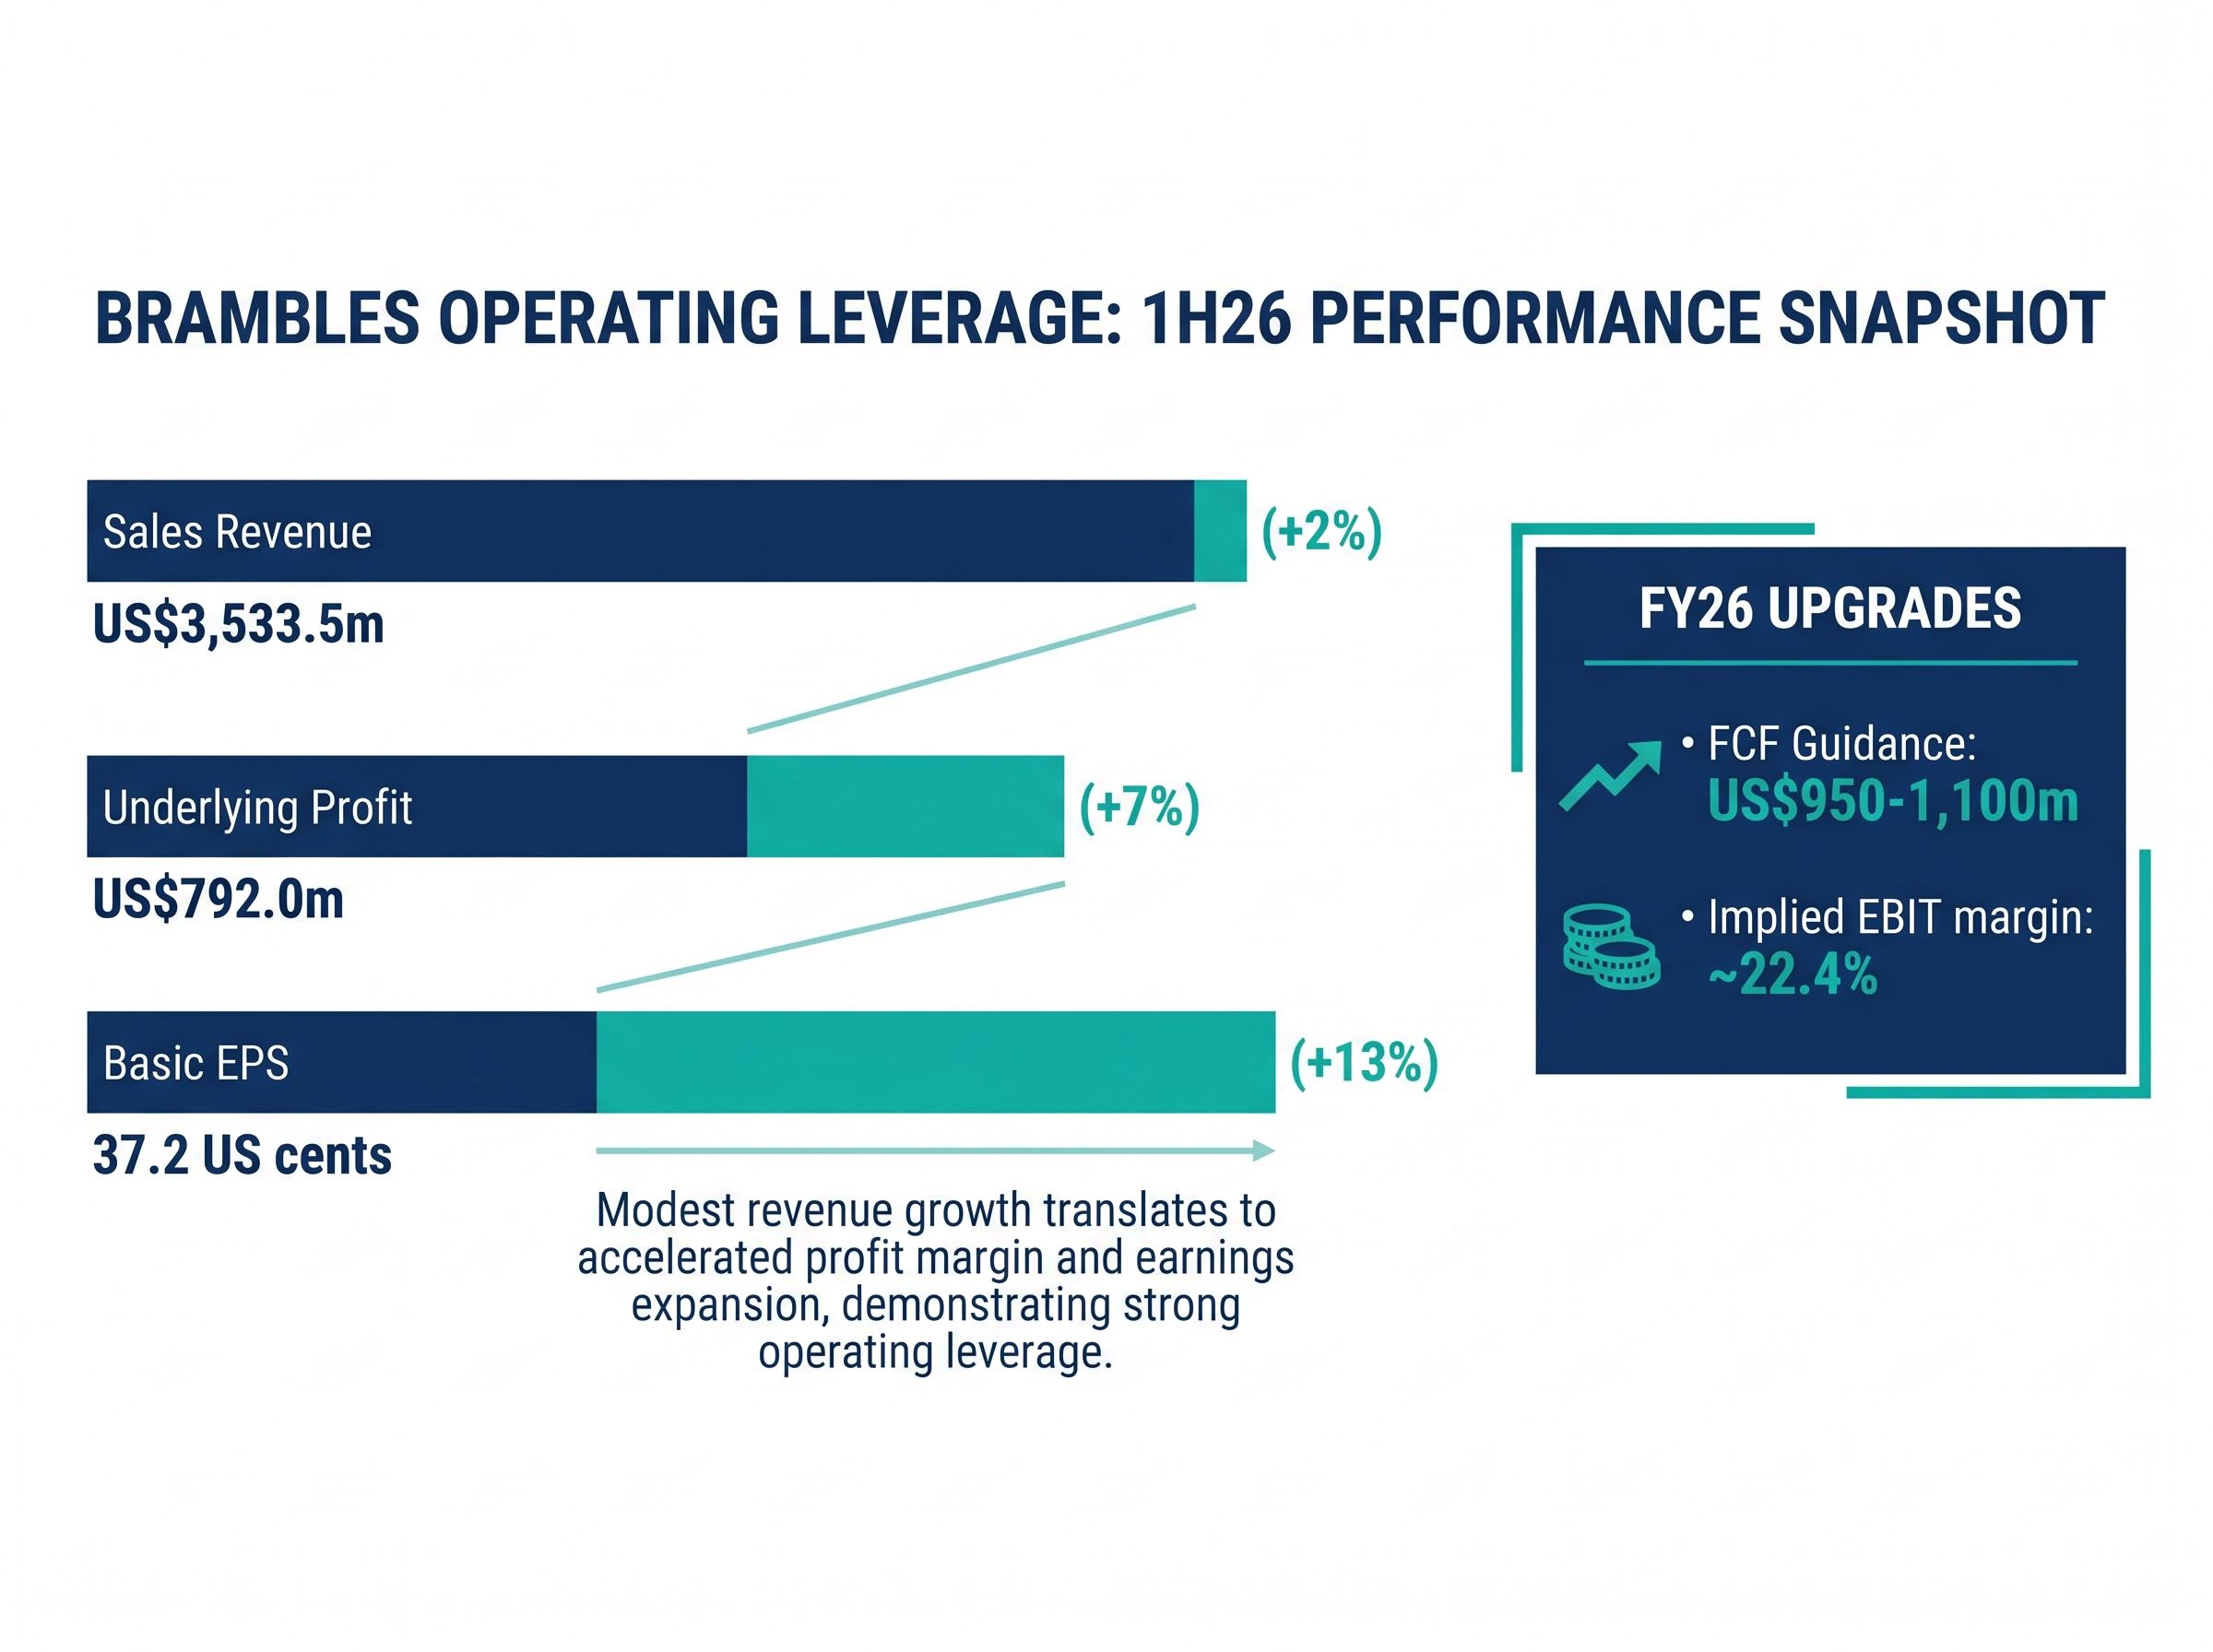
That upgrade, paired with a US$400m on-market share buyback authorisation (of which US$191m was purchased in 1H26), signals a business entering an operating leverage phase. Incremental revenue is converting to profit and cash at a substantially higher rate. The implied underlying EBIT margin sits at approximately 22.4%. For investors, the gap between 2% revenue growth and 11-13% earnings growth is the thesis in a single number.
The profit compounding dynamics at Brambles become clearer when viewed across a three-year window: net profit has grown from US$523 million to US$780 million at a 14.3% CAGR, nearly double the 7.6% revenue growth rate, with return on equity sitting at 25.6% and a debt-to-equity ratio of 81.8% confirming that margin expansion is being achieved without aggressive leverage.
What dividend yield and analyst targets say about current pricing
Dividend yield, stripped of complexity, functions as a quick-read valuation signal. When a company’s current yield falls below its historical average, the share price has risen faster than dividends, meaning the market is pricing in future growth or quality at a premium to past norms.
At A$21.82, Brambles’ implied yield of approximately 2.33% sits below the five-year historical average of approximately 2.66-2.70%. The interim dividend of 23.0 US cents per share, paid in April 2026, represented a 21% increase on 1H25, with the payout ratio at 60.5% (up from 58% in the prior corresponding period). Dividends are growing, but the share price has already absorbed that growth into the valuation.
| Valuation Signal | Current | Historical / Target | Implication |
|---|---|---|---|
| Dividend Yield | ~2.33% | ~2.66% (5-yr avg) | Priced above historical norms |
| Jarden Price Target | A$21.82 | A$25.15 (Overweight) | ~15% implied upside |
| Simply Wall St Consensus* | A$21.82 | ~A$26.06 | Directional only (unverified) |
Jarden’s price target of A$25.15, rated Overweight as at 14 May 2026, implies approximately 15% upside from the verified closing price. A broader consensus figure of approximately A$26.06 from Simply Wall St cannot be independently confirmed and should be treated as directional rather than definitive.
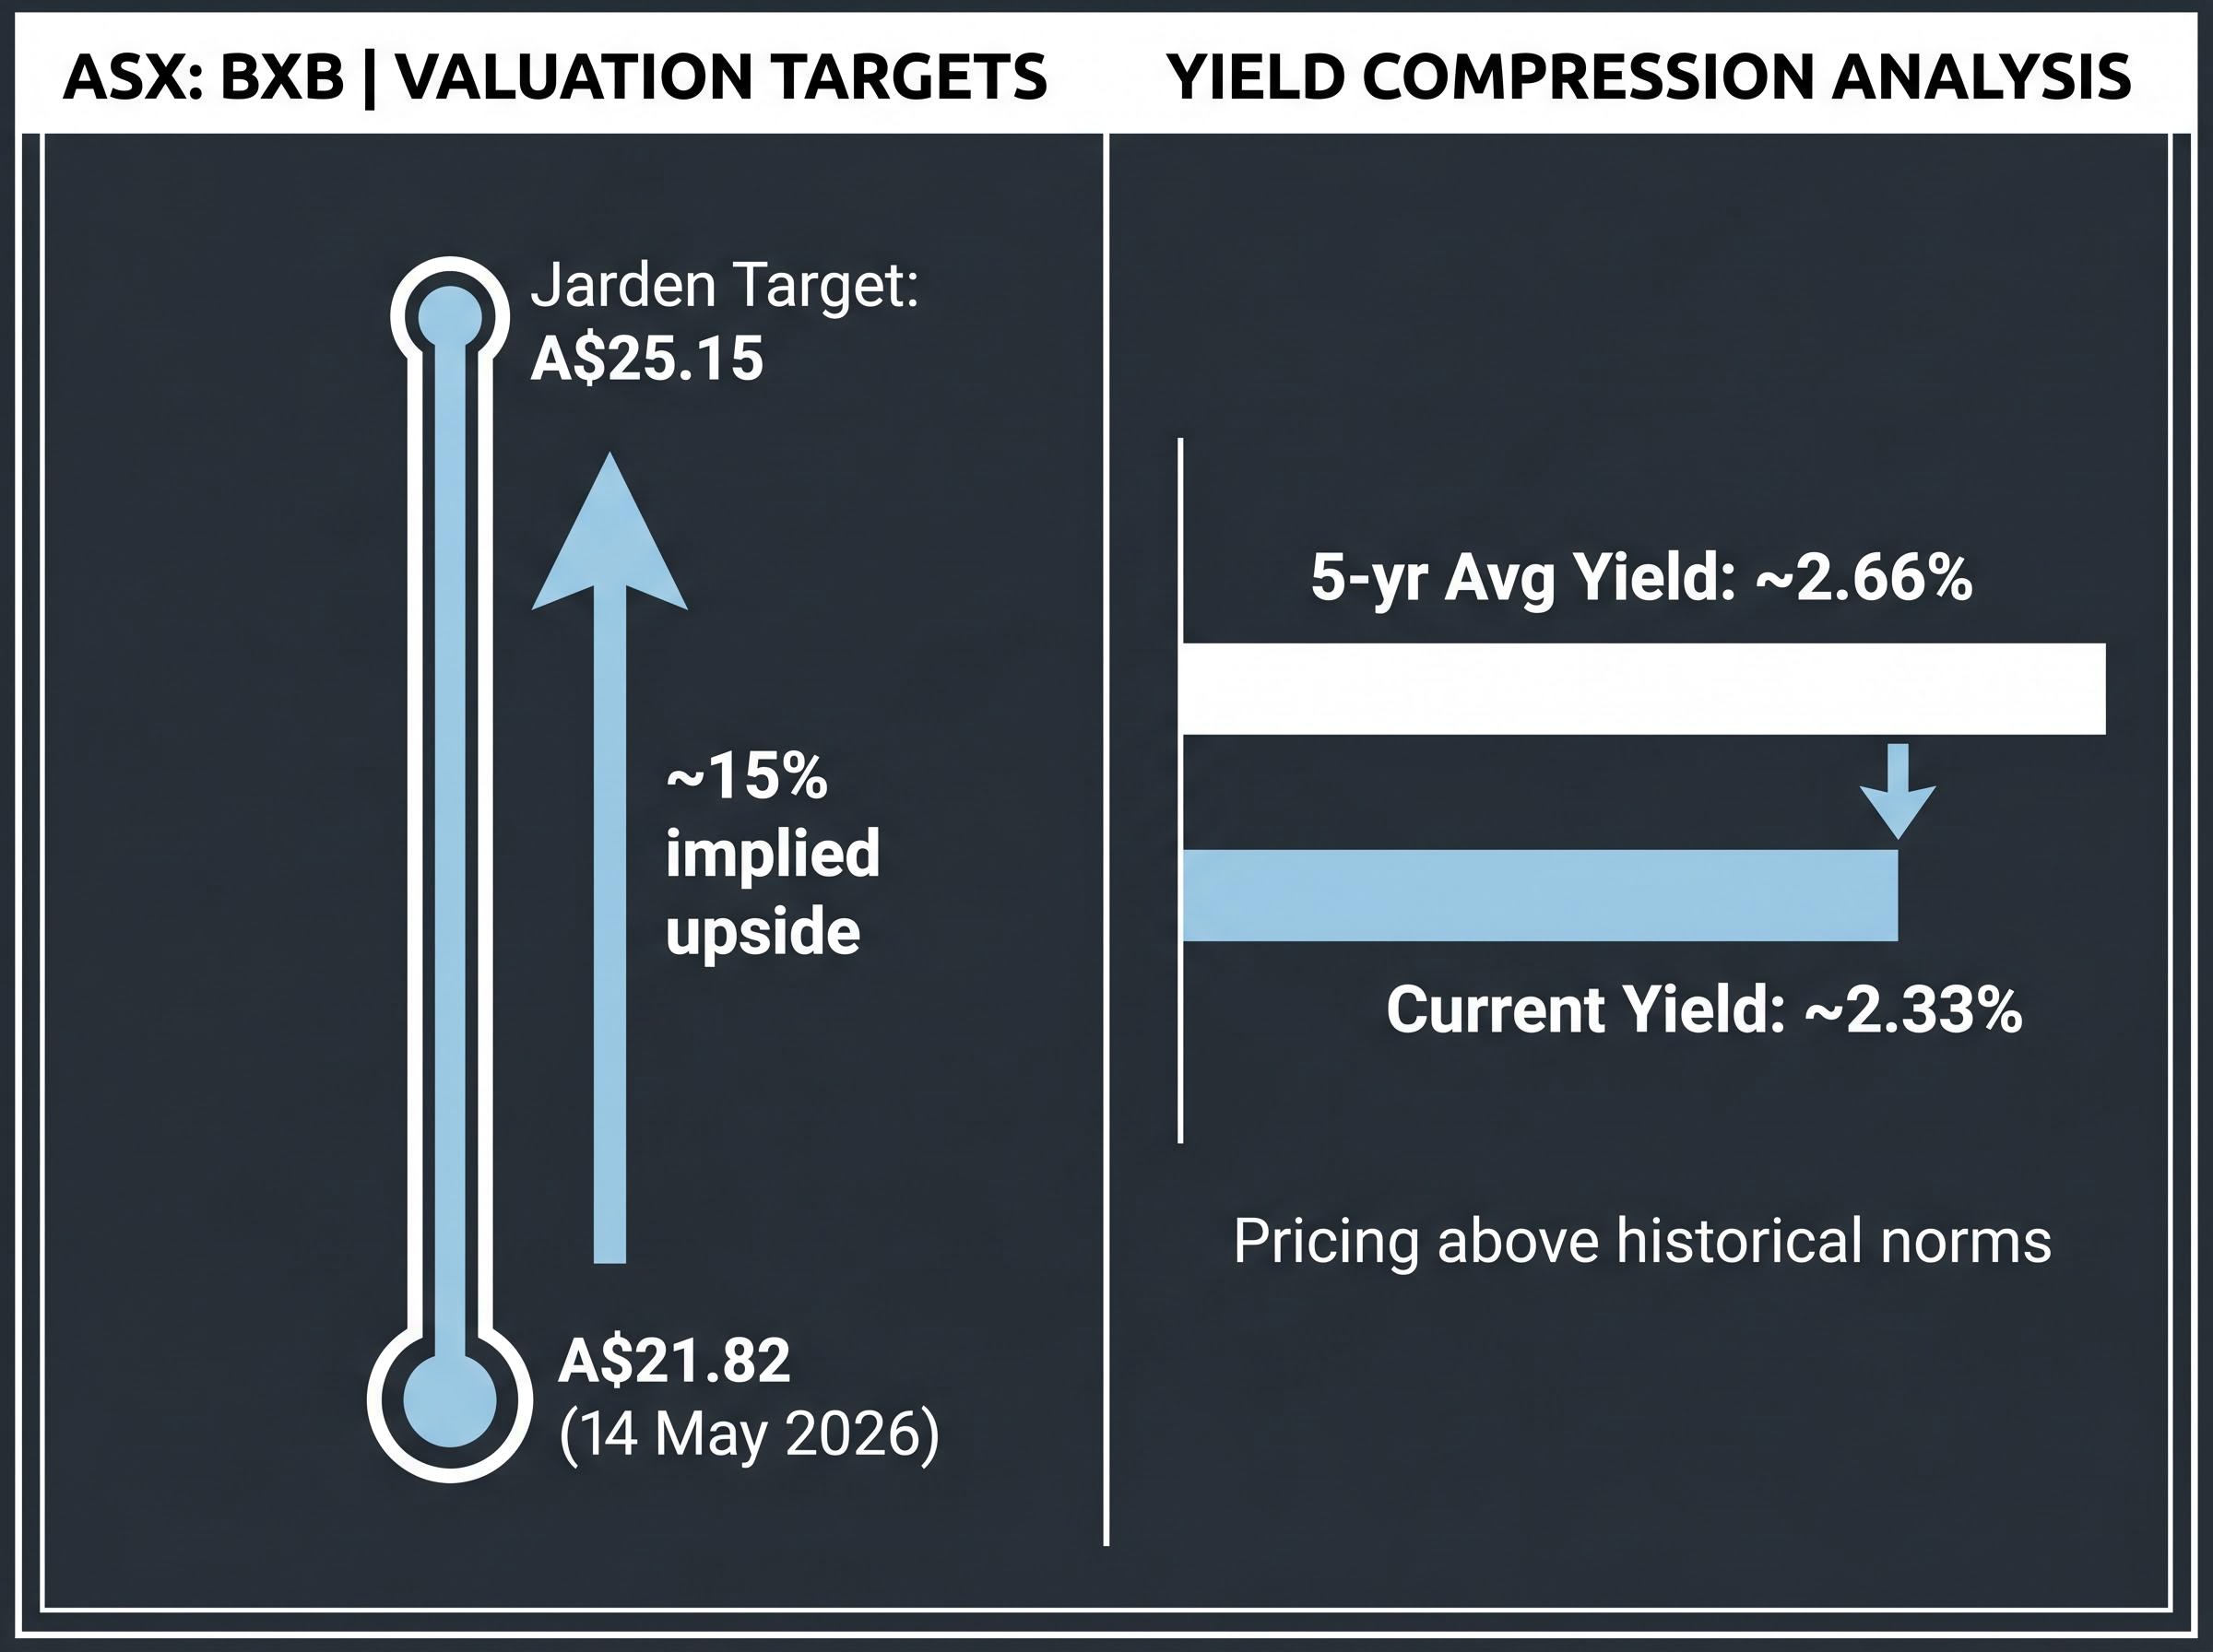
The yield compression tells one story: BXB is not cheap by its own historical standards. The analyst targets tell another: the premium may still have room to narrow if the earnings trajectory holds.
Investors wanting to model the full income and capital return picture, including how the ongoing US$400 million buyback program lifts the effective yield to approximately 4.7% when combined with dividends, will find our full explainer on total shareholder yield for BXB, which works through the buyback mechanics, payout ratio policy, and the scenarios under which the headline yield re-rates toward or above historical averages.
Beyond yield: what DCF and DDM add to the picture
Discounted cash flow (DCF) analysis estimates a company’s value by projecting future cash flows and discounting them back to present value. A Dividend Discount Model (DDM) applies a similar logic specifically to expected dividend payments. At 8-11% underlying profit growth and US$950-1,100m in FCF, the inputs to both frameworks favour a fair value range above current prices. The range is sensitive to terminal growth rate and discount rate assumptions, and the class action overhang (covered below) materially complicates any point estimate of intrinsic value.
Pallet pooling in the context of the ASX Industrials sector
Australian investors often approach ASX Industrials as a source of revenue predictability. Companies such as Transurban generate toll road revenue under long-term concession agreements. Downer EDI operates under government infrastructure contracts. The category broadly offers income stability tied to essential service usage or contracted obligations.
Brambles fits this category but does not resemble these peers.
- Revenue source: Hire fees from FMCG supply chain usage, not government contracts or concessions
- Geographic exposure: Global operations across three continents, not domestically concentrated
- Volume driver: Consumer goods demand, not infrastructure capital programmes
ASX Industrials Sector Performance The ASX Industrials Index delivered a five-year return of 6.1%, compared with the ASX 200’s 4.2% over the same period, according to Rask Invest analysis published in May 2026.
Brambles’ own 12-month share price change of approximately +1.02% to mid-May 2026 has not made it a standout performer in recent months, though the longer-term revenue CAGR of 7.6% reflects consistent compounding. The company’s #2 industry ranking in the Dow Jones Best-in-Class World Index, announced on 1 May 2026, and the launch of its 2030 Sustainability Programme in September 2025 reinforce the circular economy positioning that supports ESG-mandated institutional demand.
For investors evaluating BXB as a sector allocation, the distinction matters: this is a global circular economy business with consumer goods exposure, not a domestically contracted infrastructure play, and that shapes both the risk profile and the appropriate valuation framework.
The risks that complicate the bull case
On 13 April 2026, the Federal Court ruled in favour of applicants in a shareholder class action against Brambles, finding the company liable for allegedly misleading profit guidance in 2016-17. According to Maurice Blackburn and reporting by the Australian Financial Review, the judgment represents the first successful shareholder class action trial on both liability and loss in Australian history.
MinterEllison’s analysis of the Brambles ruling confirms that the Federal Court established liability, causation, and loss simultaneously, the first time all three elements have been proven together in an Australian shareholder class action, setting a precedent that extends well beyond Brambles itself.
Material Legal Risk The financial quantum of damages has not been publicly confirmed as of 14 May 2026. An unknown liability of potentially material scale introduces open-ended uncertainty into any intrinsic value calculation.
ASX shareholder class action settlements in recent history have varied widely in cost and market impact: the a2 Milk Company reached a $62 million resolution in April 2026 that was fully covered by existing insurance policies, producing zero earnings impact and allowing the company to remove a long-running legal overhang without any admission of liability, a precedent that illustrates both the range of outcomes available to defendants and the central role of Directors and Officers insurance coverage in determining shareholder cost.
The class action is the most consequential near-term risk. It is not the only one.
- Legal and governance: Adverse class action judgment with unquantified damages; precedent-setting ruling creates reputational and financial uncertainty
- Cyclical demand: Like-for-like volumes were flat in 1H26 despite strong new business wins; FY26 revenue growth guidance narrowed to 3-4% (from 3-5%), reflecting weak consumer demand in the US and Europe
- Capex reversal: The FCF upgrade partly reflects deferred automation and digital investment; if Brambles accelerates that spending in FY27, the cash flow profile reverts, and the market may not currently be pricing that possibility
- Currency translation: Brambles reports in US dollars; a strengthening Australian dollar reduces reported earnings in AUD terms, a standard but persistent risk for Australian holders
BXB’s 12-month share price change of approximately +1.02% underscores that the market has not recently rewarded the stock with momentum. The 15% implied upside to the Jarden target is not a free lunch. It is a premium for absorbing these risks.
BXB at A$21.82: premium quality, one unresolved question
The investment case for Brambles at current prices reduces to three scenarios.
| Scenario | Key Assumptions | Share Price Implication |
|---|---|---|
| Bull | Operating leverage continues; FCF at top of US$950-1,100m range; class action settled at manageable cost; ESG flows support valuation | Re-rates toward analyst targets (A$25+) |
| Base | Revenue +3-4%, underlying profit +8-11% (constant FX); FCF within guidance; class action overhang persists but contained | Trades modestly below analyst fair value; gradual compression of discount |
| Bear | Consumer demand weakness persists; material class action settlement; capex deferrals reverse in FY27; AUD strength compresses reported earnings | Downside risk to current levels; yield expands toward historical average |
FY26 guidance points to revenue growth of 3-4%, underlying profit growth of 8-11% at constant currency, and FCF of US$950-1,100m. The interim dividend rose 21% year-on-year, with a payout ratio of 60.5%. Jarden’s target of A$25.15 implies approximately 15% upside.
The quality of the business is not in question. The unresolved question is the class action, and until a damages quantum or settlement figure appears in an ASX filing, that uncertainty should inform position sizing.
Three data points warrant monitoring:
- Class action provision disclosure via ASX announcement
- FY26 full-year results versus guidance (expected August 2026)
- AUD/USD movements relative to any hedging disclosures in Brambles’ reporting
This article is for informational purposes only and should not be considered financial advice. Investors should conduct their own research and consult with financial professionals before making investment decisions. Past performance does not guarantee future results. Financial projections are subject to market conditions and various risk factors.