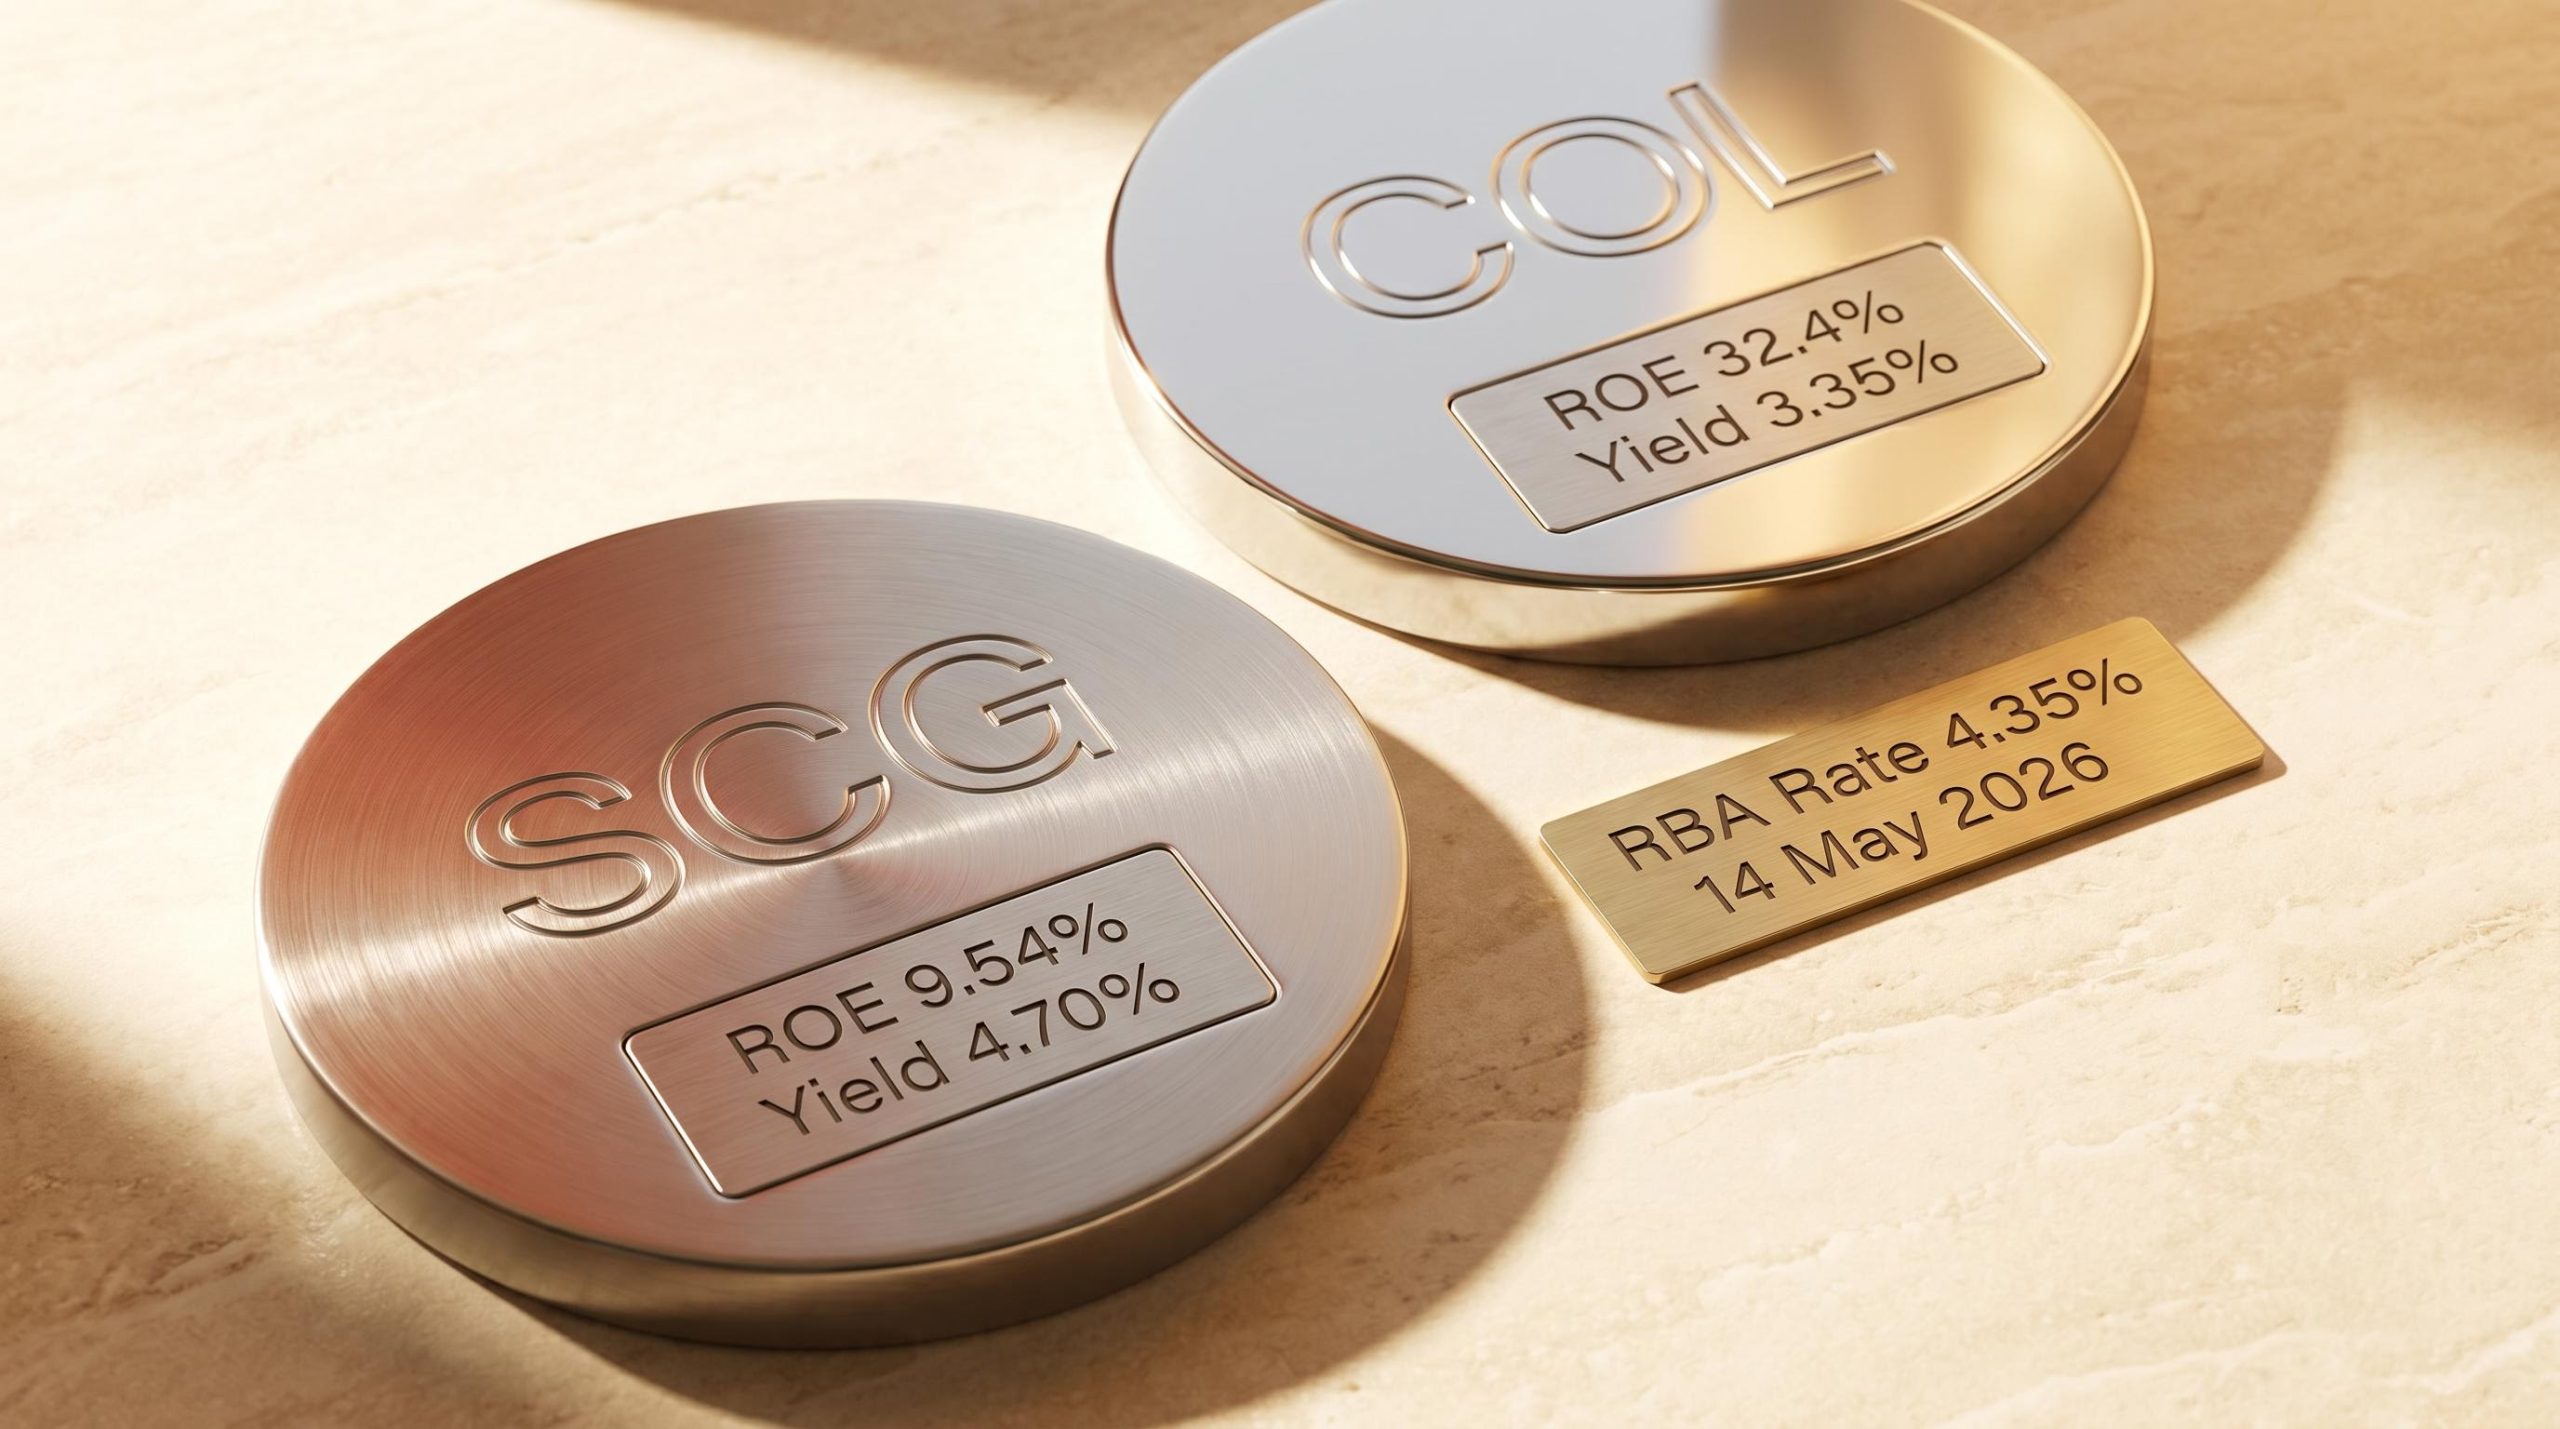
Two ASX blue chips, both trading well below recent highs in May 2026, both paying dividends, and yet one earns 32.4% on shareholder equity while the other earns 9.54%. The number on the label says “blue chip”; the numbers inside the business tell a different story.
With the RBA cash rate back at 4.35% following three consecutive hikes in 2026, Australian income investors face a more complicated environment than they did 12 months ago. Term deposits are competitive again. Property trusts are caught in a rising-rate vice. Supermarket stocks are trading above what at least one major research house considers fair value. Scentre Group (ASX: SCG) and Coles Group (ASX: COL) sit at opposite ends of the blue-chip income spectrum, yet both are routinely mentioned in the same breath by retail investors.
What follows runs both stocks through the three metrics that matter most for income investors: return on equity, dividend yield relative to historical averages, and debt-to-equity ratio in its proper context. The result is a clear picture of which business is genuinely rewarding shareholders and which is offering the appearance of safety without the substance.
What “blue chip” actually means when rates are rising
For income investors, the blue-chip designation implies three things: consistent dividends, durable earnings, and a balance sheet that can absorb economic stress. In stable rate environments, a wide range of ASX names qualify. When rates move sharply, the label gets tested.
The RBA’s 2026 trajectory has been exactly that kind of test.
The RBA cash rate decision on 5 May 2026 saw eight of nine Board members vote for the hike, with forward guidance language deliberately preserving optionality on whether a fourth increase follows in July, a posture that leaves rate-sensitive assets like REITs in an extended holding pattern.
After cutting rates through 2025 to approximately 3.6%, the RBA reversed course entirely. Three consecutive hikes in 2026 returned the cash rate to 4.35% as of 14 May 2026, a level last seen before the easing cycle began.
The RBA’s May 2026 rate decision, which lifted the cash rate to 4.35%, cited persistent inflation in the second half of 2025 and elevated fuel costs as the primary drivers, confirming that the hiking cycle reflects underlying economic pressures rather than a short-term policy adjustment.
That reversal matters because it separates blue chips whose income appeal rests on low-cost debt and compressed capitalisation rates from those whose earnings power is structurally durable. Dividend yields of 4%-5% from selected ASX income shares now compete directly with risk-free alternatives. The label “blue chip” is a starting point for evaluation, not the conclusion.
When big ASX news breaks, our subscribers know first
The metrics that separate genuine blue chips from blue-chip cosplay
Before any stock-specific numbers appear, three metrics deserve explanation. These are the filters that prevent yield-chasing from becoming a value trap.
- Return on equity (ROE): This measures how effectively a company converts shareholder capital into profit. A figure above 10% is generally expected from mature, established businesses. Below that threshold, the company may be growing distributions from a shrinking earnings base, which is not sustainable.
- Dividend yield relative to historical average: A stock’s current yield compared to its own 5-year average reveals whether the share price is elevated or depressed relative to distributions. A yield below the historical average often signals a price that has run ahead of payouts, not a generous income stream.
- Debt-to-equity ratio (D/E), in context: The headline number can mislead without understanding how accounting standards treat different business models. A property trust’s D/E reflects long-duration assets conventionally funded with debt; a retailer’s D/E may be dominated by lease liabilities that are not traditional financial debt.
Why the debt number alone can mislead you
The Australian Accounting Standards Board’s AASB 16 standard requires companies to recognise operating lease commitments (such as store leases) as liabilities on the balance sheet. For a supermarket operator running hundreds of leased stores, this treatment inflates the headline D/E ratio dramatically, even when the underlying business carries investment-grade credit ratings and near-total cash conversion.
The AASB 16 lease accounting standard requires lessees to recognise assets and liabilities for all leases with terms exceeding 12 months, which means a supermarket operator running hundreds of leased stores will carry a substantially higher headline D/E ratio than its underlying financial debt position would otherwise suggest.
Credit ratings and cash conversion are more reliable proxies for debt risk in capital-light retail businesses than the headline D/E figure.
Scentre Group’s numbers up close: the yield is real, but the rate risk is too
Scentre Group’s trailing dividend yield of 4.70% is the higher headline number in this comparison, and the distribution trajectory supports it. According to Rask Media (4 May 2026), SCG’s annual report shows distributions have been growing year on year despite the share price pullback.
Rask Media (4 May 2026): “In the case of SCG, the annual report shows last year’s dividend was greater than the 3-year average, so the dividend has been growing.”
The ROE improvement is also real. SCG’s trailing twelve-month ROE has risen to 9.54%, a meaningful recovery from the CY23 figure of 1.0%, though it still sits just below the 10% threshold for established businesses. The balance sheet has tightened too, with D/E falling to 79.16% from 87.3% in CY23.
| Metric | SCG Value | Context |
|---|---|---|
| Trailing Yield | 4.70% | Below 5-year avg of 4.78% |
| YTD Price Change | -9.52% | As of 14 May 2026 |
| TTM ROE | 9.54% | Up from 1.0% in CY23 |
| Debt/Equity | 79.16% | Conventional REIT leverage |
| Forward Yield | ~4.66% | Distribution growth supports |
The complication is structural. Rising rates increase SCG’s debt servicing costs, push capitalisation rates upward, and compress property valuations. The $240 million Westfield Bondi Junction redevelopment is a medium-term earnings catalyst, and portfolio occupancy sits above 99% with annual foot traffic exceeding 500 million visitors. The operational story is improving. The macro environment, with the RBA actively hiking, is working against it.
An extended rate plateau, with Westpac projecting the cash rate reaching 4.85% by August 2026 and all four major banks forecasting rates at or near peak through at least mid-2027, is a materially different headwind for property trusts than a single hiking event followed by rapid easing.
SCG’s yield is slightly below its 5-year average of 4.78%, which means the share price decline has not yet pushed the stock to historically cheap levels on an income basis. The improving fundamentals are real; the rate headwind is equally real.
Coles Group’s numbers up close: quality earnings, but at what price?
Coles Group’s FY24 ROE of 32.4% is the standout figure in this comparison. Against the 10% benchmark and SCG’s 9.54%, it signals a business converting shareholder equity into profit at an exceptional rate. Morningstar frames the earnings quality explicitly.
Morningstar (2026): “The quality of these cash flows is high and with cash generation of around 100%, we expect the dividend payout ratio to average over 80%.”
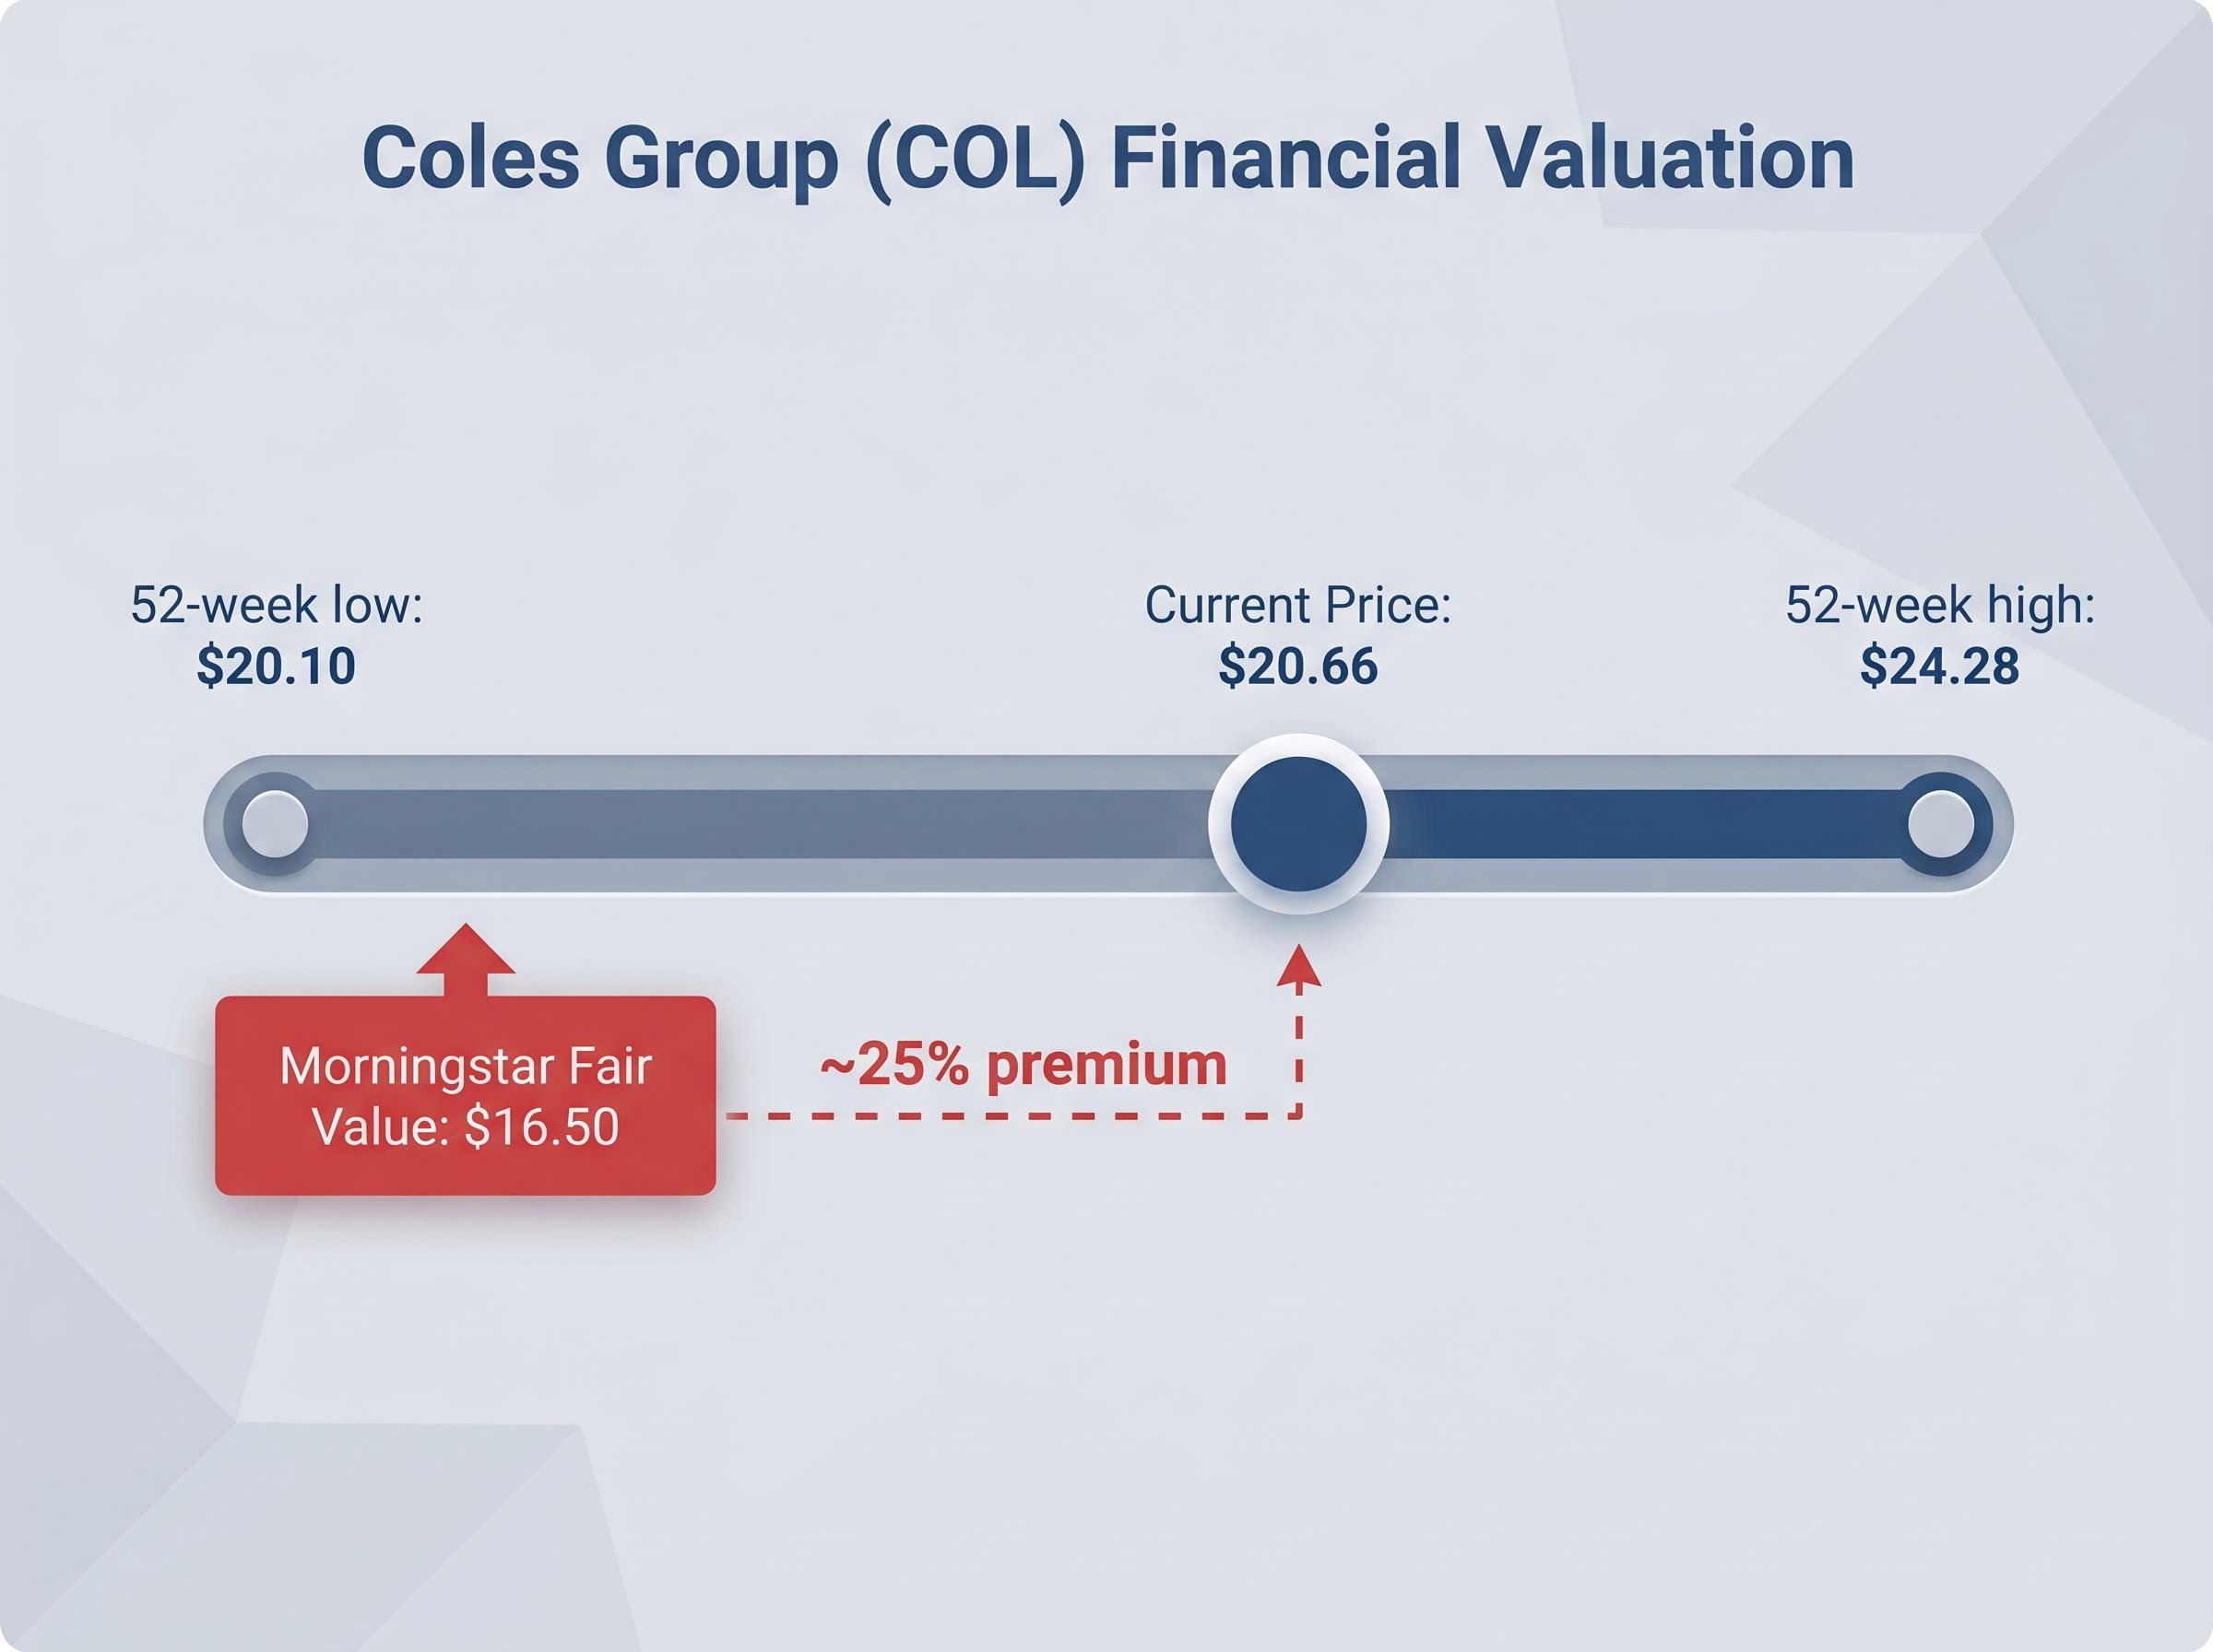
The complication is the price investors pay for that quality. COL’s trailing yield of 3.35% sits below its 5-year average of 3.76% and its since-listing average of approximately 3.8%, indicating the share price remains elevated relative to historical distributions. At a current price of $20.66, COL sits 2.79% above its 52-week low of $20.10 and 14.91% below its 52-week high of $24.28.
| Metric | COL Value | Context |
|---|---|---|
| Trailing Yield | 3.35% | Below 5-year avg of 3.76% |
| Price vs Fair Value | $20.66 | ~25% above Morningstar FV of $16.50 |
| FY24 ROE | 32.4% | Well above 10% benchmark |
| Debt/Equity | 272.26% | Lease-inflated; investment-grade credit |
| Moat Rating | No moat | Morningstar assessment |
The Morningstar fair value estimate of $16.50, paired with a no-moat rating, is the most significant valuation concern. At $20.66, COL trades roughly 25% above one credible measure of intrinsic value. The grocery market share of approximately 28% supports earnings stability, and Morningstar’s earnings estimates remain broadly unchanged despite operational underperformance relative to Woolworths. The quality is genuine. The price being asked for it is another matter entirely.
The COL valuation premium has a specific arithmetic expression beyond the Morningstar fair value gap: at the time of writing, COL’s P/E of approximately 23.7 times represents a 71% premium to the ASX 200 average for a business growing earnings at under 4% per annum, a multiple that assumes defensive quality commands a persistently higher price than historical averages have awarded it.
Side by side: what the divergence actually tells income investors
The two stocks fail and succeed on completely different dimensions.
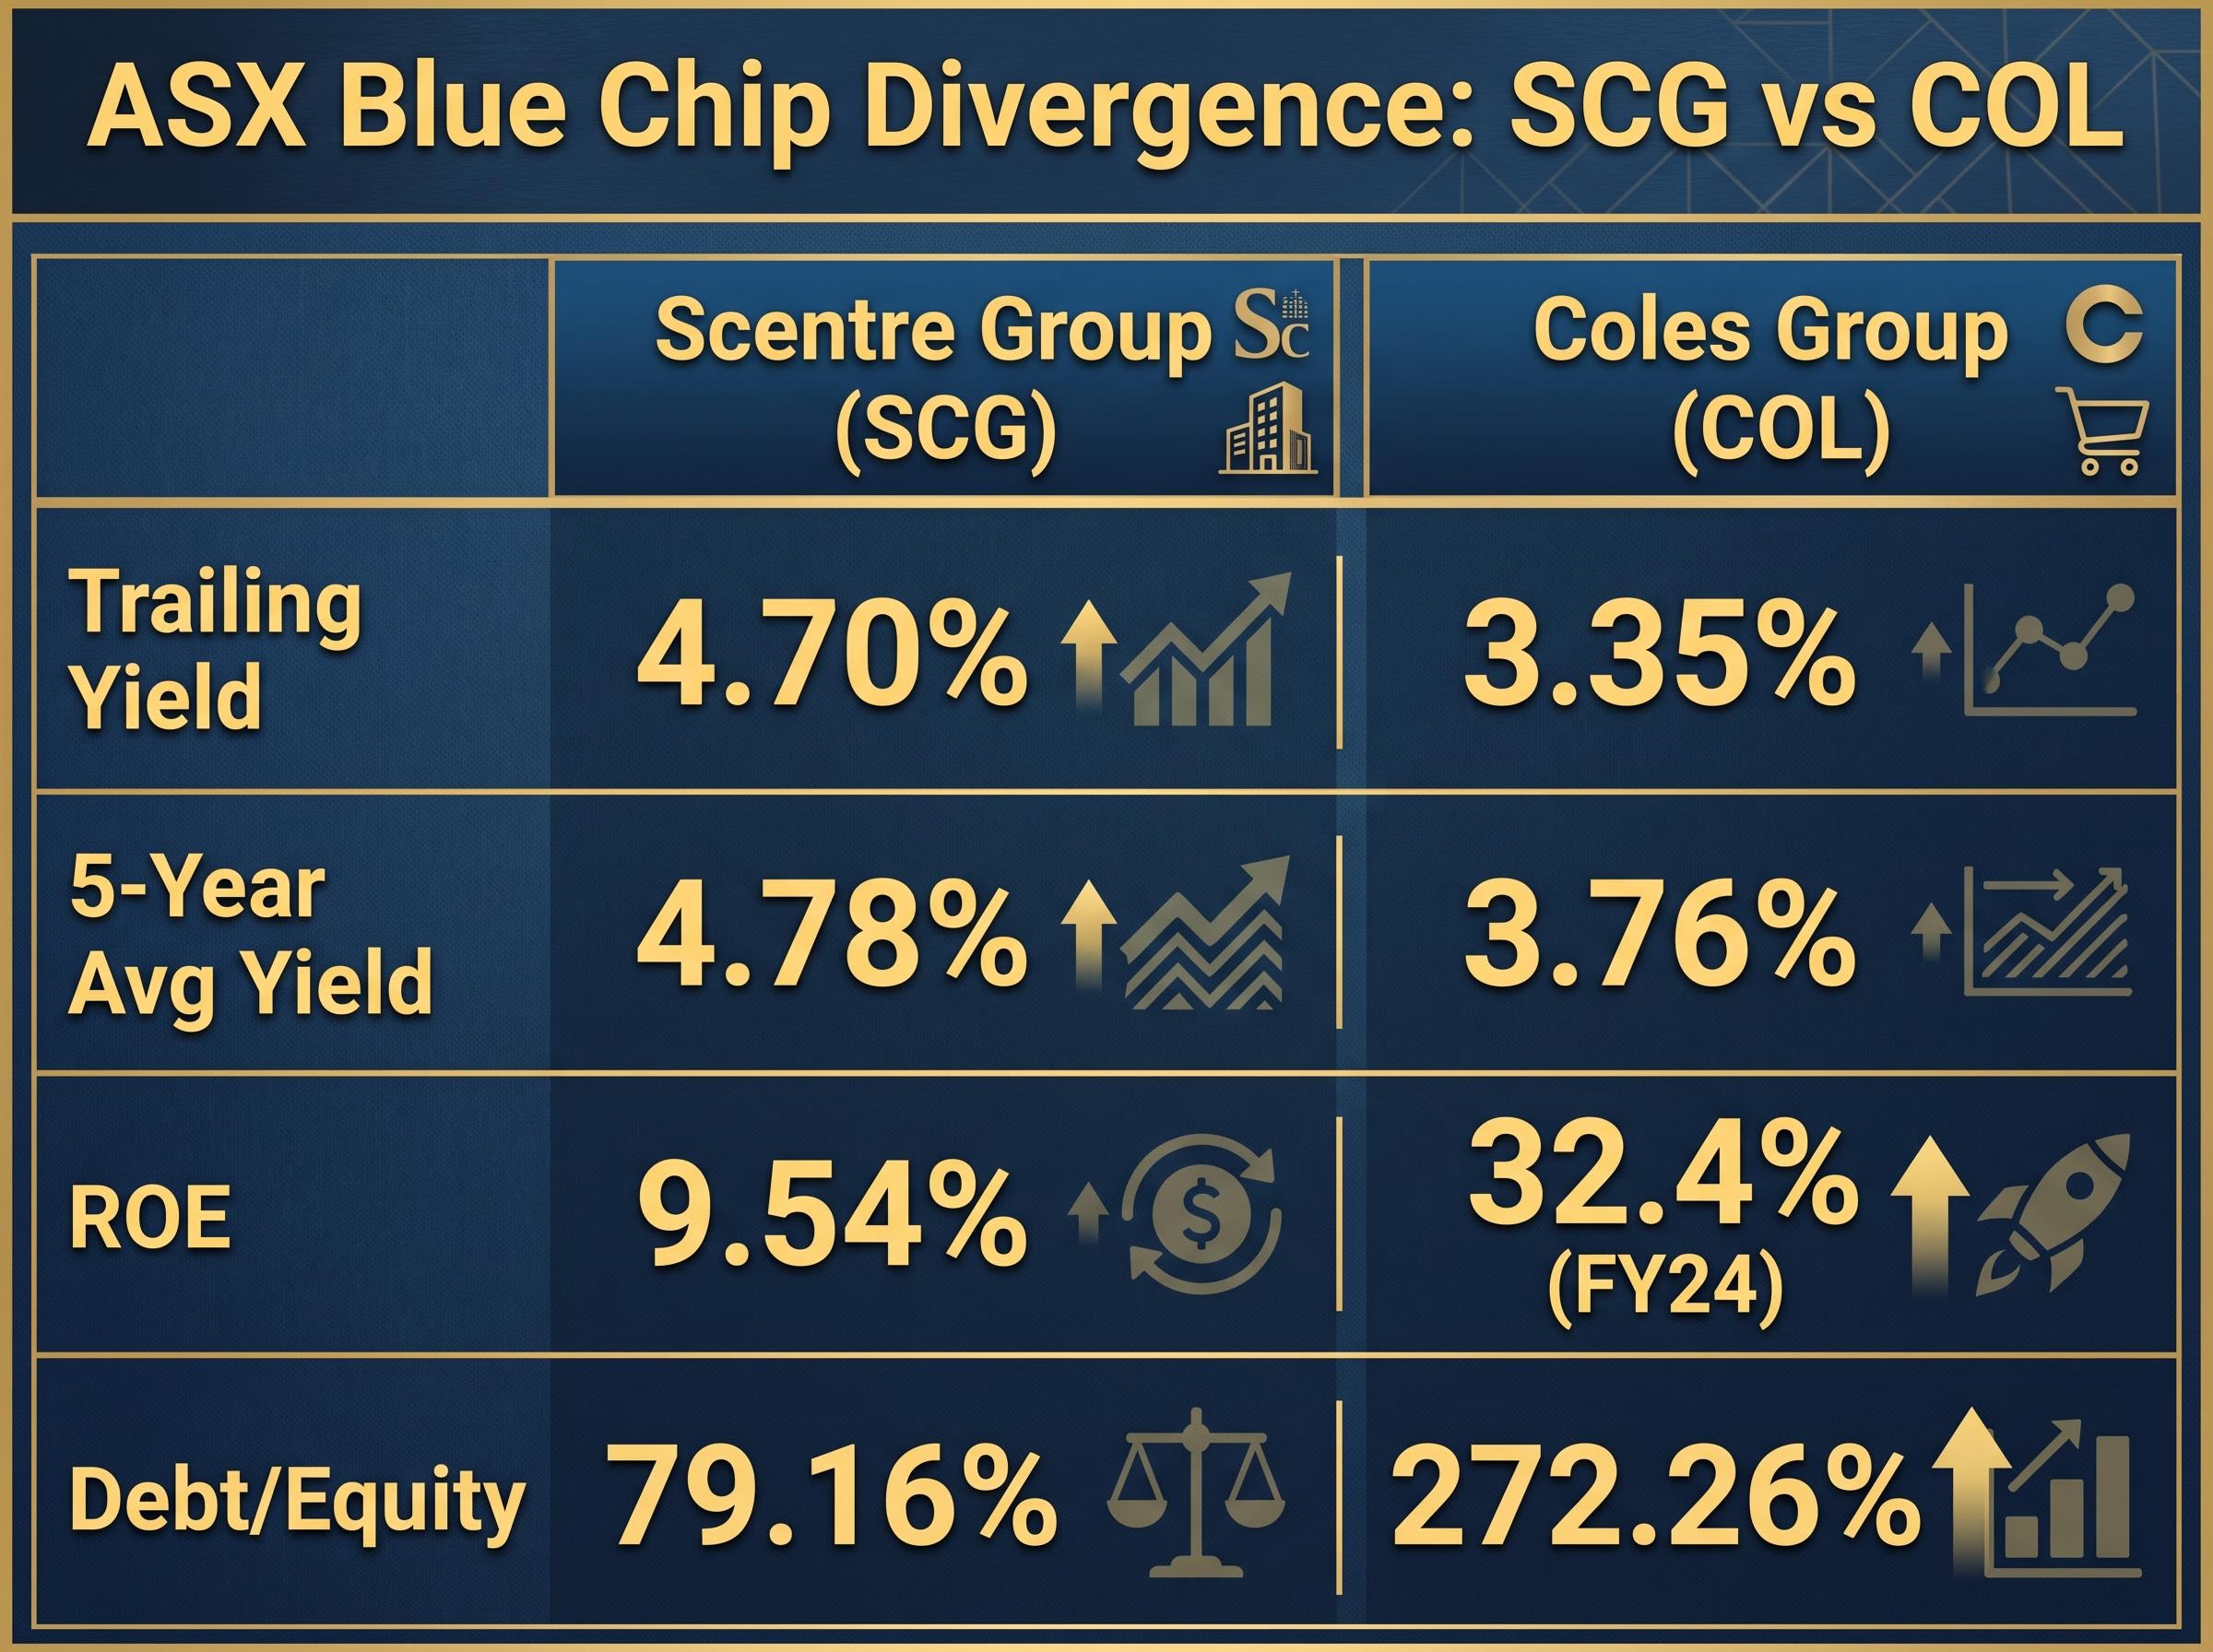
| Metric | SCG | COL | What It Means |
|---|---|---|---|
| Trailing Yield | 4.70% | 3.35% | SCG pays more income today |
| Yield vs 5-Year Avg | Below (4.78%) | Below (3.76%) | Neither is historically cheap on yield |
| ROE | 9.54% | 32.4% (FY24) | COL generates far more per dollar of equity |
| Debt/Equity | 79.16% | 272.26% (lease-inflated) | SCG’s leverage is real rate exposure; COL’s is largely accounting |
| Valuation | Near historical yield avg | ~25% above Morningstar FV | COL carries greater valuation premium risk |
The D/E comparison requires context before any conclusion is drawn. SCG’s 79.16% is conventional REIT leverage with real rate sensitivity; every RBA hike flows through to funding costs. COL’s 272.26% is largely a lease accounting artefact, with investment-grade credit and near-total cash conversion underneath it.
Kalkine (2026) groups Coles among “defensive industrial names” offering “steadier, lower-yielding dividends,” explicitly distinguishing it from higher-yield income plays. That framing is accurate, but steadiness at a 25% premium to assessed fair value is a different proposition from steadiness bought at value.
The investor decision is a risk-type question, not a yield question:
- SCG buyers accept rate-cycle risk and earnings volatility in exchange for a higher running yield and improving (though still below-threshold) ROE. The RBA hiking cycle is an active headwind.
- COL buyers accept valuation risk in exchange for superior earnings quality, defensive earnings stability, and a payout ratio supported by ~100% cash conversion. The premium to Morningstar’s fair value estimate is the active risk.
The divergence is the signal: what comes next for investors holding either stock
What would change the case for SCG
The rate trajectory is the single most important variable. A sustained RBA pause or reversal would ease capitalisation rate pressure, reduce funding costs, and potentially close the gap between SCG’s current yield and its 5-year average, making the valuation case more compelling.
- An RBA rate pause or cut cycle is the primary re-rating catalyst
- Continued distribution growth (confirmed by Rask Media, May 2026) provides an income floor in the interim
- The $240 million Westfield Bondi Junction redevelopment is a medium-term earnings catalyst funded within the existing capital structure
What would change the case for COL
Valuation re-rating is the primary risk. At $20.66 against a $16.50 Morningstar fair value estimate, COL needs either earnings upgrades or continued market appetite for defensive quality to sustain its current price.
- An earnings miss, margin compression, or rotation away from defensive names could trigger a valuation re-rating toward fair value
- Operational underperformance relative to Woolworths is an incremental negative, though earnings estimates remain broadly stable
- Dividend stability is the protection mechanism: even if the capital price compresses, Morningstar’s payout ratio and cash conversion analysis supports continued distributions above 80% of earnings
Civil penalty exposure from the Federal Court’s misleading promotion finding adds a further layer of uncertainty to the COL investment case: while the ruling cleared all 245 price increases as commercially justifiable, the unresolved penalty quantum and the possibility of an appeal or negotiated outcome with the ACCC remain open variables as of 14 May 2026.
Both stocks can be held by income-focused investors, but position sizing and entry point logic differ materially. The risk types are different; the portfolio treatment should reflect that.
Blue chips are not interchangeable, and May 2026 is proving it
SCG and COL carry the same label but represent fundamentally different investment propositions. One offers a higher running yield backed by improving but below-threshold ROE, with direct exposure to the RBA’s hiking cycle. The other offers superior earnings quality and defensive stability, priced at a significant premium to one credible fair value assessment.
Yield is the starting question for income investors, not the ending answer. ROE, yield relative to historical averages, and leverage in proper context are the filters that separate a genuine income opportunity from a comfortable-sounding risk. As the RBA hiking cycle continues and valuation premiums face scrutiny, the divergence between these two stocks is likely to widen, not narrow.
Investors who understand why the numbers differ are better placed than those who compare the two on yield alone.
This article is for informational purposes only and should not be considered financial advice. Investors should conduct their own research and consult with financial professionals before making investment decisions. Past performance does not guarantee future results.