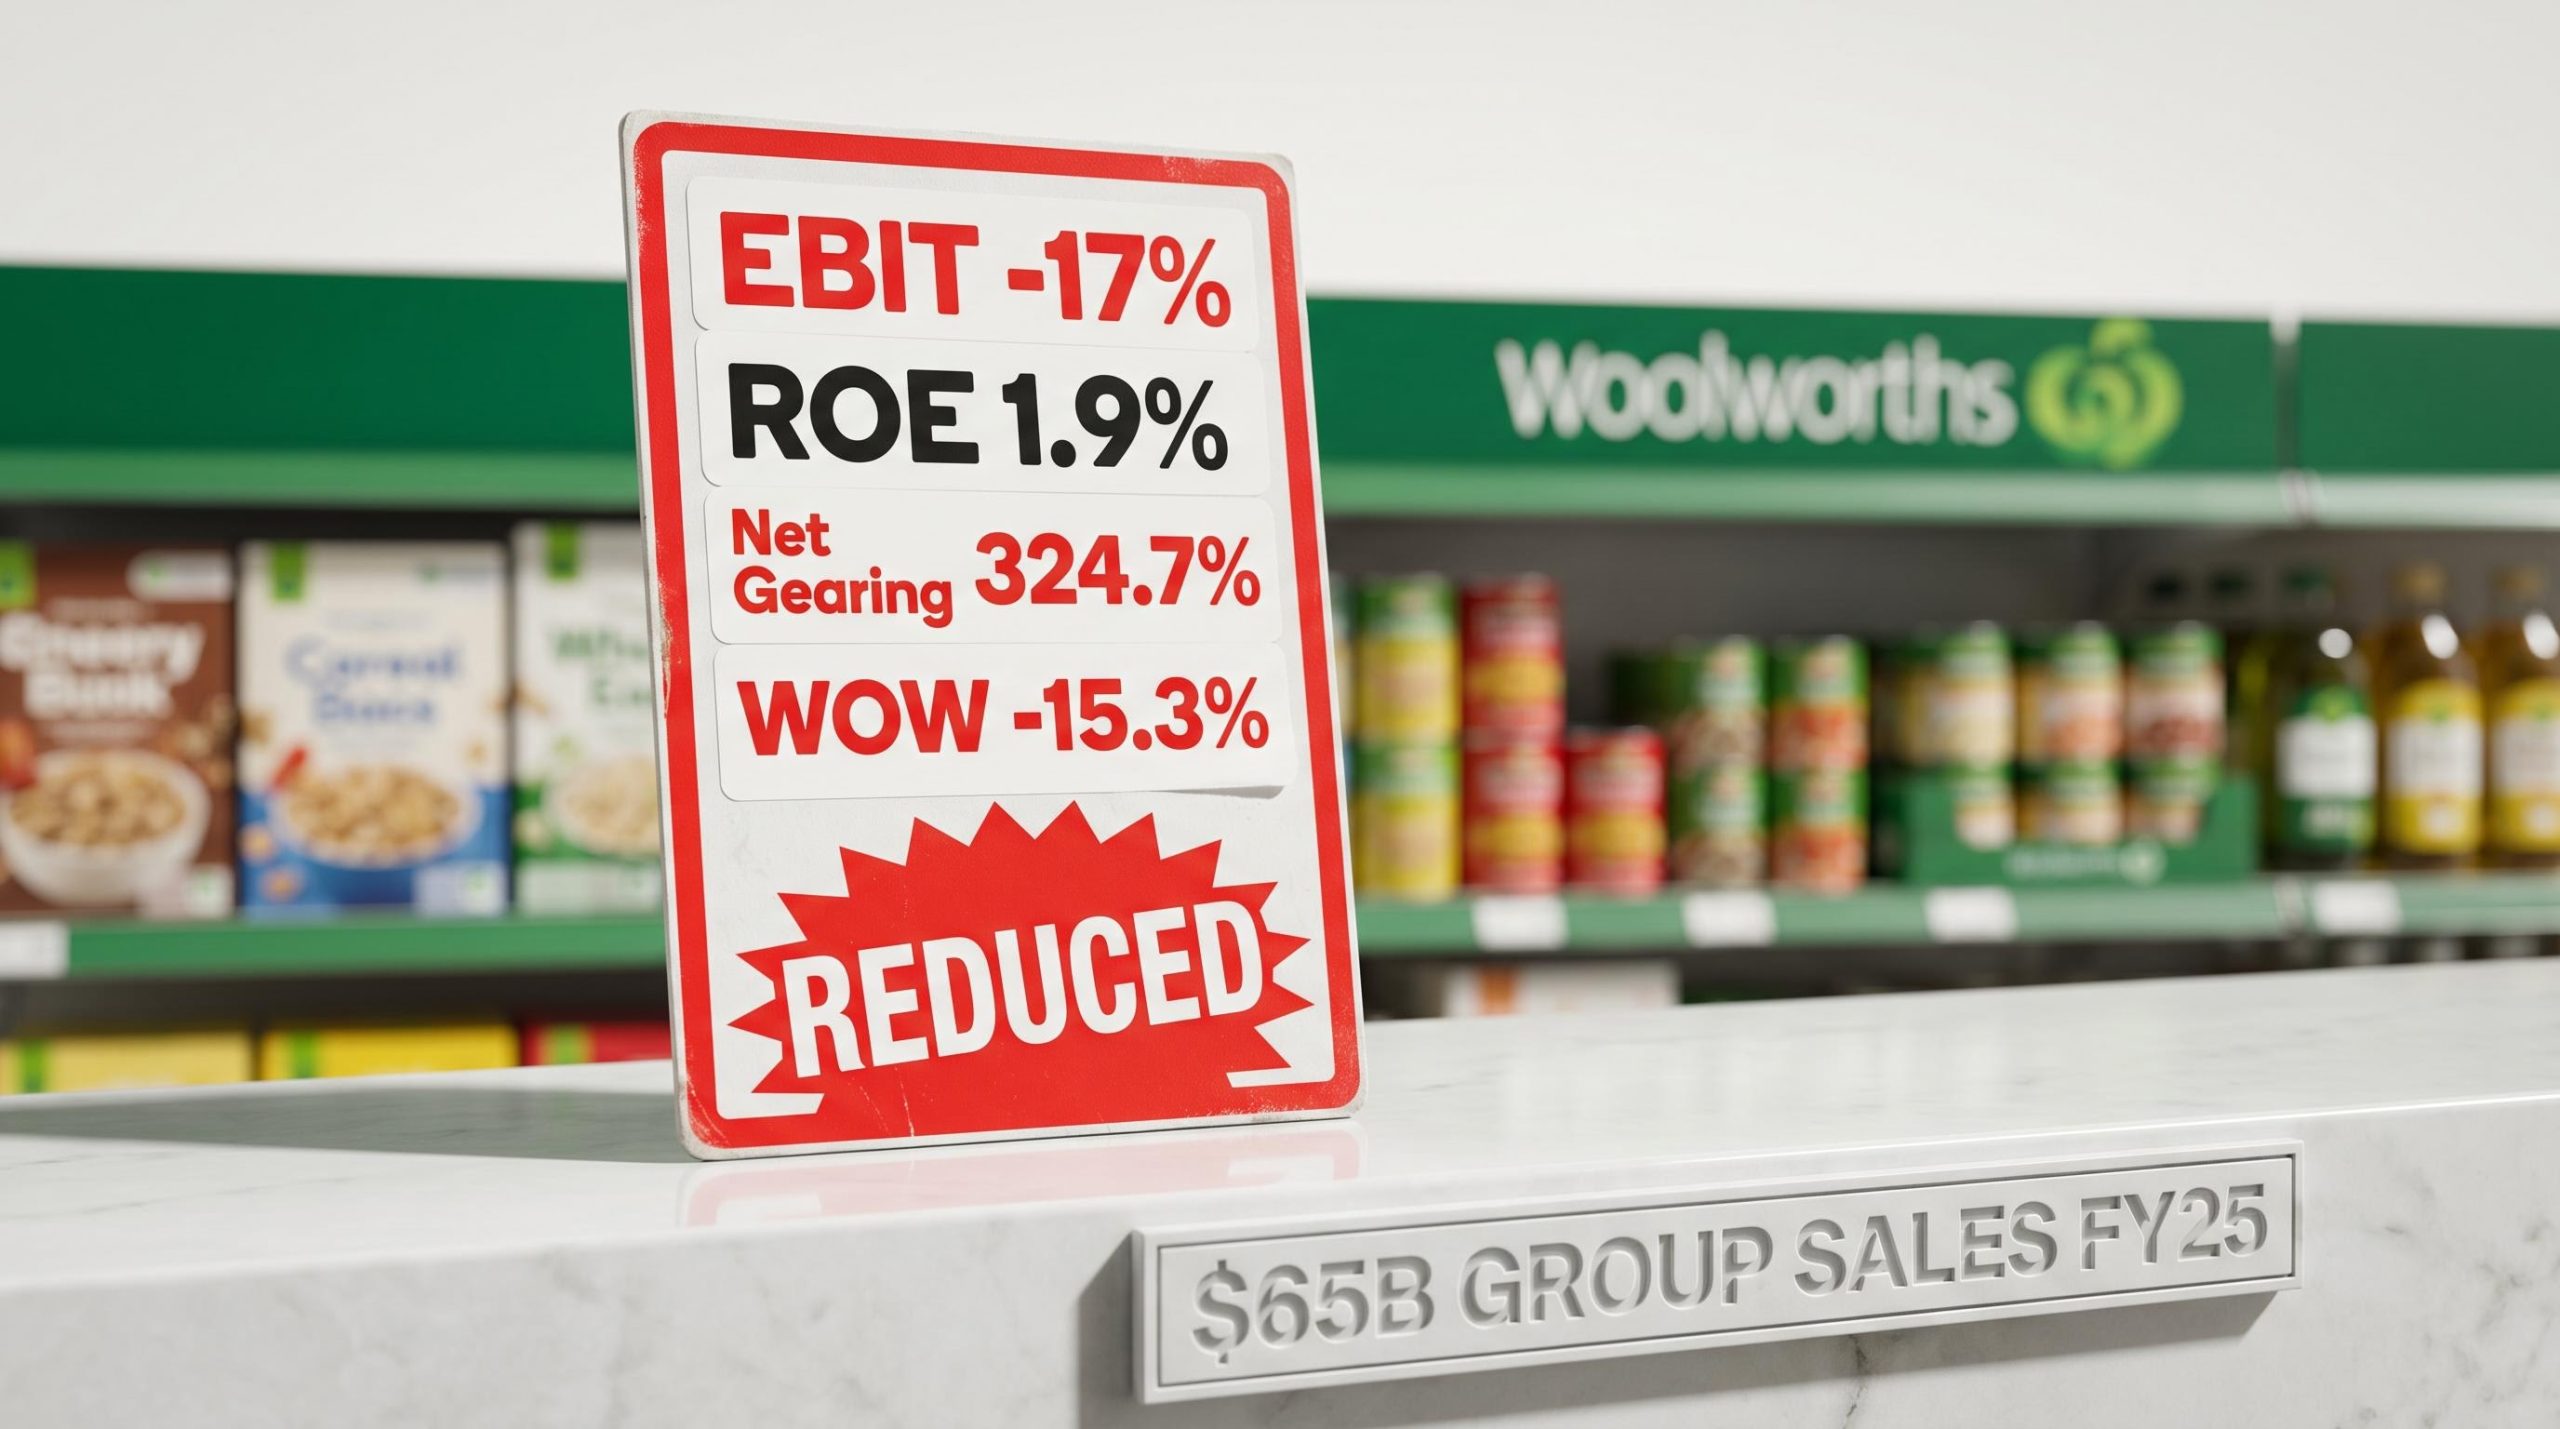
Woolworths shares have paid a fully franked dividend every year since 2020. The company controls roughly a third of the Australian grocery market and reported group sales just under $65 billion in FY25. By most definitions, it remains a blue-chip defensive holding. Yet its FY24 return on equity was just 1.9%, its debt-to-equity ratio exceeds 300%, and its FY25 EBIT fell from $3,330 million to approximately $2,754 million. With WOW trading roughly 15.3% below its 52-week high as of May 2026, income-focused investors face a pointed question: does the stock still earn its premium, or is the dividend story masking a deteriorating financial position? What follows is a section-by-section assessment of the earnings, leverage, capital efficiency, and regulatory dynamics that determine the answer.
What the FY25 numbers actually show about Woolworths’ earnings quality
The top line held up. Woolworths delivered group sales just under $65 billion for FY25, with Australian Food generating low-single-digit growth driven primarily by price and mix. EBITDA came in at $5,707 million. On the surface, the franchise looks intact.
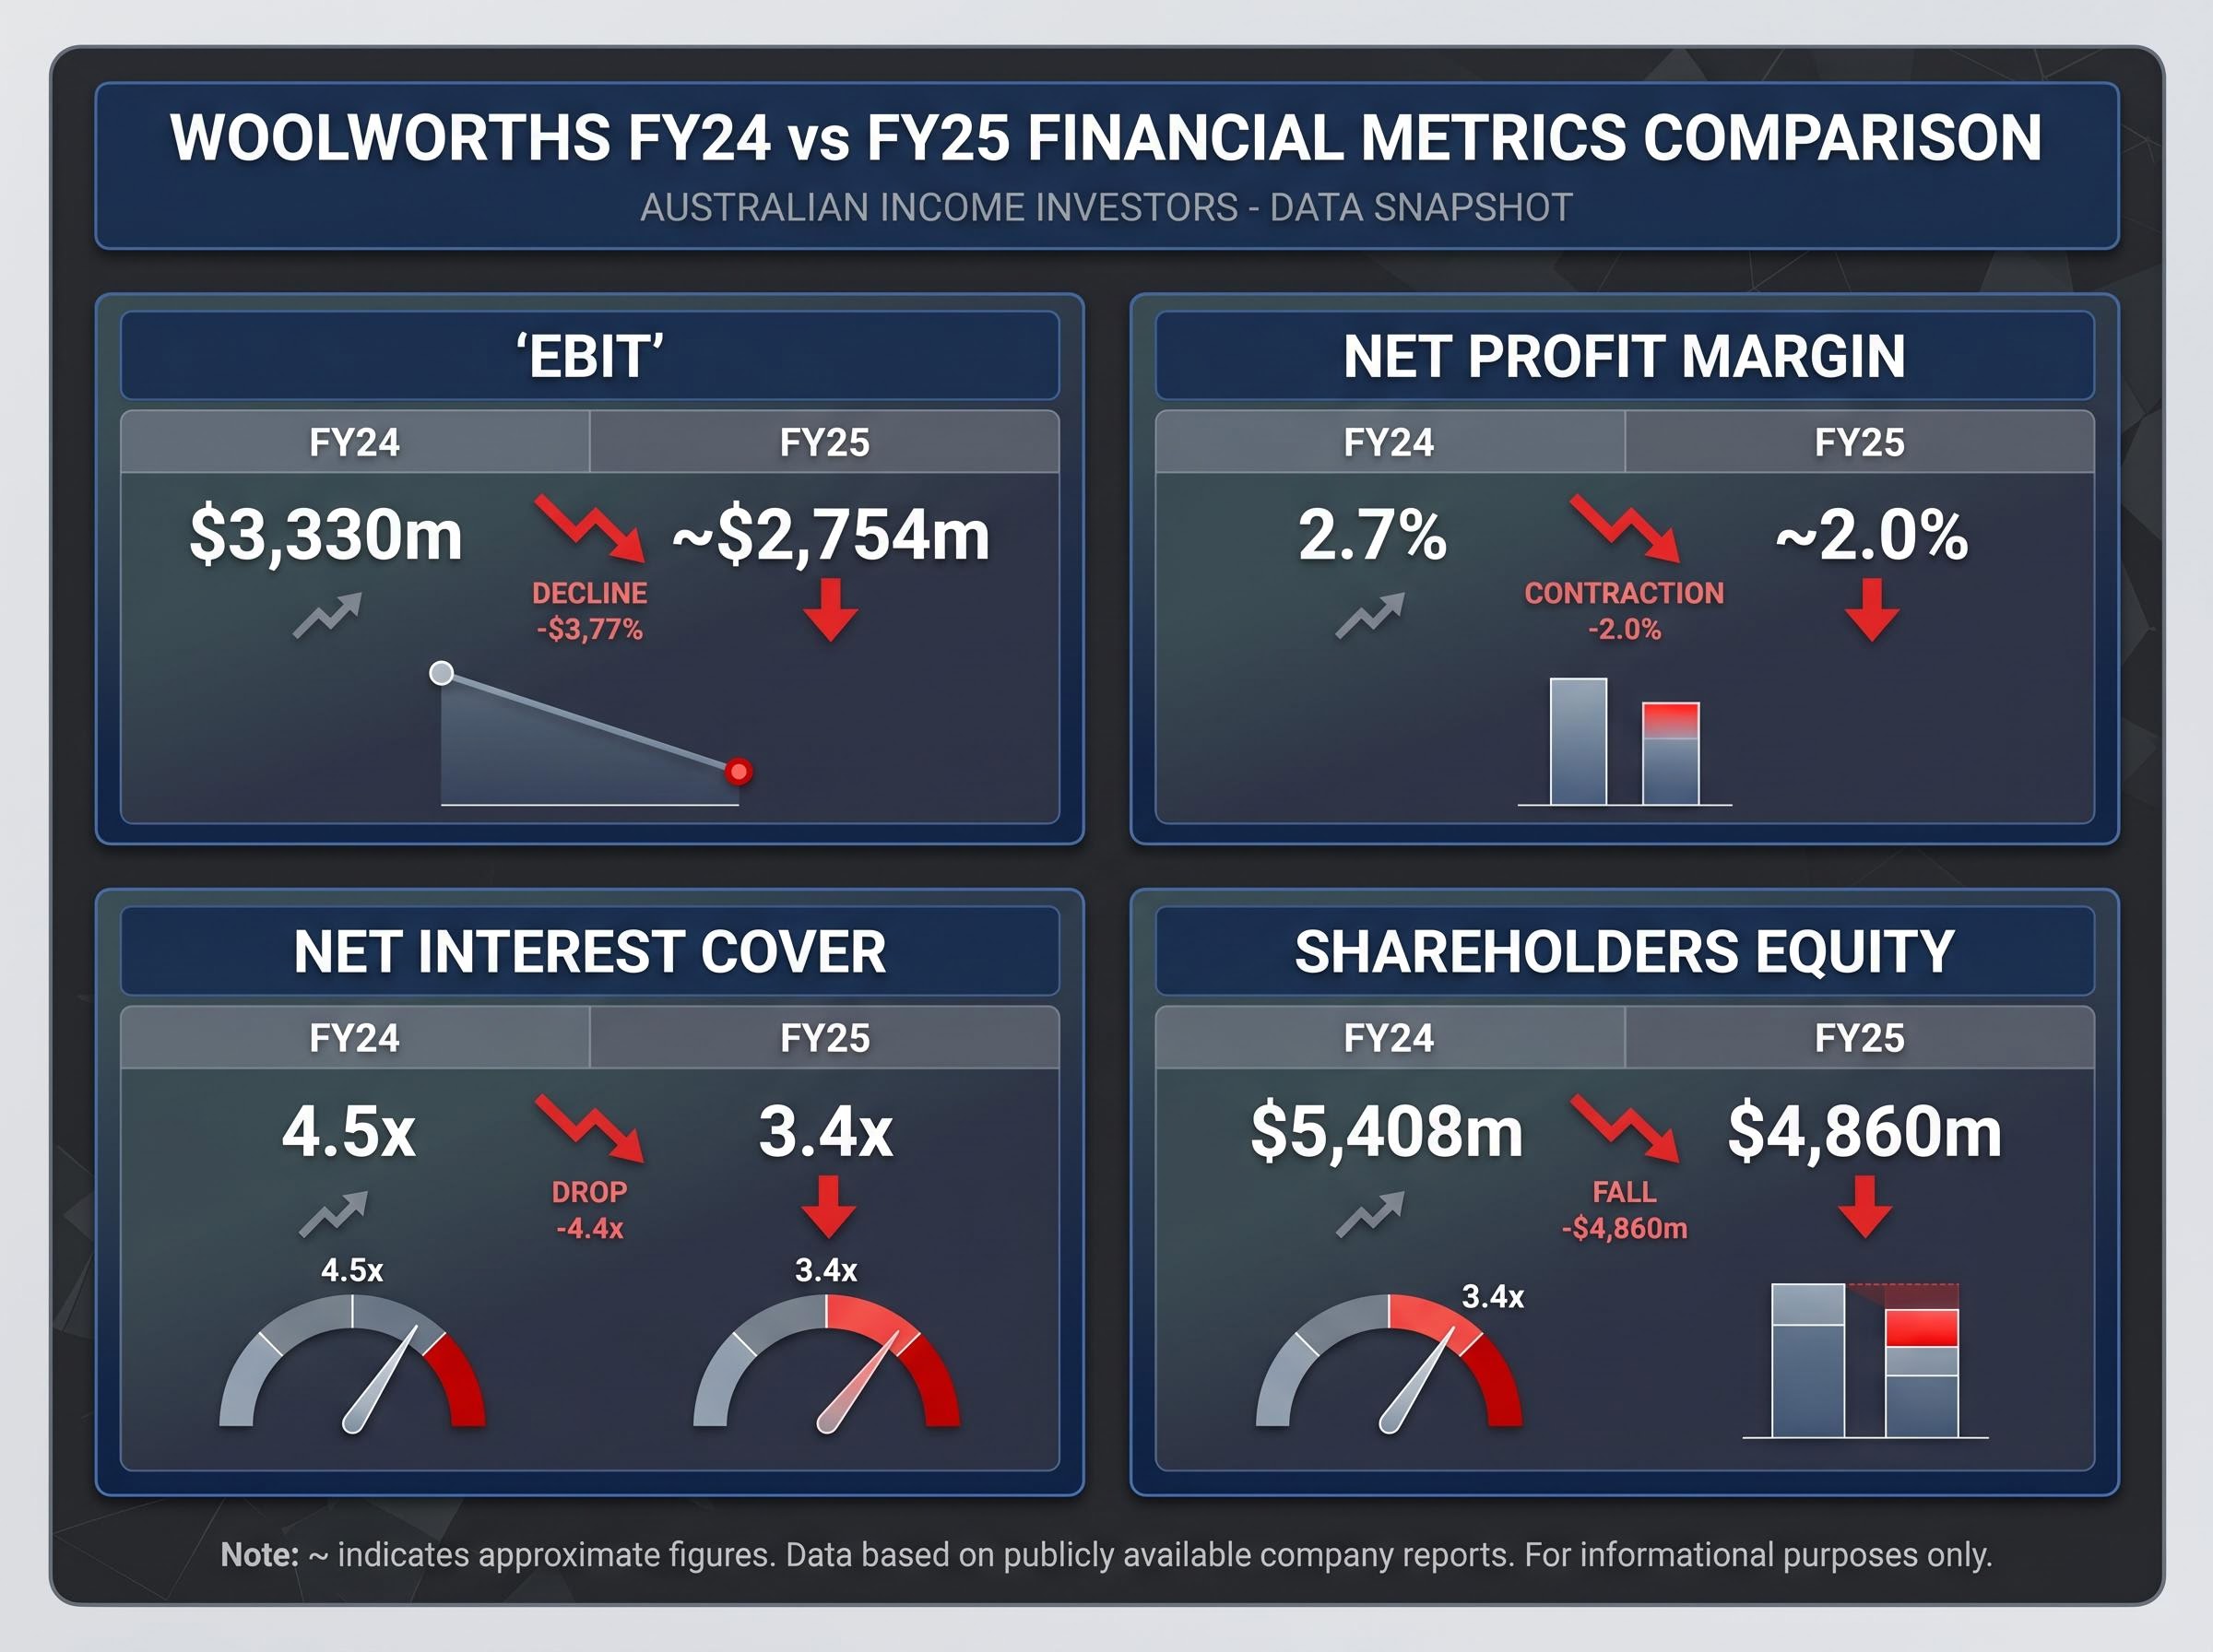
The earnings beneath that revenue tell a different story. EBIT fell from $3,330 million in FY24 to approximately $2,754 million in FY25, a decline of roughly 17%. Reported net profit after tax landed in the range of $1.1-1.2 billion, and the net profit margin compressed from 2.7% to approximately 2.0%.
| Metric | FY24 | FY25 |
|---|---|---|
| EBIT | $3,330m | ~$2,754m |
| Net Profit Margin | 2.7% | ~2.0% |
| Reported NPAT | Higher base | ~$1.1-1.2bn |
| Payout Ratio | ~97% | ~74% |
A payout ratio of approximately 74% on a 2.0% net margin leaves limited headroom to grow distributions without a genuine earnings recovery. That recovery depends on cost pressures easing, and the evidence so far is not encouraging.
The FY24 payout ratio of approximately 97% is one of the clearest dividend trap warning signs flagged in income investing frameworks: when a company distributes nearly all of its earnings, any adverse movement in the underlying business translates almost immediately into a distribution cut or a balance sheet-funded payout that is mathematically unsustainable beyond one or two reporting cycles.
Where the margin went
Wage inflation, energy costs, logistics expenses, and rising shrink (theft and wastage) combined to squeeze operating margins from both directions simultaneously. Australian Food volumes were already under pressure from cost-of-living-driven trading down and intensifying competition from Aldi and private-label alternatives. The business absorbed higher input costs while losing pricing power at the shelf.
These are not one-off charges. Wage and energy inflation in particular represent structural cost headwinds that persist across reporting periods.
When big ASX news breaks, our subscribers know first
Decoding Woolworths’ debt load for dividend investors
Woolworths’ leverage figures vary dramatically depending on who is reporting them and what they include. Simply Wall St cites a debt-to-equity ratio of 119.5% using a narrower definition of debt ($5.69 billion against $4.76 billion in equity). GuruFocus, using a broader measure that captures lease liabilities and other obligations, puts the figure at approximately 3.44x, or 344%.
Both figures are legitimate. The difference is methodological: Woolworths operates more than 3,000 stores across Australia and New Zealand, and the lease obligations on those locations inflate the broader measure substantially.
One complication for retail investors comparing Woolworths against sector peers is that ASX balance sheet analysis for large retailers requires adjusting for AASB 16 lease liabilities, which inflate the debt figure substantially relative to the equity base and make raw debt-to-equity comparisons across sectors misleading without that context.
The FY25 balance sheet snapshot reveals why the direction of travel matters more than the definitional debate. Total debt stood at $17,385 million (short-term $1,943 million, long-term $15,442 million). Cash was $1,275 million. Shareholders’ equity fell from $5,408 million in FY24 to $4,860 million in FY25, meaning the denominator in the D/E calculation is shrinking while the numerator grows.
Net gearing FY25: 324.7%. Net interest cover has fallen from 4.5x in FY24 to 3.4x in FY25. Simply Wall St separately flags interest coverage of just 2.4x as weak.
For income investors evaluating WOW, three balance sheet datapoints deserve the most attention:
- Net gearing of 324.7%, elevated on a book-equity basis and drifting higher year on year
- Interest coverage declining from 4.5x to 3.4x, with no announced deleveraging programme to reverse the trend
- Shareholders’ equity contracting, driven by dividends, capital returns, and negative reserve movements
Long-term debt rose from $14,411 million to $15,442 million across the year. No major asset sale, equity raising, or sweeping debt reduction initiative has been announced. Leverage competes directly with distributions for free cash flow, and that competition is intensifying.
Capital Efficiency Challenges: Analysing Woolworths’ ROE
A return on equity of 10% is the standard benchmark for a mature blue-chip business: a threshold that indicates management is generating returns above the cost of equity, meaning shareholders are being compensated for the capital they have entrusted. Woolworths delivered an ROE of just 1.9% in FY24.
The FY25 figure looks dramatically different at approximately 28.5%, according to GuruFocus and Intelligent Investor. That improvement, however, is largely an accounting artefact. With book equity thin relative to total debt and intangibles, the denominator in the ROE calculation is compressed, inflating the output. A business does not become five times more capital-efficient in a single year while its EBIT falls 17%.
Neither figure tells a straightforwardly positive story. An ROE of 1.9% signals that a consumer staples business with dominant market share is failing to convert scale into superior capital returns. An ROE of 28.5% signals dangerously thin equity as much as operational improvement.
| Company / Benchmark | ROE | Context |
|---|---|---|
| Woolworths FY24 | 1.9% | Below cost of equity; poor capital productivity |
| Woolworths FY25 | ~28.5% | Elevated by thin book equity, not operational strength |
| Cochlear (COH) FY24 | 19.9% | ASX blue-chip peer comparison |
| Blue-chip benchmark | 10% | Minimum threshold for mature quality businesses |
An ROE persistently below 10% at a consumer staples business with more than 60% combined market share (with Coles) is not a temporary aberration. It signals that scale advantages are not translating into the returns shareholders could earn elsewhere.
How to read a consumer staples balance sheet
Debt-to-equity ratios in large retail businesses behave differently from those in mining or technology. A technology company with a 300% D/E ratio may be overleveraged on bond debt. A supermarket chain carrying a similar figure is likely reflecting lease liabilities on thousands of store locations, obligations that inflate the balance sheet without representing the same insolvency risk as traditional borrowings.
That distinction matters, but it does not make the debt irrelevant. Lease obligations still consume cash flow. They still require servicing. They still compress the equity base.
Return on equity, explained simply, measures how much profit a business generates for each dollar of shareholder equity. The 10% benchmark exists because it approximates the cost of equity for a large Australian business: the return shareholders could expect from an alternative investment of comparable risk. A company consistently earning below that threshold is, in effect, destroying value relative to what the market demands.
For income investors assessing any large-cap defensive stock, three factors form the core checklist:
- Dividend yield and sustainability: Is the yield supported by recurring cash flows, or is it being funded by balance sheet deterioration?
- Payout ratio headroom: Is the company distributing a manageable share of earnings, or is it stretching to maintain the dividend?
- Interest coverage trend: Is the business comfortably servicing its debt, or is the margin of safety narrowing?
Applying the checklist to Woolworths
Applied to WOW’s current figures, the checklist produces a mixed verdict. The forward yield of approximately 3.0-3.5% fully franked (based on FY26 consensus) is supported by the company’s stated policy of distributing 70-80% of underlying earnings per share. The FY25 payout ratio of approximately 74% sits comfortably within that band, a meaningful normalisation from the FY24 figure of approximately 97%, which flagged stress.
Interest coverage, however, is the area of concern. The decline from 4.5x to 3.4x in a single year, with no announced deleveraging programme, means the safety margin on debt servicing is narrowing while earnings are compressing.
Regulatory pressure and the earnings ceiling investors are not fully pricing in
The ACCC supermarket pricing inquiry, launched in late 2024, placed Woolworths and Coles under sustained political and regulatory scrutiny through 2025 and into 2026. Parliamentary hearings questioned executives on the gap between farmgate and shelf prices, supplier treatment, and alleged shrinkflation. Media coverage across the AFR, The Australian, and ABC has been politically charged, creating reputational pressure that extends beyond any single regulatory outcome.
The ACCC supermarkets inquiry final report, published in March 2025, identified specific concerns about pricing transparency, supplier treatment, and the gap between farmgate and shelf prices, providing the regulatory basis for the compliance and conduct obligations now hanging over both Woolworths and Coles.
Three specific regulatory outcomes could directly compress earnings:
The Coles pricing conduct ruling handed down in May 2026 illustrates how the regulatory risk materialises in practice: the Federal Court found Coles’ price increases commercially justifiable but identified misleading promotional timing, leaving civil penalty exposure active and signalling that ACCC enforcement against the supermarket duopoly is neither symbolic nor resolved.
- Tougher Food and Grocery Code of Conduct enforcement, raising compliance obligations and penalties
- Pricing transparency requirements, limiting the flexibility to manage promotional margins
- Supplier terms scrutiny, potentially constraining sourcing cost advantages that underpin operating margin
Margin recovery is the primary path to dividend-per-share growth. If regulatory constraints cap how much margin Woolworths can realistically recover, even if wage and energy headwinds ease, the earnings ceiling is lower than the share price discount alone would suggest.
Analyst consensus as of early 2026: approximately 50-60% Hold, 25-35% Buy, 10-15% Sell. Multiple brokers, including Macquarie, UBS, Morgan Stanley, and Citi, downgraded WOW in late 2024 and early 2025.
The shift from a default blue-chip Buy to a consensus Hold reflects this repricing of the earnings quality premium. With the stock approximately 15.3% below its 52-week high, the consensus 12-month price target implies only 8-15% capital appreciation before the regulatory environment is resolved. A forward yield of approximately 3-3.5% may not be sufficient compensation for investors underestimating the margin ceiling risk.
Woolworths as an income stock: reliable, but not the whole story
The case for WOW as a defensive income holding rests on real attributes. The fully franked yield, the dominant market position, and a resilient top line through economic cycles are genuine competitive advantages that most ASX-listed businesses cannot match.
The case against passive accumulation at current prices is equally specific. The FY26 consensus P/E sits in the low-to-mid 20s on a business delivering low-single-digit EPS growth. Paying that multiple requires confidence in margin recovery, and that confidence is not yet supported by the trajectory of the financials.
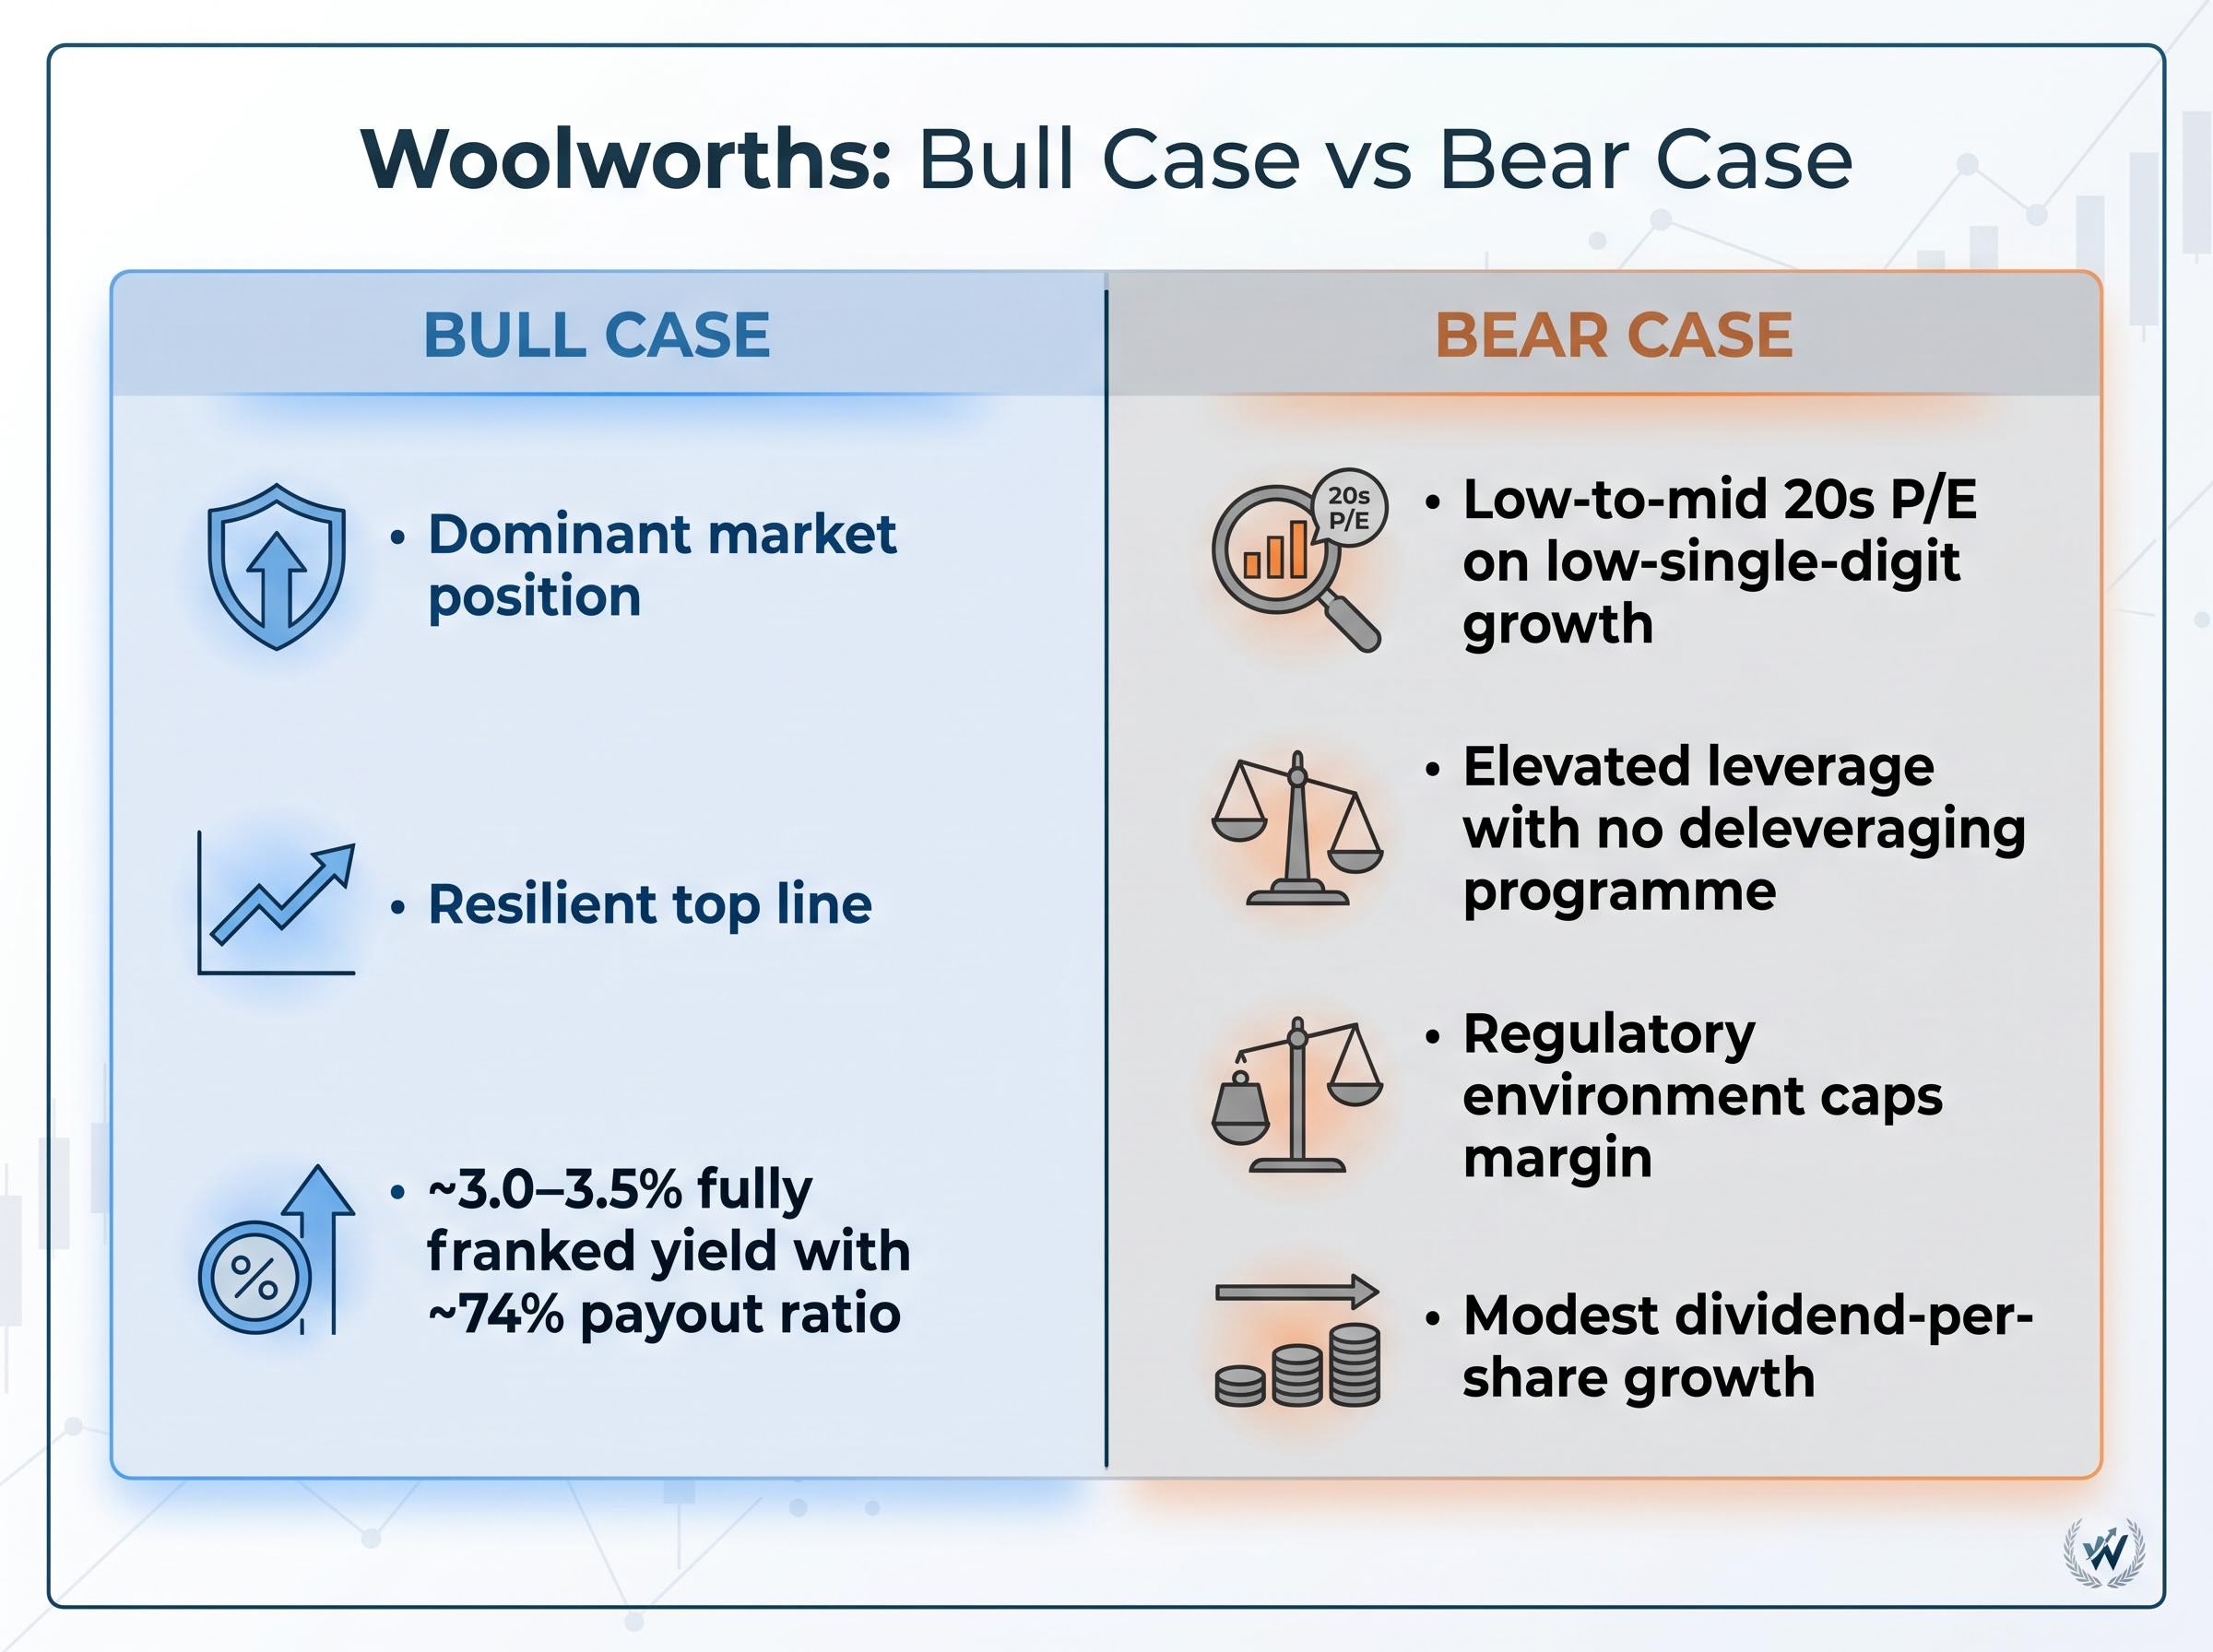
The bull case:
- Defensive, cash-generative franchise with dominant market position
- Resilient top line through economic downturns
- Approximately 3.0-3.5% fully franked yield with a manageable 74% payout ratio
The bear case:
- Expensive for its growth profile (low-to-mid 20s P/E on low-single-digit growth)
- Elevated and rising leverage with no deleveraging programme
- Regulatory environment that caps margin recovery potential
- Modest dividend-per-share growth outlook at best
Free cash flow yield sits in the low single digits, confirming investors are paying a quality premium for stability rather than value.
How Woolworths compares to Coles for income investors
Coles trades at a slight discount to Woolworths on a P/E basis, offers a comparable fully franked yield, and faces similar cost and regulatory pressures. Some brokers now view Coles as the more attractive defensive income option, given WOW’s historical valuation premium has compressed without a corresponding improvement in its relative earnings outlook. This is not a recommendation; it is a comparative framing that income investors should evaluate when assessing relative value within the sector.
The contrast with the Coles earnings trajectory in 1H FY26, which showed 14.6% supermarkets EBIT growth and a 10.8% dividend increase, sharpens the sector comparison: Coles delivered margin expansion through automation and strategic sourcing in the same cost environment that compressed Woolworths’ EBIT by roughly 17%, a divergence that brokers citing Coles as the more attractive defensive income option have used to justify the relative valuation view.
The bottom line on WOW for income investors in 2026
Woolworths remains a reliable income stock for conservative, long-horizon investors who value the fully franked yield and the defensive characteristics of a dominant supermarket franchise. The dividend is likely sustainable in the near term.
The combination of deteriorating interest coverage, a rising debt-to-equity trajectory, sub-benchmark return on equity, and a regulatory environment that caps margin recovery means the stock does not warrant a passive blue-chip accumulation stance at current prices. The 15.3% discount to the 52-week high reflects the market’s own reckoning with these structural concerns, not a straightforward buying opportunity.
Income investors would benefit from applying the three-factor checklist, yield sustainability, payout headroom, and interest coverage direction, not only to WOW but across their portfolio. The framework that reveals WOW’s limitations is the same framework that identifies genuine income quality elsewhere.
This article is for informational purposes only and should not be considered financial advice. Investors should conduct their own research and consult with financial professionals before making investment decisions. Past performance does not guarantee future results. Financial projections are subject to market conditions and various risk factors.
—