WTI Jumps 1.6% as Iran Strikes Shatter Hormuz Deal Hopes
14 mins ago


The April 2026 Consumer Price Index reading delivered a 3.8% year-on-year increase, the highest US inflation rate since May 2023, and the bond market’s response was immediate: the 30-year Treasury yield pushed toward the 5% threshold within minutes of the release. Both headline and core figures came in above consensus, energy prices surged on a supply shock with no clear resolution date, and the labour market showed no signs of softening that might give the Federal Reserve cover to ease. The timing compounded the pressure. Kevin Warsh, the incoming Fed chair, is days from taking over an institution with no good options. What follows is a breakdown of what drove the April inflation surprise, what it means for Fed policy under Warsh, how Treasury markets are pricing the new reality, and what investors should be watching next.
The April CPI print missed consensus on nearly every line that matters. Headline inflation landed at 3.8% year-on-year against a 3.7% forecast. Core CPI, which strips out food and energy, came in at 2.8% year-on-year versus the 2.6% expected. Monthly readings told the same story: headline CPI rose 0.6% month-on-month, while core climbed 0.4% against a projected 0.3%.
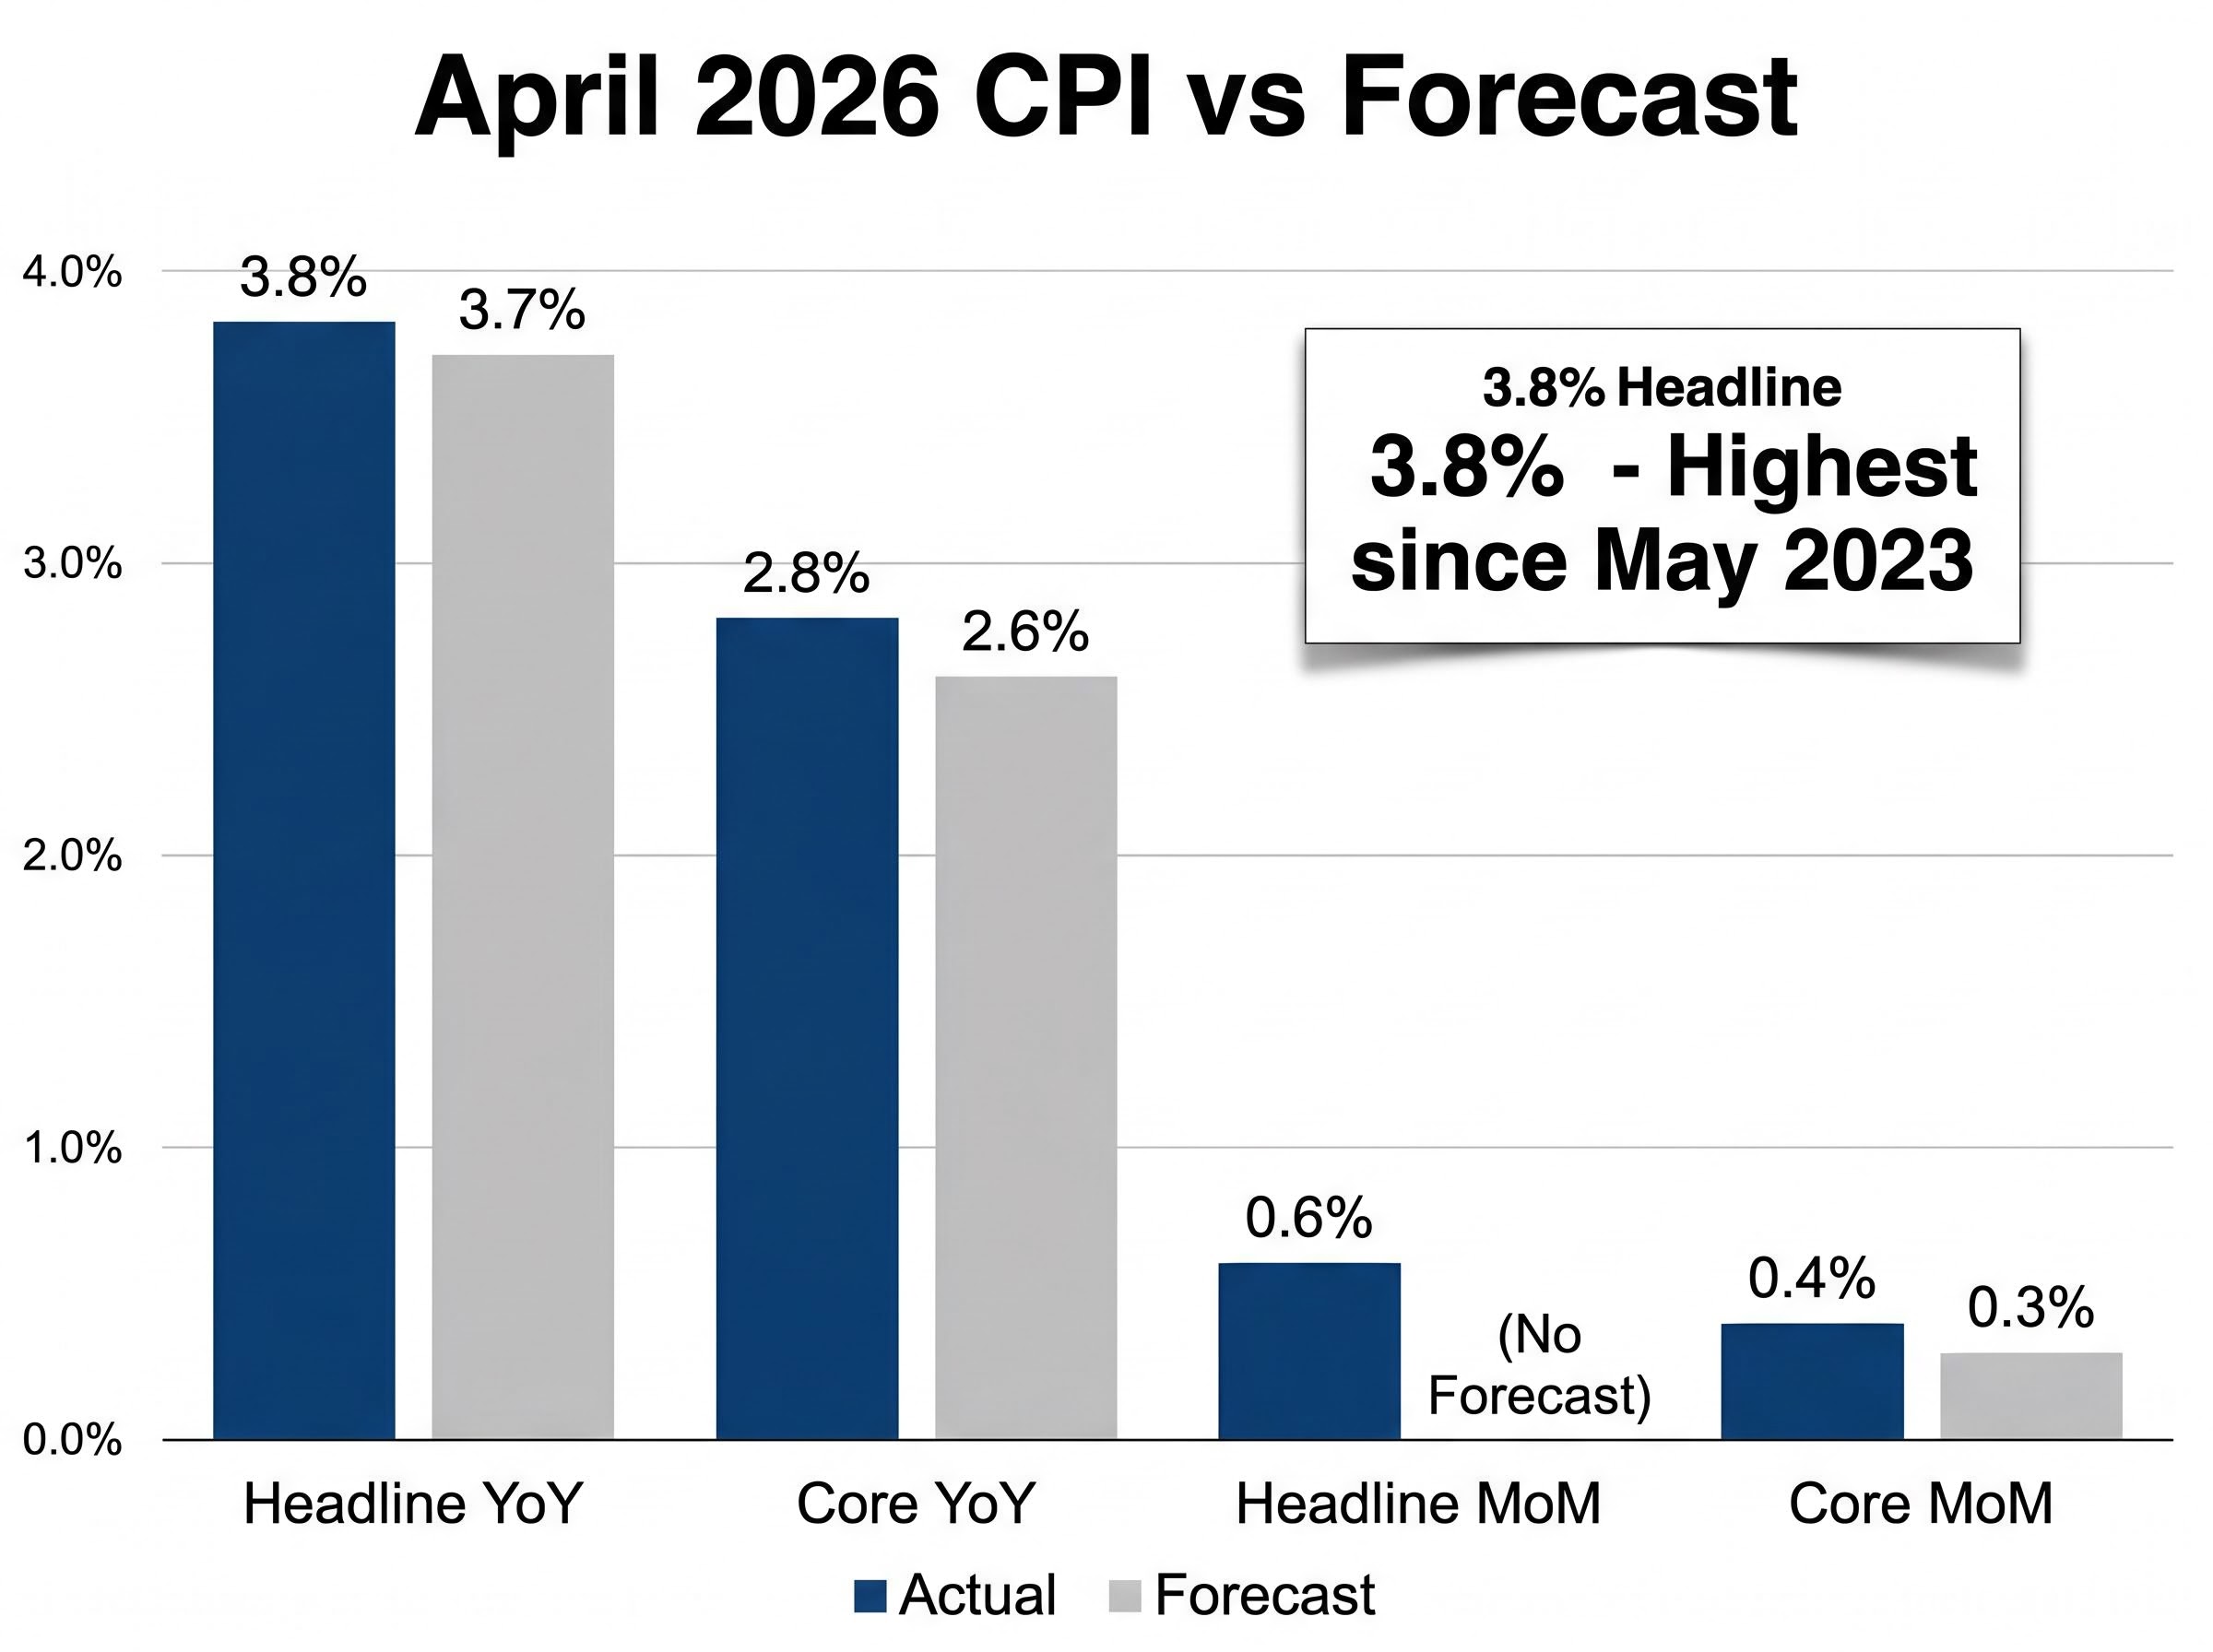
The 3.8% headline reading is the highest since May 2023, marking a clear reversal of the disinflation trend that had defined 2024 and 2025.
The monthly pace did decelerate from March’s 0.9%, but the year-on-year acceleration is what markets are pricing. Airline fares, up 20.7% year-on-year, illustrated how cost pressures are passing through into services well beyond the energy complex.
The breadth of the miss is what matters most. When both headline and core surprise to the upside simultaneously, the Fed loses the ability to attribute the overshoot to one or two volatile components.
| Measure | Actual vs. Forecast |
|---|---|
| Headline CPI (YoY) | 3.8% vs. 3.7% |
| Core CPI (YoY) | 2.8% vs. 2.7% |
| Headline CPI (MoM) | 0.6% |
| Core CPI (MoM) | 0.4% vs. 0.3% |
Energy prices accounted for more than 40% of the headline monthly increase, and the source is specific: the disruption to oil flows through the Strait of Hormuz linked to Iranian tensions. The supply shock transmitted directly into consumer-facing prices.
The Hormuz disruption sits at the centre of a global inflation rethink that has forced central banks to reassess their easing timelines simultaneously, with disinflationary counter-forces such as Chinese manufacturing exports and potential AI productivity gains now competing against a commodity shock that institutional investors are treating as structurally significant rather than transitory.
Vessel transits through the Strait of Hormuz have fallen to approximately 2-5 ships per day, down from roughly 70 prior to hostilities, a reduction that captures the severity of the disruption in a single comparison.
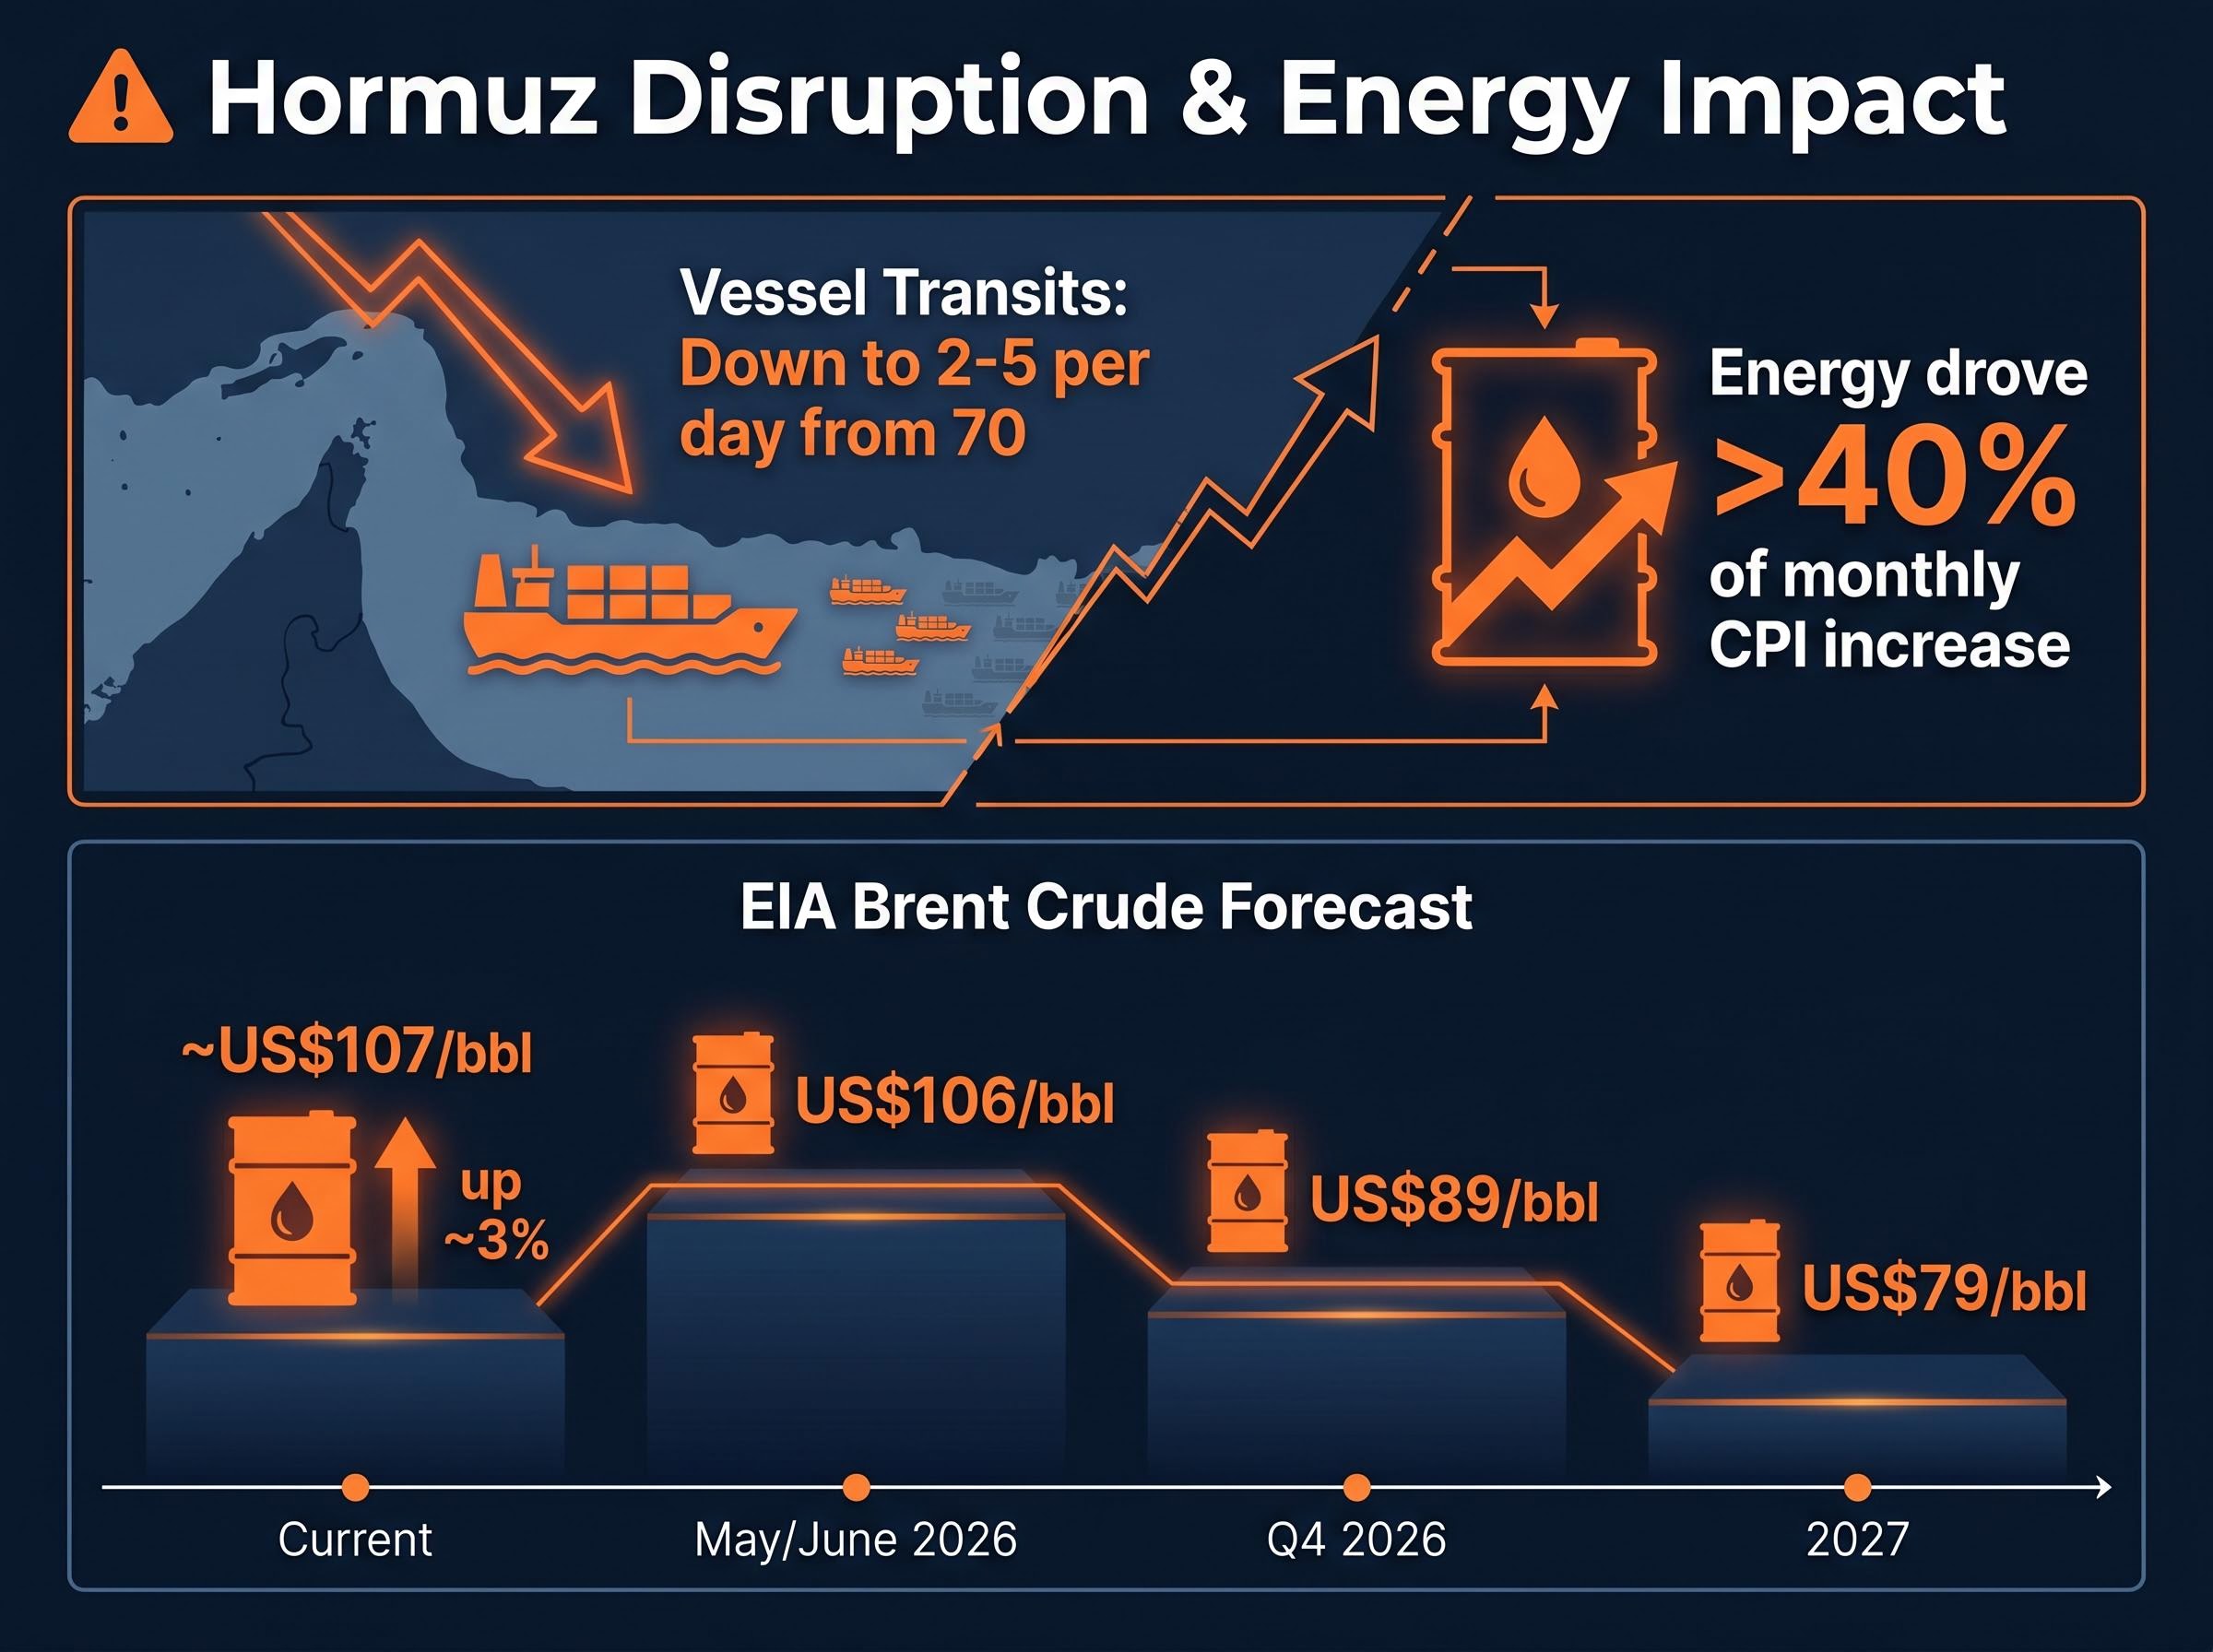
WTI crude stood at US$102.05 per barrel on the day of the release, with Brent crude at approximately US$107 per barrel, up around 3%. The Energy Information Administration (EIA) has forecast Brent averaging US$106 per barrel through May and June 2026, declining to US$89 in Q4 2026 and US$79 in 2027, conditional on the Hormuz route reopening by late May.
Whether the disruption resolves in the coming weeks or extends into summer is arguably the single most consequential variable for the June CPI print. Shelter costs and airline fares in the April data both showed upward pressure, raising the question of whether the energy shock is generating second-round pass-through into broader prices. Minneapolis Fed President Neel Kashkari has emphasised the need to monitor energy shocks and their transmission to broader prices before adjusting policy, a posture that effectively leaves the Fed in observation mode until the next data cycle.
The Federal Reserve operates under a dual mandate: it targets both price stability (keeping inflation near 2%) and maximum employment. April’s data complicated both sides of that equation simultaneously, leaving the institution in a genuine bind.
The Federal Reserve dual mandate framework commits the institution to both price stability at a 2% inflation target and maximum employment, a pairing that leaves policymakers with no clean adjustment lever when both measures are running above or below their preferred thresholds simultaneously.
The labour market gave the Fed no softness to point to as justification for an eventual cut:
The Atlanta Fed’s GDPNow model is tracking Q2 2026 growth at 3.7%. An economy expanding at that pace, with payrolls consistently beating expectations and inflation at 3.8%, does not resemble a conventional rate-cut setup by any historical measure.
Vice Chair Michael Barr has indicated there will be no rate cuts in 2026 due to persistent inflation.
A rate hike remains on the table precisely because the Fed cannot afford to appear as though it is validating above-target inflation. If price expectations become embedded in wage negotiations and corporate pricing, the cost of restoring credibility later rises sharply. Real wages are already under pressure, and a passive posture risks allowing the problem to compound.
The FOMC’s internal fracture predates the April CPI surprise: the 8-4 dissenting vote at the April 29 meeting was the largest split since 1992, with dissenters pulling in opposite directions, and inflation has now run above the 2% target for five consecutive years, raising the risk that elevated price expectations become structurally entrenched regardless of whether the Hormuz route reopens.
The CME FedWatch tool, which uses federal funds futures prices to calculate implied probabilities of Fed rate decisions, registered 0% probability of any rate cut in 2026 within hours of the CPI release. The shift was not gradual. Markets had already reduced cut expectations heading into the print, but the April data eliminated them entirely.
The probability of a rate hike by December 2026 now sits at approximately 30%, not a consensus expectation, but a tail risk large enough to be priced into options and futures markets.
Treasury yields moved accordingly:
| CME FedWatch | Cut Probability | Hold Probability | Hike Probability |
|---|---|---|---|
| Pre-CPI | Low (diminished) | High | Minimal |
| Post-CPI | 0% | ~70% | ~30% |
For investors holding rate-sensitive assets, particularly long-duration bonds and growth equities, a 30% hike probability is not statistical noise. It represents a meaningful reassessment of the policy path that cannot be dismissed without a clear reversal in the data.
Kevin Warsh’s confirmation as the incoming Fed chair, replacing Jerome Powell with a transition effective 15 May 2026, places him at the centre of an institution whose options have narrowed considerably. His 21 April Senate Banking Committee confirmation hearing addressed Fed independence and price stability in his opening remarks, signalling his orientation before the CPI print was even released.
The April data has already constrained his choices. A new Fed chair’s first months set the market’s expectations about inflation tolerance, and a 3.8% headline print with the 30-year yield testing 5% leaves no room for ambiguity.
At the next Federal Open Market Committee (FOMC) meeting, Warsh faces three options: hold rates (the expected outcome), signal a hike through upgraded inflation language in the post-meeting statement (a hawkish credibility move), or hold with minimal changes (which risks being read as passive). The April data effectively removes the possibility of a dovish pivot without serious credibility cost. Any suggestion of softness on inflation would be immediately punished by a bond market already positioned for a prolonged hold.
No verified post-CPI public statements from Warsh have been confirmed as of 12 May 2026.
For investors who want to understand the full scope of what a Warsh-led Fed means beyond the funds rate, our deep-dive into Warsh’s balance sheet policy examines how accelerated quantitative tightening could steepen the yield curve even as short-term rates hold, why his proposed elimination of the dot-plot would increase FOMC volatility for options traders, and how bank capital deregulation plans interact with fixed-income pricing.
The 30-year Treasury yield pushing toward 5% is not a reaction to the April CPI alone. It is the bond market’s verdict on long-run inflation expectations and fiscal dynamics, a signal that stretches well beyond the next FOMC meeting. The 10-year yield settled at 4.463%, up more than 4 basis points on the day.
Wolfe Research’s yield decomposition model attributes only 10-15 basis points of the 40-basis-point surge in the 10-year Treasury to the Iran geopolitical shock itself, leaving a structural yield floor driven by growth repricing and fiscal dynamics that a Hormuz peace deal would not unwind, a finding that complicates any investment thesis built around yields falling sharply once the energy crisis resolves.
| Asset | Move | Level |
|---|---|---|
| 30-Year Treasury | Yield near 5% | ~4.98% |
| S&P 500 | -0.16% (recovered from -1.00% intraday) | 7,401 |
| NASDAQ Composite | -0.71% | 26,088 |
| Gold | -0.43% | US$4,715.13 |
Equity markets largely absorbed the news. The S&P 500 settled at 7,401, down just 0.16% after recovering from a 1% intraday drop. The VIX declined 2.12% to 17.99, suggesting equity investors are not yet treating the inflation print as a crisis-level event. Citigroup has maintained its bullish gold outlook with a US$5,000 per ounce base case target, reaffirmed in the context of the inflation surprise.
The divergence between equity resilience and bond market stress is the key signal: equity investors are discounting the inflation data as manageable, while bond markets are pricing a more durable shift in the rate environment.
Three specific indicators will determine whether April’s print was a peak or a prelude:
The Atlanta Fed GDPNow model tracking Q2 growth at 3.7% means an economic slowdown is not currently the Fed’s exit ramp. Investors who can separate the energy shock component from the structural inflation trend will be better positioned to distinguish between a temporary yield spike and a durable regime change.
This article is for informational purposes only and should not be considered financial advice. Investors should conduct their own research and consult with financial professionals before making investment decisions.
The core shift is clear: rate cuts in 2026 are effectively off the table, a hike is a live probability, and the long end of the Treasury curve is pricing inflation that stays elevated. What remains genuinely uncertain is whether the Hormuz disruption proves transitory, whether Warsh signals a more hawkish bias than Powell, and whether the labour market begins to soften in the months ahead.
For the rate cut narrative to revive, investors would need to see a combination of falling energy prices, a May CPI print at or below consensus, and evidence that labour market momentum is fading. Until at least two of those three conditions materialise, 3.8% headline inflation with a 30% hike probability is the baseline, and portfolios should be positioned accordingly.
Past performance does not guarantee future results. Financial projections are subject to market conditions and various risk factors.
The April 2026 US inflation rate came in at 3.8% year-on-year, the highest reading since May 2023, with core CPI at 2.8% year-on-year, both figures exceeding analyst forecasts.
The April 2026 inflation surge was driven by a combination of an energy shock linked to disruption of oil flows through the Strait of Hormuz, rising airline fares up 20.7% year-on-year, and broad-based price pressures that lifted both headline and core CPI above consensus.
The CME FedWatch tool calculates implied probabilities of Federal Reserve rate decisions using federal funds futures prices; following the April CPI release, it registered 0% probability of any rate cut in 2026 and approximately 30% probability of a rate hike by December 2026.
The 10-year Treasury yield climbed more than 4 basis points to 4.463% following the April CPI release, while the 30-year Treasury yield pushed toward 5%, reflecting the bond market pricing in a more durable shift in the rate environment.
Investors should monitor three key indicators: the timeline for resolving the Strait of Hormuz disruption, Kevin Warsh's first FOMC communication as Fed chair, and the May CPI release, which will either confirm or reverse the April trend.