Why HSBC’s Market Outlook Favours European Over U.S. Fixed Income
1 hr ago

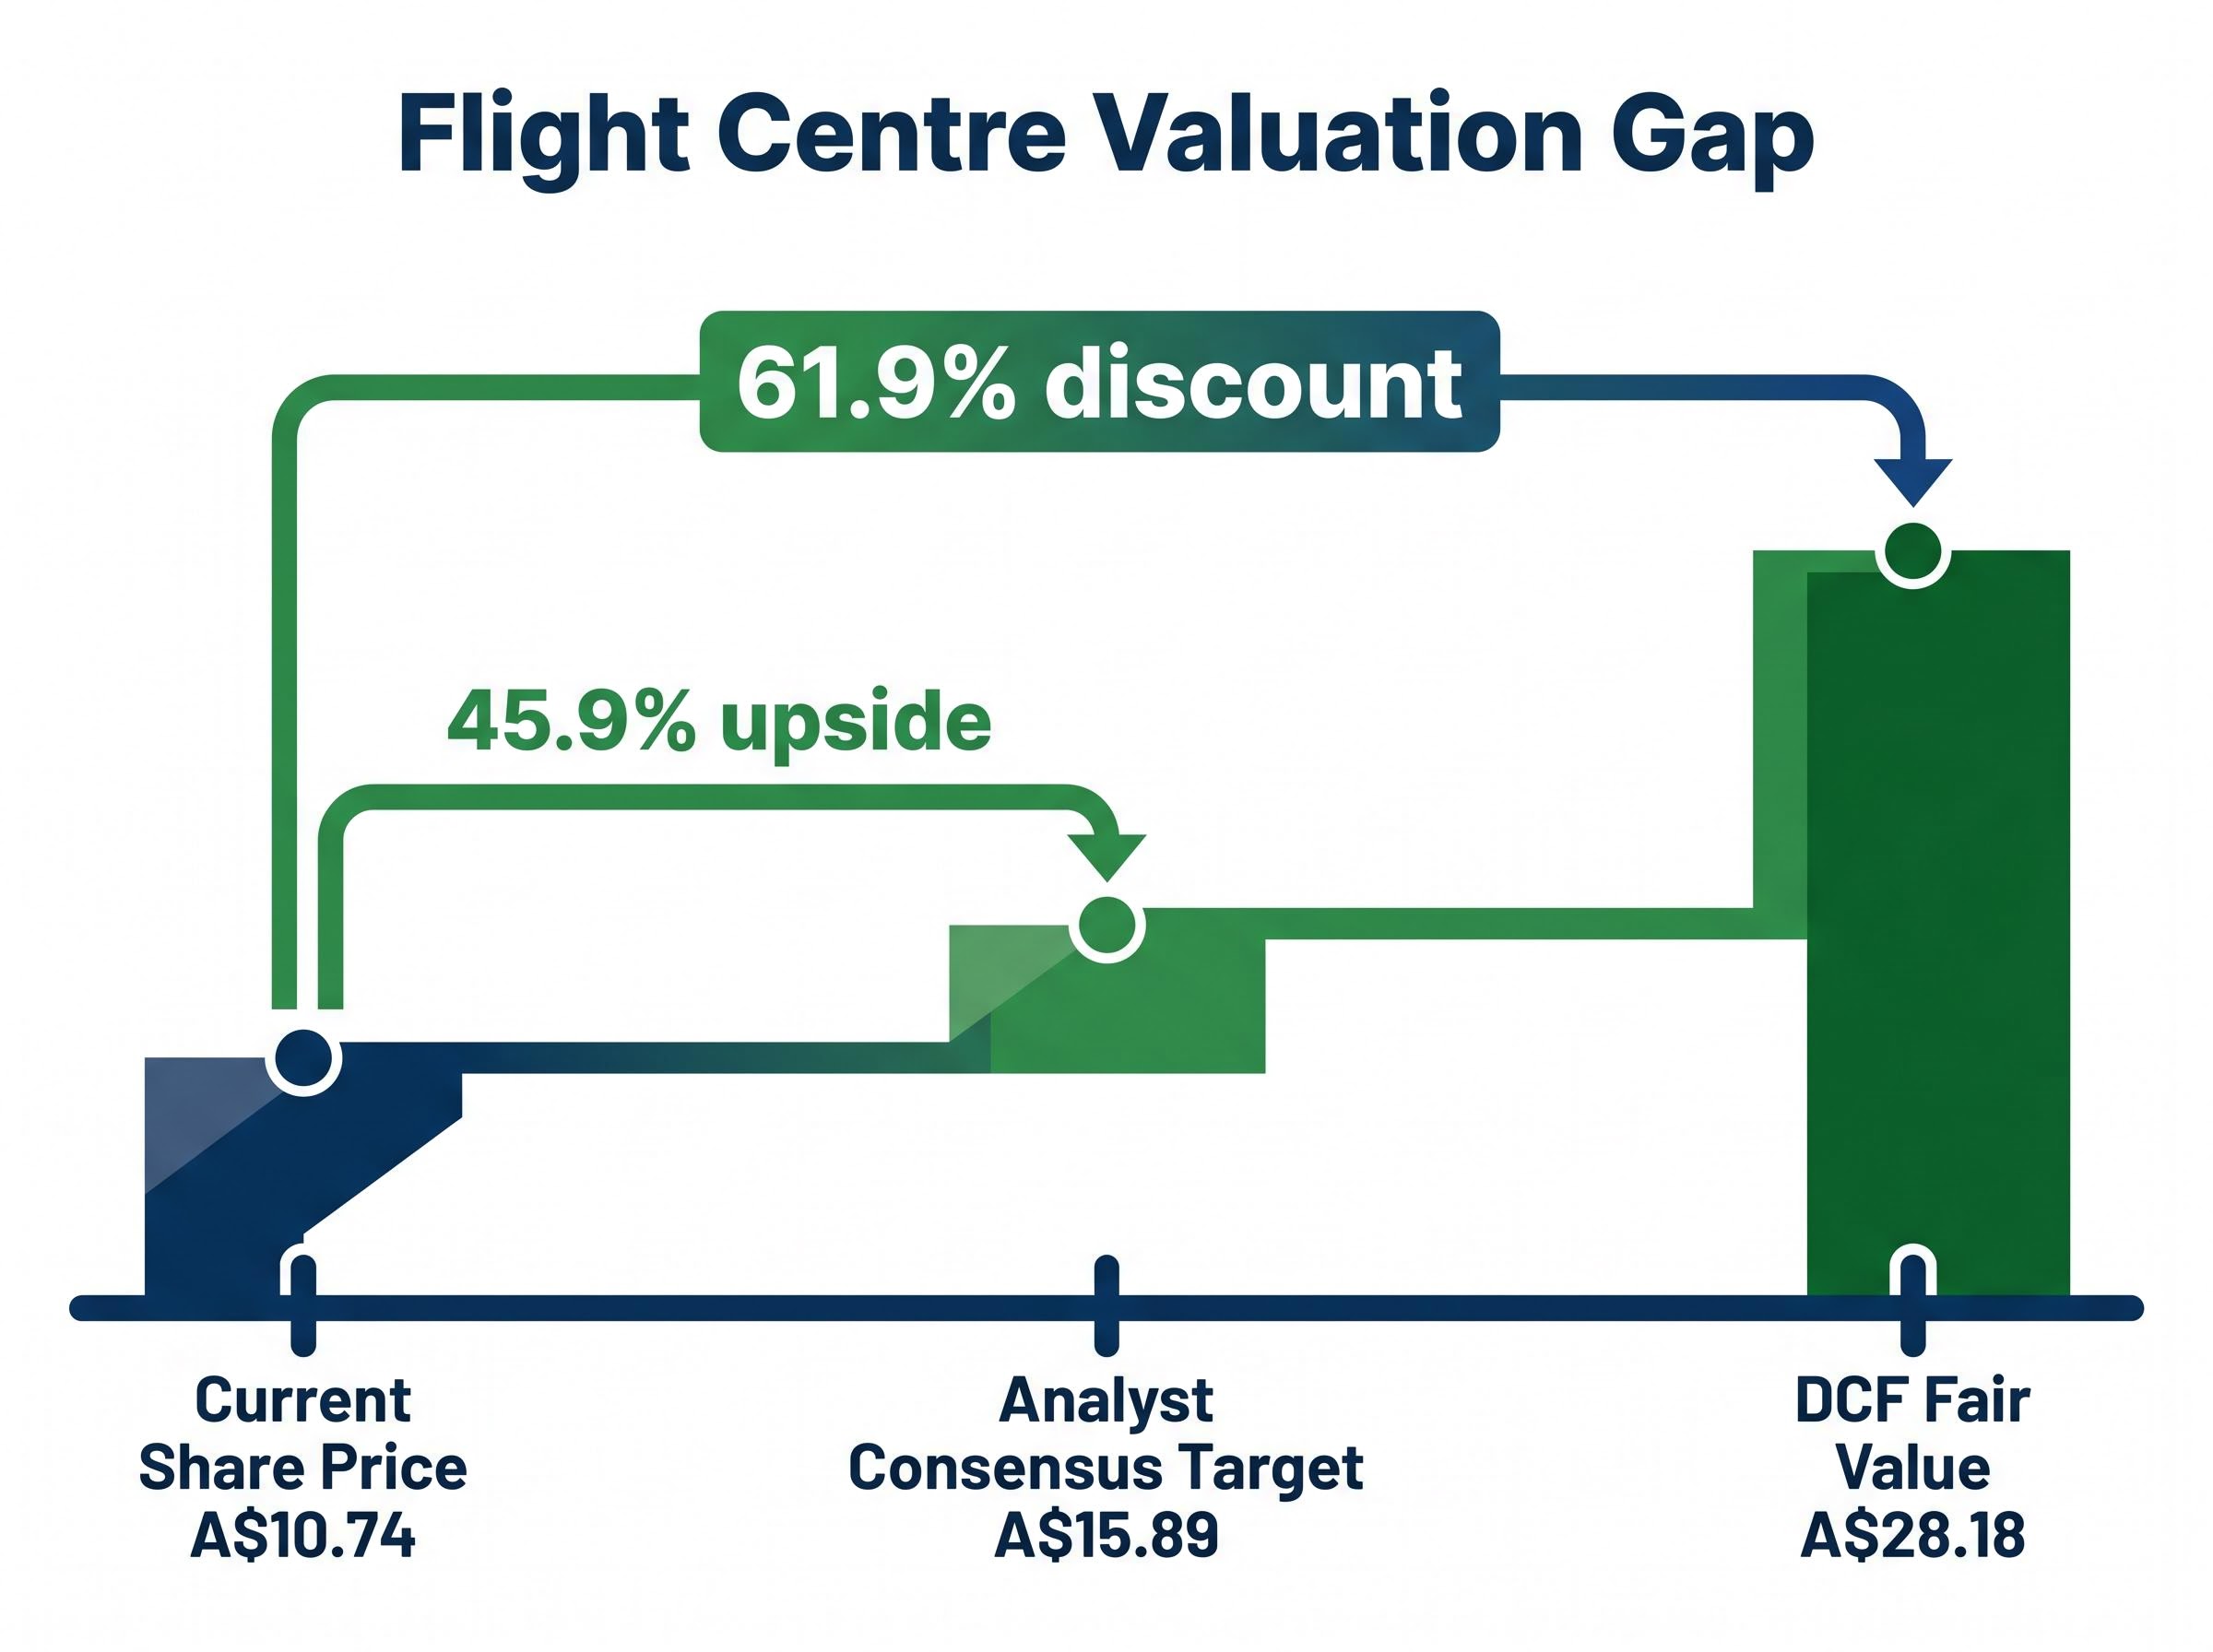
Flight Centre shares closed at A$10.74 on 10 May 2026, roughly 28% below where they started 2025 and trading at a price-to-sales ratio of 0.82x against a five-year historical average of 3.42x. On the surface, that looks like a clear undervaluation signal. But a 28% share price decline paired with growing revenues and a reaffirmed profit guidance range of A$315 million to A$350 million for FY2026 creates a disconnect that deserves more than a quick ratio comparison.
The stock carries an analyst consensus price target of A$15.89, implying around 45.9% upside, and a Simply Wall St discounted cash flow estimate of A$28.18. Yet the market continues to price it as though the recovery thesis is in doubt. What follows unpacks what is actually driving the gap between fundamental signals and share price, examines the real risks that could keep the discount in place, and gives Australian retail investors a framework for deciding whether the valuation gap represents an entry opportunity or a warning worth heeding.
Flight Centre’s total transaction value grew 7.6% year-on-year to A$19.5 billion through March 2026. Underlying profit before tax for the nine-month period rose 9.7% to A$226.4 million. Management reaffirmed FY2026 guidance. The business, by its own operational metrics, is expanding.
The share price tells a different story. At A$10.74, the stock has shed approximately 28% since January 2025. The price-to-sales ratio sits at 0.82x, a fraction of the 3.42x five-year historical average.
0.82x versus a five-year historical average of 3.42x: the market is paying less than a quarter of the historical premium for each dollar of Flight Centre’s revenue.
The analyst community does not share the market’s scepticism. Of the 15 to 16 analysts covering the stock, the consensus rates it a buy with a target of A$15.89 and a high target of A$19.14.
Three numbers frame the question this article sets out to answer:
Either the market is pricing in risks the headline numbers do not capture, or it has mispriced a recovery that the operational data supports. The answer lies somewhere between the two, and the distinction matters.
The price-to-sales ratio measures what the market is willing to pay for each dollar of a company’s revenue. It strips out profit variability, making it useful as a starting point for comparing how much investors value a company’s top line relative to its history or its peers.
At 0.82x to 0.9x, Flight Centre’s current P/S ratio looks dramatically compressed against a historical range of 1.6x to 3.42x. That gap, taken alone, suggests the market is assigning far less value to the company’s revenue stream than it has at any point in the past five years.
But P/S ratios can compress without indicating a business problem. The five-year average was inflated by post-pandemic recovery sentiment, when travel stocks attracted elevated multiples on the expectation of a sustained demand rebound. That peak was always likely to revert.
The more telling data point is what happened to profitability while revenue continued to grow.
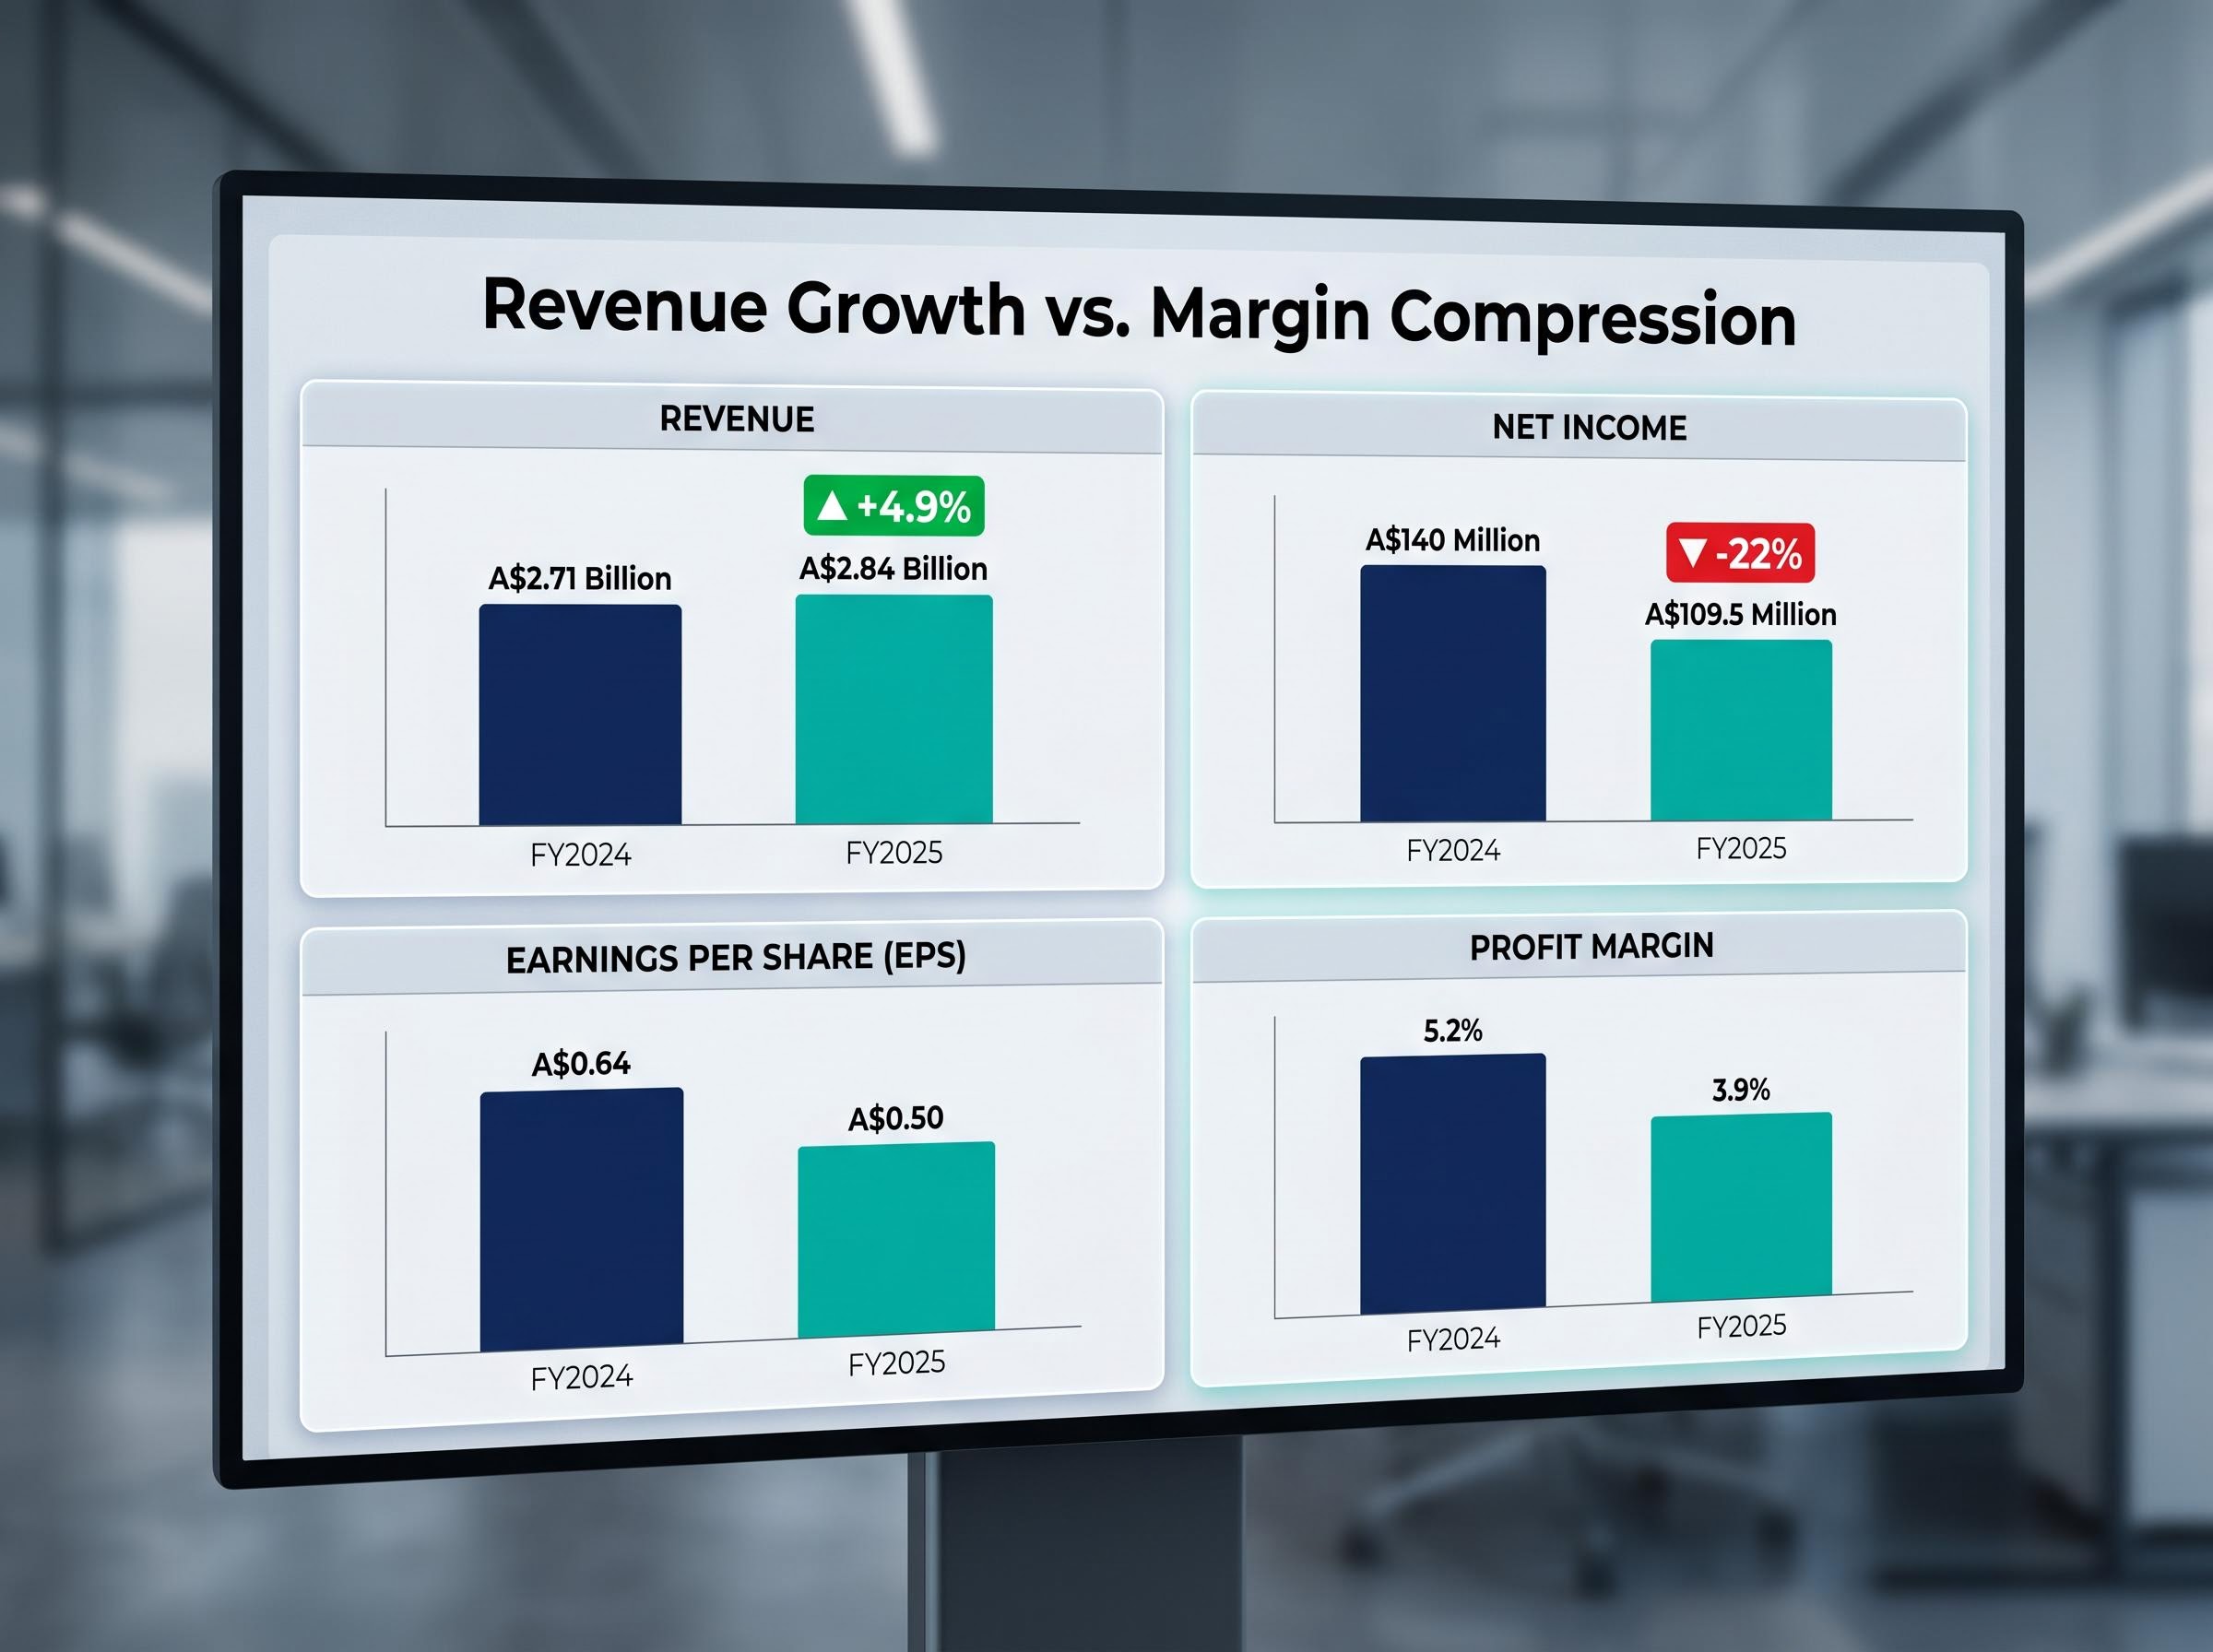
| Metric | FY2024 | FY2025 |
|---|---|---|
| Revenue | ~A$2.71 billion | A$2.84 billion (+4.9%) |
| Net income | ~A$140 million | A$109.5 million (-22%) |
| EPS | A$0.64 | A$0.50 |
| Profit margin | 5.2% | 3.9% |
Revenue rose 4.9% in FY2025. Net income fell 22%. Earnings per share dropped from A$0.64 to A$0.50, and the profit margin compressed from 5.2% to 3.9%. A market that reprices a stock’s revenue multiple downward when profits are shrinking faster than revenue is growing is not behaving irrationally. It is responding to margin deterioration.
Multiple contraction occurs when the market reduces the premium it is willing to pay for a dollar of revenue. This can happen without the business itself getting worse; it reflects a recalibration of expectations rather than a collapse in operations.
Flight Centre’s historical P/S peak coincided with a period of unusually elevated travel sector sentiment. Reversion toward a lower multiple was a structural expectation. The question is whether the current 0.82x has overshot fair value to the downside, or whether margin compression justifies the re-rating. That question cannot be answered by the P/S ratio alone.
The valuation mechanics provide part of the picture. The rest comes from three qualitative headwinds that the market is actively pricing into Flight Centre shares.
A$10 million: the estimated profit impact from Middle East disruptions in April 2026 alone, absorbed within reaffirmed FY2026 guidance of A$315 million to A$350 million underlying PBT.
AUD weakness adds a layer of complexity. A weaker Australian dollar can boost outbound travel demand by making overseas destinations feel more aspirational, but it simultaneously compresses margins on cost bases denominated in foreign currencies. The net effect depends on the mix, and for a company already operating on 3.9% margins, the tolerance for adverse currency movements is thin.
These headwinds are not hypothetical. They are already visible in the profit margin trajectory and in the April trading disruption. The reaffirmed guidance range of A$315 million to A$350 million underlying PBT absorbs the April shock, but a sustained geopolitical event could test the lower bound.
Against those headwinds, Flight Centre’s management has deployed three levers, each at a different stage of execution.
The analyst consensus earnings growth forecast of 23.1% per year underpins the bull case. If that growth materialises, the current share price would look significantly undervalued in hindsight. The operative word is “if.”
The post-June 2026 FY2026 results represent the next major catalyst. If underlying PBT lands within the A$315 million to A$350 million guidance range, the recovery thesis gains significant credibility with the market. Operational momentum through March supports that outcome.
A downward revision to guidance driven by sustained Middle East disruption would be the clearest signal that the discount reflects something more than sentiment. Until the full-year result lands, the thesis remains credible but unconfirmed.
Two plausible readings of Flight Centre’s current share price exist, and the data supports both simultaneously.
| Bull case signals | Bear case signals |
|---|---|
| 61.9% discount to DCF fair value of A$28.18 | 22% net income decline in FY2025 |
| 45.9% upside to analyst consensus of A$15.89 | Profit margins compressed to 3.9% under geopolitical pressure |
| FY2026 guidance reaffirmed at A$315M-A$350M PBT | OTA competition as a structural, not cyclical, drag |
| Analyst consensus forecasts 23.1% annual EPS growth | A$200M buyback lever now fully spent |
The tension between these two columns is unlikely to resolve through operational performance alone. A stock trading at this level of discount typically requires a specific re-rating catalyst for the market to upgrade its assessment.
Re-rating catalyst: the market rarely closes a valuation gap on gradual improvement alone. A meaningful earnings beat, an M&A announcement, or geopolitical stabilisation would each provide the market a reason to reprice. Without one, the discount can persist even as the business executes.
The P/S ratio is a starting signal, not a conclusion. Investors considering a position would benefit from cross-referencing it with DCF analysis, assessing whether the 23.1% earnings growth forecast is plausible given the margin trajectory, and sizing any position to reflect the genuine uncertainty that remains.
Flight Centre’s share price discount is analytically meaningful. Multiple data sources, from the DCF estimate to the analyst consensus to the nine-month trading update, support the view that the business is performing better than the share price implies. That is a factual observation, not a buy signal.
Closing the gap requires specific conditions to materialise, not just the passage of time. Three watch items define the near-term outlook for Australian retail investors:
At A$10.74, the market is pricing in meaningful ongoing uncertainty. Investors who disagree with that assessment have a data-supported case, anchored to 23.1% forecast earnings growth and a guidance range of A$315 million to A$350 million underlying PBT. But a data-supported case and a correctly timed entry are different things. The strength of the thesis depends on what changes and when.
This article is for informational purposes only and should not be considered financial advice. Investors should conduct their own research and consult with financial professionals before making investment decisions. Past performance does not guarantee future results. Financial projections are subject to market conditions and various risk factors.
A price-to-sales ratio measures what investors pay for each dollar of a company's revenue. Flight Centre's current P/S ratio of 0.82x sits well below its five-year historical average of 3.42x, suggesting the market is assigning significantly less value to the company's revenue stream than it has historically.
Although Flight Centre's revenue grew 4.9% in FY2025, net income fell 22% and profit margins compressed from 5.2% to 3.9%, which the market has responded to by repricing the stock lower. Additional headwinds including geopolitical disruption, online travel agency competition, and macroeconomic pressure on Australian consumers have compounded the decline.
The analyst consensus price target for Flight Centre is A$15.89, implying approximately 45.9% upside from the current share price of A$10.74, with a high analyst target of A$19.14.
The key potential re-rating catalysts include a full-year FY2026 result landing within the guided A$315-A$350 million underlying profit range, stabilisation of Middle East geopolitical tensions, and any merger or acquisition announcement from management, which has flagged M&A as its primary remaining capital deployment lever.
Flight Centre completed a A$200 million share buyback programme on 16 April 2026, retiring 16.2 million shares representing 7.3% of shares on issue. No further buyback has been announced, meaning this capital management lever has been fully exhausted.