
How the US Government Became Intel’s Investor and Deal Broker
1 hr ago

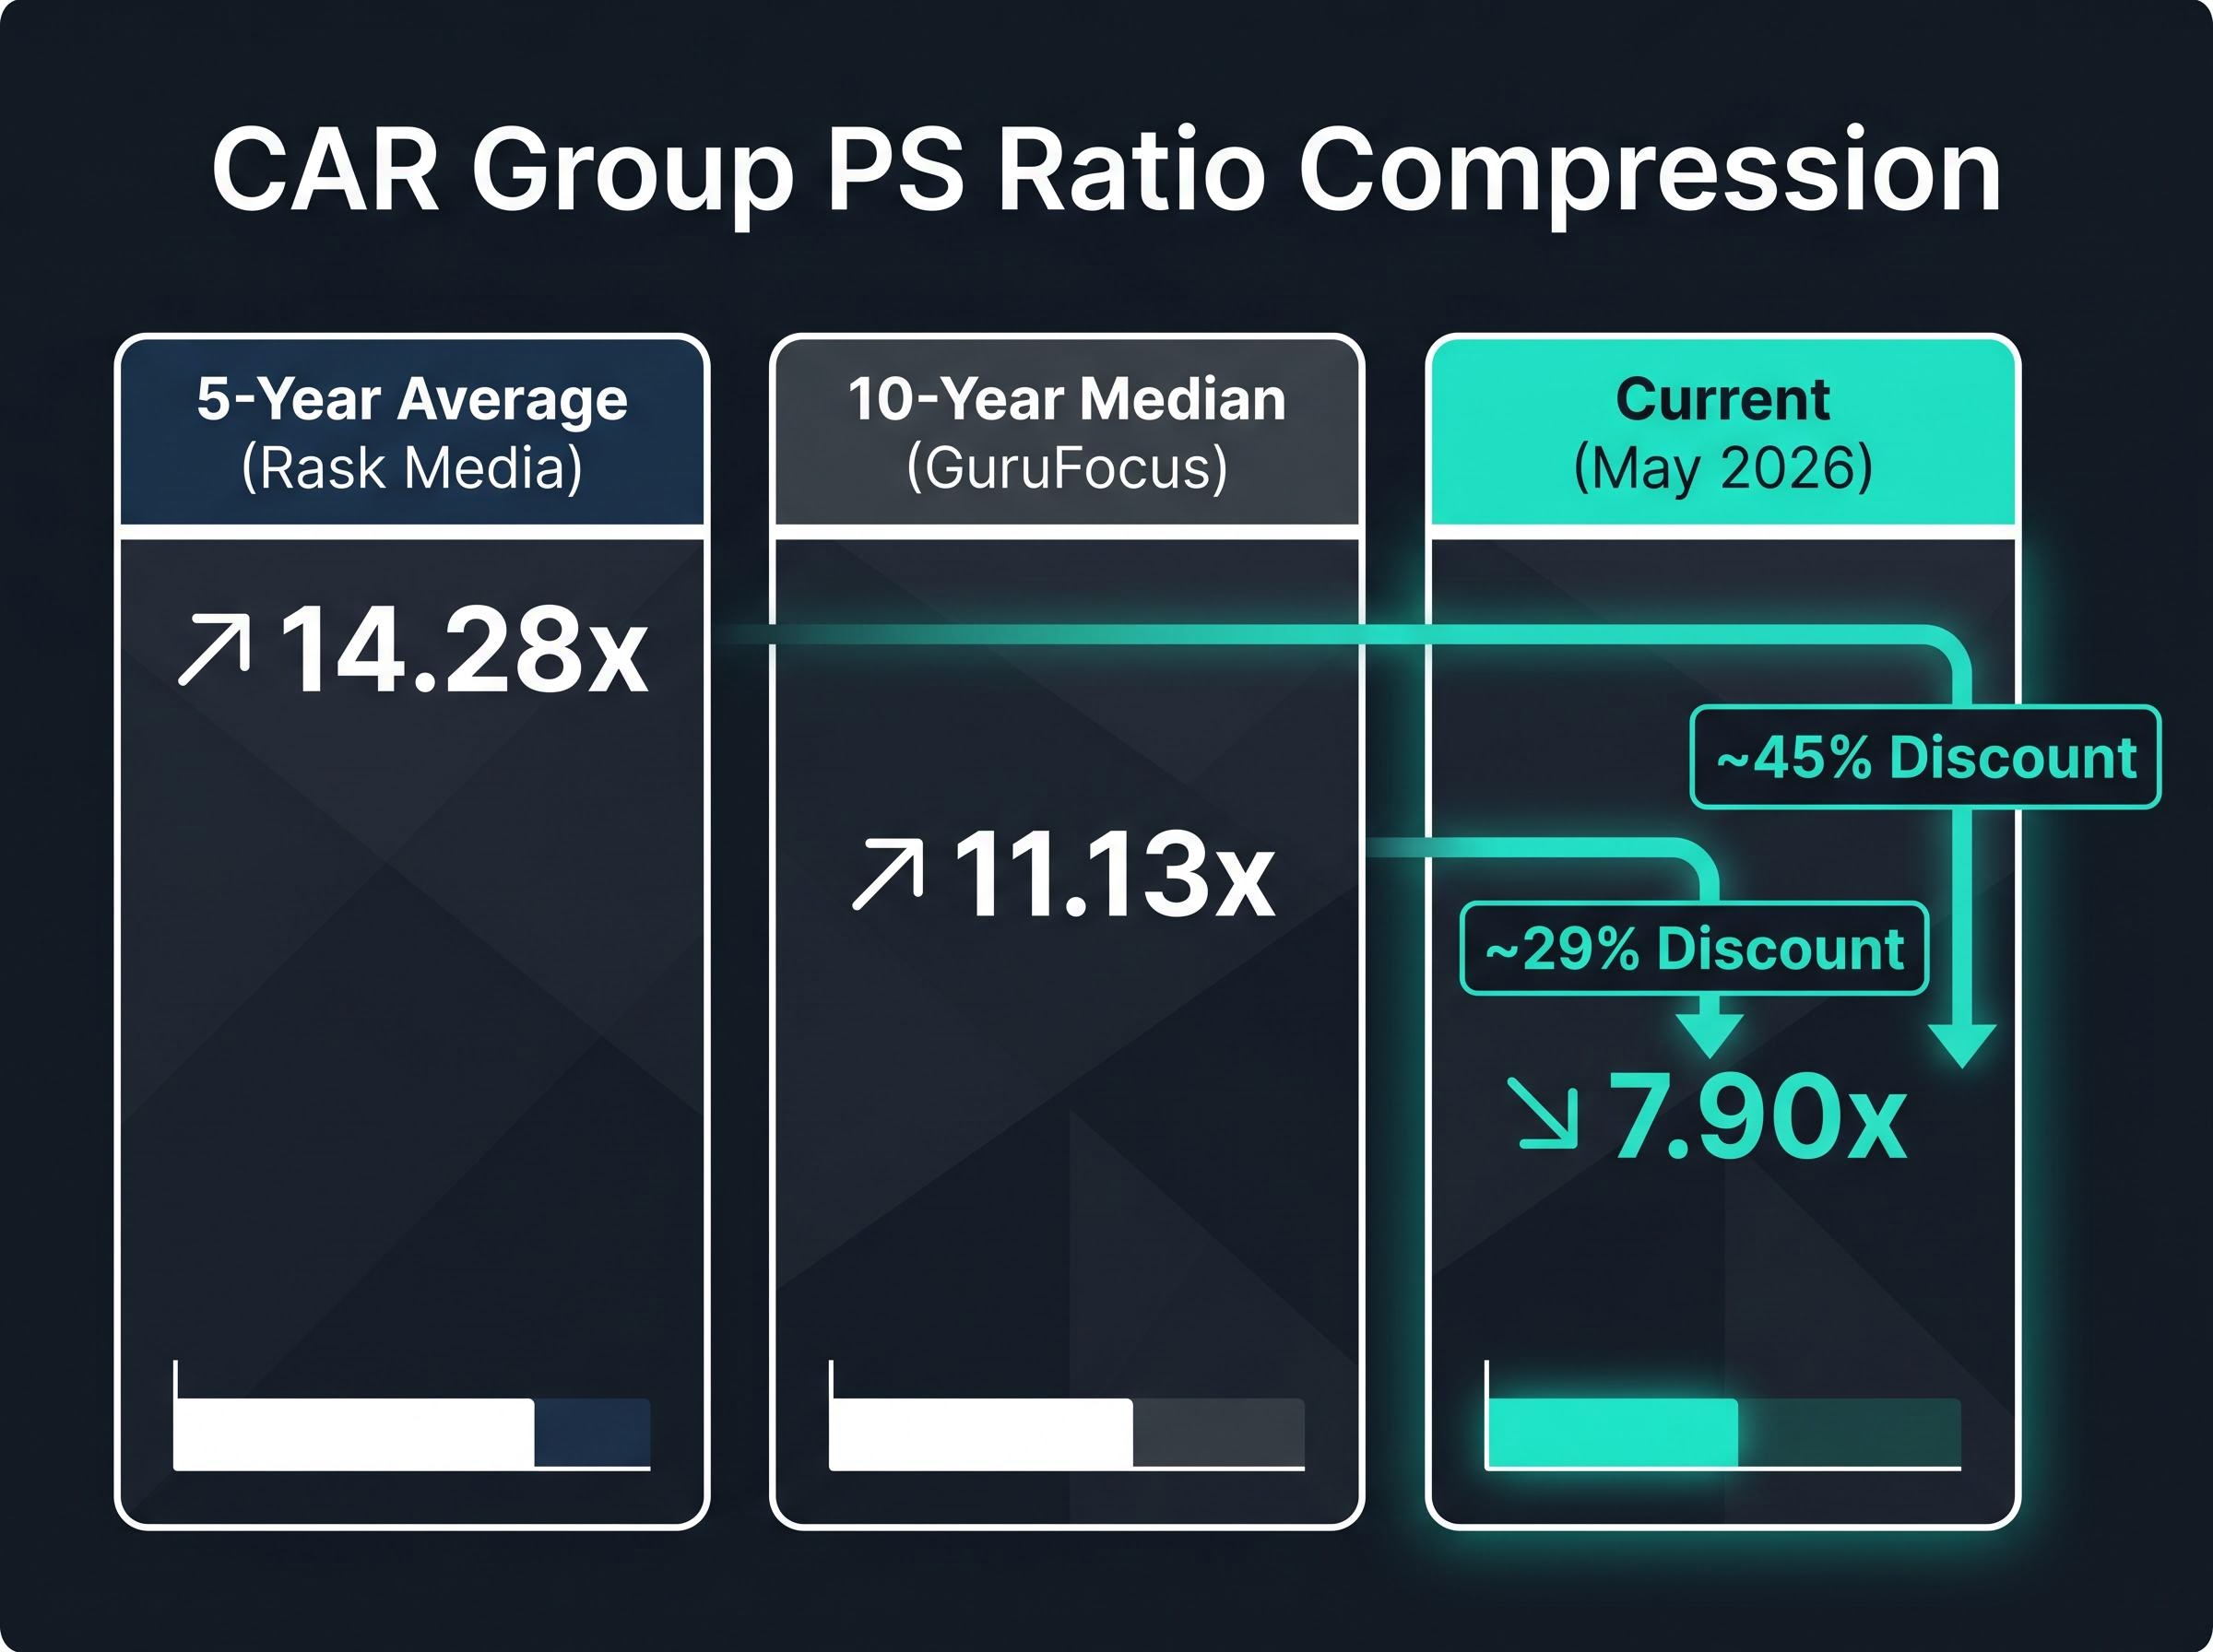
CAR Group (ASX: CAR) is trading at a price-to-sales (PS) ratio of 7.90x, roughly 45% below its five-year historical average of 14.28x. For most ASX stocks, a discount of that magnitude would raise immediate concerns about deteriorating fundamentals. For a digital marketplace business, the signal is more ambiguous. The share price has fallen approximately 37.7% from its 52-week high of A$42.06, sitting at A$26.22 as of 10 May 2026, with a market capitalisation of A$9.93 billion. Revenue has continued to grow over this period, meaning the PS compression reflects both price decline and expanding sales, not a collapse in demand. What follows is an analysis of what the PS gap actually signals, why digital marketplace businesses command structurally elevated multiples, how CAR Group compares to ASX peers such as REA Group and Domain Holdings, and what analyst consensus and DCF estimates imply about fair value from here.
The headline number is stark. At 7.90x trailing revenue, CAR Group’s PS ratio sits approximately 45% below its five-year average of 14.28x and roughly 29% below its 10-year median of 11.13x, according to data from Stock Analysis, Rask Media, and GuruFocus respectively.
| PS Reference Point | PS Ratio | Discount to Current |
|---|---|---|
| Current (May 2026) | 7.90x | — |
| 10-year median (GuruFocus) | 11.13x | ~29% |
| 5-year average (Rask Media) | 14.28x | ~45% |
A PS compression of approximately 45% below the five-year average is among the widest valuation gaps CAR Group has registered in the past decade.
The compression, however, is not a single-variable story. Two forces are pushing the ratio in the same direction simultaneously: a share price that has declined from A$42.06 to A$26.22, and trailing twelve-month revenue that has grown to A$1.23 billion. A PS discount driven by revenue growth is analytically distinct from one driven by collapsing demand. Recognising which type of compression is at work is the core question this analysis sets out to resolve.
A 14.28x five-year average PS ratio would look irrational for a manufacturer, a retailer, or a capital-intensive services business. For a digital marketplace, it reflects a fundamentally different cost structure.
CAR Group does not hold vehicle inventory. It does not operate dealerships or finance fleets. It monetises attention, data, and transaction flow through advertising, technology licensing, and consumer-to-consumer payment infrastructure, a model it has operated since the 1990s. Revenue per employee of A$492,094 offers a useful proxy for that capital efficiency.
Asset-light marketplace economics versus traditional capital-intensive economics:
The structural premium that digital marketplaces command over capital-intensive peers is well-supported by academic research on network effects in platform markets, which demonstrates that platforms generating self-reinforcing demand loops between buyers and sellers sustain pricing power and margin expansion well beyond what traditional cost-plus business models can achieve.
Compare this with capital-intensive businesses where:
Capital-intensive automotive businesses like Eagers Automotive, which announced three simultaneous acquisitions adding approximately A$630 million in annual dealership revenue in early 2026, illustrate the reinvestment burden that asset-light marketplace models structurally avoid: each incremental dollar of revenue at a dealership network requires physical inventory, staffing, and floor space, while the same dollar earned through listing fees or data licensing at CAR Group requires almost none of those inputs.
This distinction matters because it recalibrates expectations. A 7-14x PS range for a high-margin, asset-light marketplace is not inherently irrational. It reflects the structural economics of the model. Without this framework, investors risk misreading a 7.90x PS as either alarming or unremarkable when it is, in fact, a historically unusual discount for this category of ASX business.
Absolute multiples only tell part of the story. Relative valuation within the ASX digital marketplace cohort provides the calibration that helps investors distinguish whether CAR Group looks cheap on its own terms or cheap relative to its closest comparable businesses.
| Company | Trailing PE | Forward PE | PS Ratio |
|---|---|---|---|
| CAR Group (ASX: CAR) | 32.96x | 22.48x | 7.90x |
| REA Group (ASX: REA) | ~40x | 30.64x | — |
| Domain Holdings (ASX: DHG) | ~30-40x | — | — |
The forward price-to-earnings (PE) comparison is where the relative signal sharpens. CAR Group’s forward PE of 22.48x sits materially below REA Group’s forward PE of 30.64x. For two businesses operating in the same structural category (digital marketplace, asset-light, Australian-domiciled), that gap carries genuine portfolio implications.
On a trailing basis, CAR Group’s PE of 32.96x sits below the broader industry trailing PE average of 37.40x reported by Investing.com, though Simply Wall St places it slightly above a peer average of 31.9x. The variance reflects different peer group definitions and data snapshot timing; directionally, CAR Group trades at or near the middle of its peer cohort on trailing earnings and at a meaningful discount on forward earnings.
The gap between A$26.22 and where analysts believe fair value sits is where the investment decision lives. A consensus price target of A$35.36 across 15 analysts tracked by Simply Wall St implies approximately 34.9% upside, with a target range spanning A$28.50 at the low end to A$41.00 at the high end.
Simply Wall St’s DCF fair value estimate of A$37.95 implies approximately 44.7% upside from the current share price, though DCF outputs are model-dependent and should be treated as directional rather than precise.
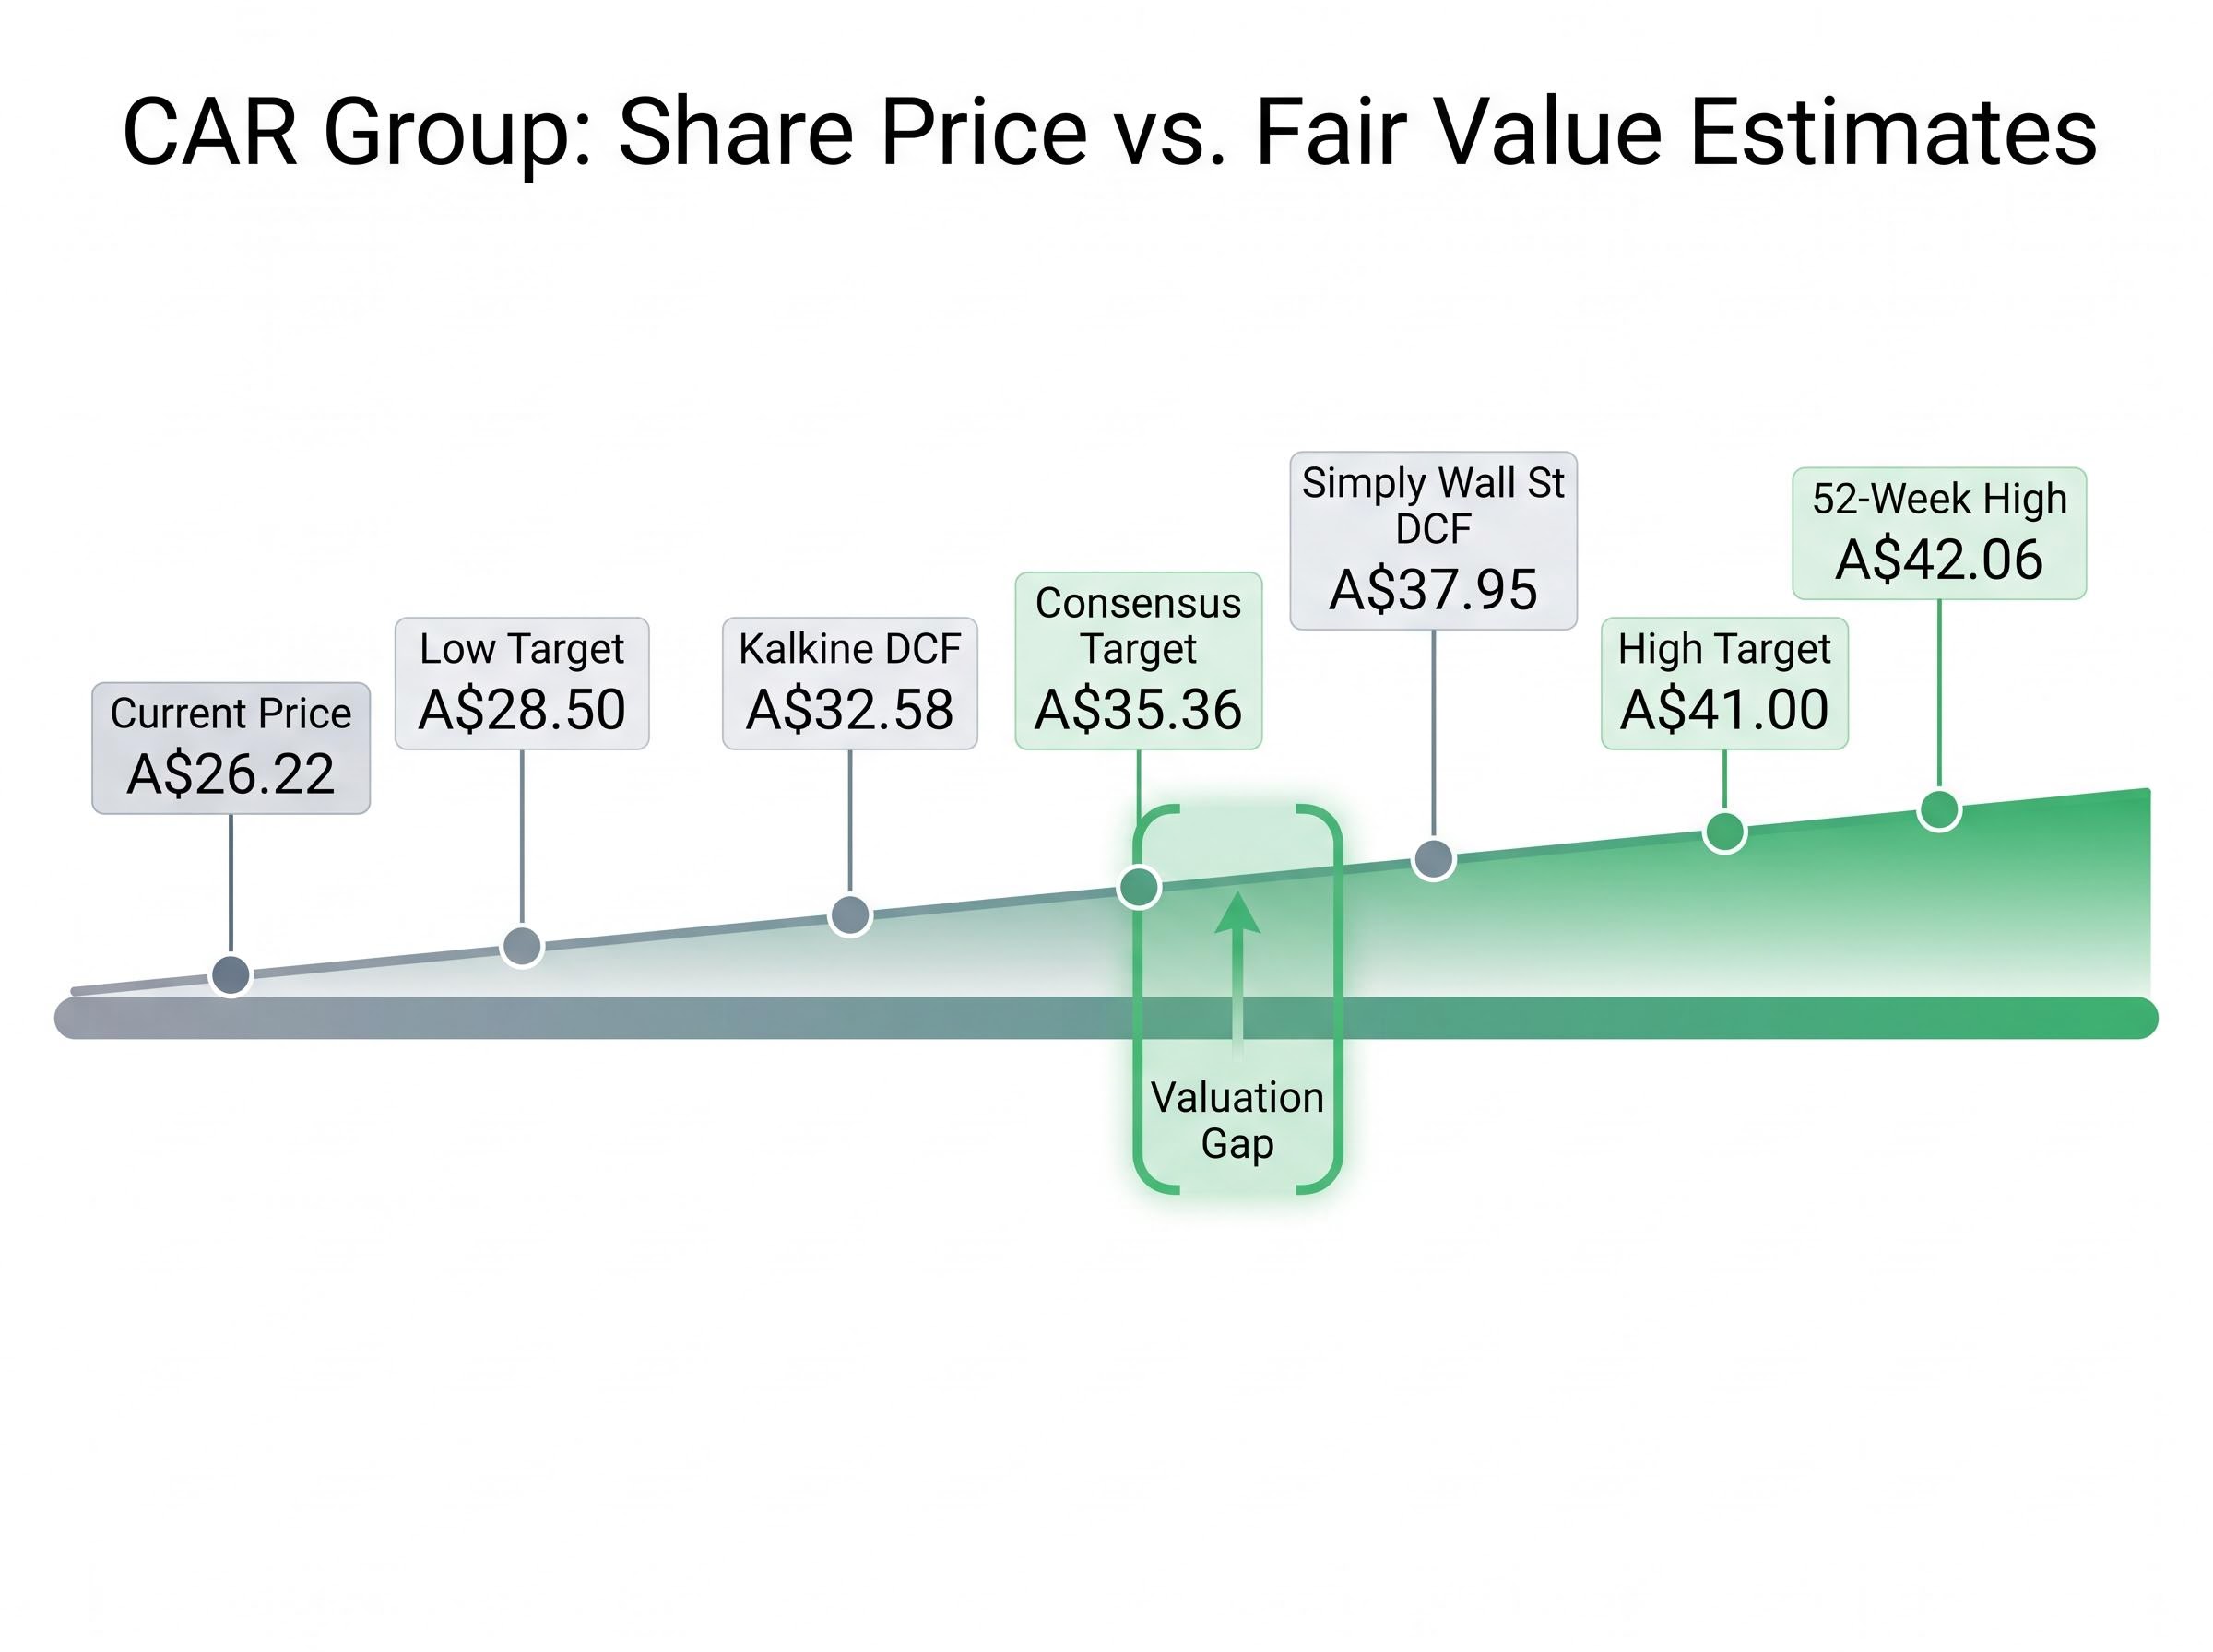
A separate DCF estimate from Kalkine places intrinsic value at A$32.58. Both sit above the current price, and both rely on assumptions about margin expansion and revenue growth that investors should interrogate rather than accept at face value. The GuruFocus GF Score of approximately 94-95 out of 100 (as of April 2026) reinforces the quantitative quality signal, though it does not address valuation directly.
Both the Kalkine DCF at A$32.58 and the Simply Wall St estimate at A$37.95 represent single-path outputs rather than probability-weighted scenario analysis, meaning they embed one set of growth and margin assumptions without explicitly pricing the probability of downside cases; investors relying on either figure alone are accepting the underlying model’s optimism without a visible discount for execution risk.
The assumptions underpinning these estimates centre on CAR Group’s AI-driven product strategy. The five initiatives most frequently cited by analysts are:
The H1 FY26 results released on 9 February 2026 were described as strong, with a higher dividend declared relative to the prior period. Annualised earnings implied at approximately A$394 million based on H1 data support the forward PE of 22.48x and the underlying growth trajectory. Whether the AI margin expansion story converts from thesis to delivered earnings is the question the market is currently discounting.
CAR Group’s H1 FY26 results announcement, released to the ASX on 9 February 2026, reported the revenue and earnings figures underpinning the annualised run-rate estimates cited here, including the higher dividend declared relative to the prior comparable period that analysts have cited as a confidence signal from management on forward earnings trajectory.
The bull case is coherent. That does not make it safe. Several counter-arguments deserve equal weight.
Simply Wall St assigns CAR Group a valuation score of 2 out of 6, a signal that the current price sits meaningfully below estimated future cash flow but that the margin of safety depends on growth delivery. The forward PE of 22.48x, while lower than peers, still reflects growth-phase pricing. Any earnings miss relative to the implied approximately A$394 million annualised run-rate would compress the re-rating thesis quickly.
The key risk flags:
Year-to-date performance has been negative, with figures ranging from -10.6% to -18.79% depending on the data snapshot, introducing additional uncertainty around near-term momentum.
Price drawdowns for shares of this magnitude, a 37.7% decline from a 52-week high, sit within the normal volatility range for high-growth ASX names but represent a category of risk that many investors underestimate when they enter a position based on a valuation gap rather than a thorough assessment of their own tolerance for interim capital loss.
Before committing capital, several data gaps warrant attention. The H1 FY26 results presentation and accompanying ASX filings would confirm net debt, EBITDA margins, and the international revenue split across the US, South Korea, and Brazil operations. These metrics were not available from public aggregator sources at the time of writing and represent material inputs to any DCF or earnings-based valuation model. Investors should also consider using multiple valuation methods, including PS in historical context, DCF, and peer comparison, rather than anchoring on any single metric.
A 45% PS discount to historical averages is meaningful context for a high-quality digital marketplace. It is not, on its own, an investment case. The compression reflects real price weakness alongside real revenue growth, a combination that rewards further investigation rather than an immediate conclusion.
The multi-method framework matters here. PS in historical context places CAR Group at its widest discount in years. Peer comparison on forward PE shows it trading at a material discount to REA Group. Analyst consensus clusters fair value estimates between A$32.58 (Kalkine DCF) and A$35.36 (consensus target), both above the current price. For the current discount to represent genuine long-term value, the AI-driven margin expansion thesis would need to convert into delivered earnings growth over the next two to three reporting periods.
Multi-method valuation frameworks that combine DCF outputs, comparable transaction multiples, and scenario-weighted earnings estimates tend to produce more reliable price anchors than any single metric, particularly for high-growth digital businesses where forward PE and PS ratios can diverge sharply depending on which growth assumptions an analyst embeds.
“A PS gap of this magnitude in an asset-light marketplace is a valuation signal worth investigating, not ignoring, but it rewards verification before conviction.”
The ex-dividend date of 13 March 2026 has passed. The next material catalyst for investors monitoring the stock is the full FY26 result and any updated guidance on margin expansion from AI-driven initiatives. That release will either confirm or challenge the re-rating thesis that the current valuation gap implies.
This article is for informational purposes only and should not be considered financial advice. Investors should conduct their own research and consult with financial professionals before making investment decisions. Past performance does not guarantee future results. Financial projections are subject to market conditions and various risk factors.
A price-to-sales (PS) ratio compares a company's market capitalisation to its total revenue, giving investors a sense of how much they are paying for each dollar of sales. For CAR Group, the current PS ratio of 7.90x sits roughly 45% below its five-year historical average of 14.28x, signalling an unusually wide valuation discount relative to its own history.
Digital marketplaces are asset-light, meaning incremental revenue requires minimal additional capital expenditure, and they benefit from network effects where more listings attract more buyers and vice versa. These structural advantages support higher margins and recurring revenue streams, which justify elevated PS ratios compared to capital-intensive businesses like retailers or manufacturers.
Fifteen analysts tracked by Simply Wall St have a consensus price target of A$35.36 for CAR Group, implying approximately 34.9% upside from the May 2026 share price of A$26.22, with individual targets ranging from A$28.50 at the low end to A$41.00 at the high end.
CAR Group's forward price-to-earnings ratio of 22.48x is materially below REA Group's forward PE of 30.64x, a notable discount given both companies operate as asset-light digital marketplaces listed on the ASX.
Key risks include an earnings miss against the implied annualised run-rate of approximately A$394 million, which would undermine the forward PE discount argument, as well as ongoing price momentum headwinds from a 37.7% decline from the 52-week high and a modest return on equity of 10.43% relative to the multiple being paid.


