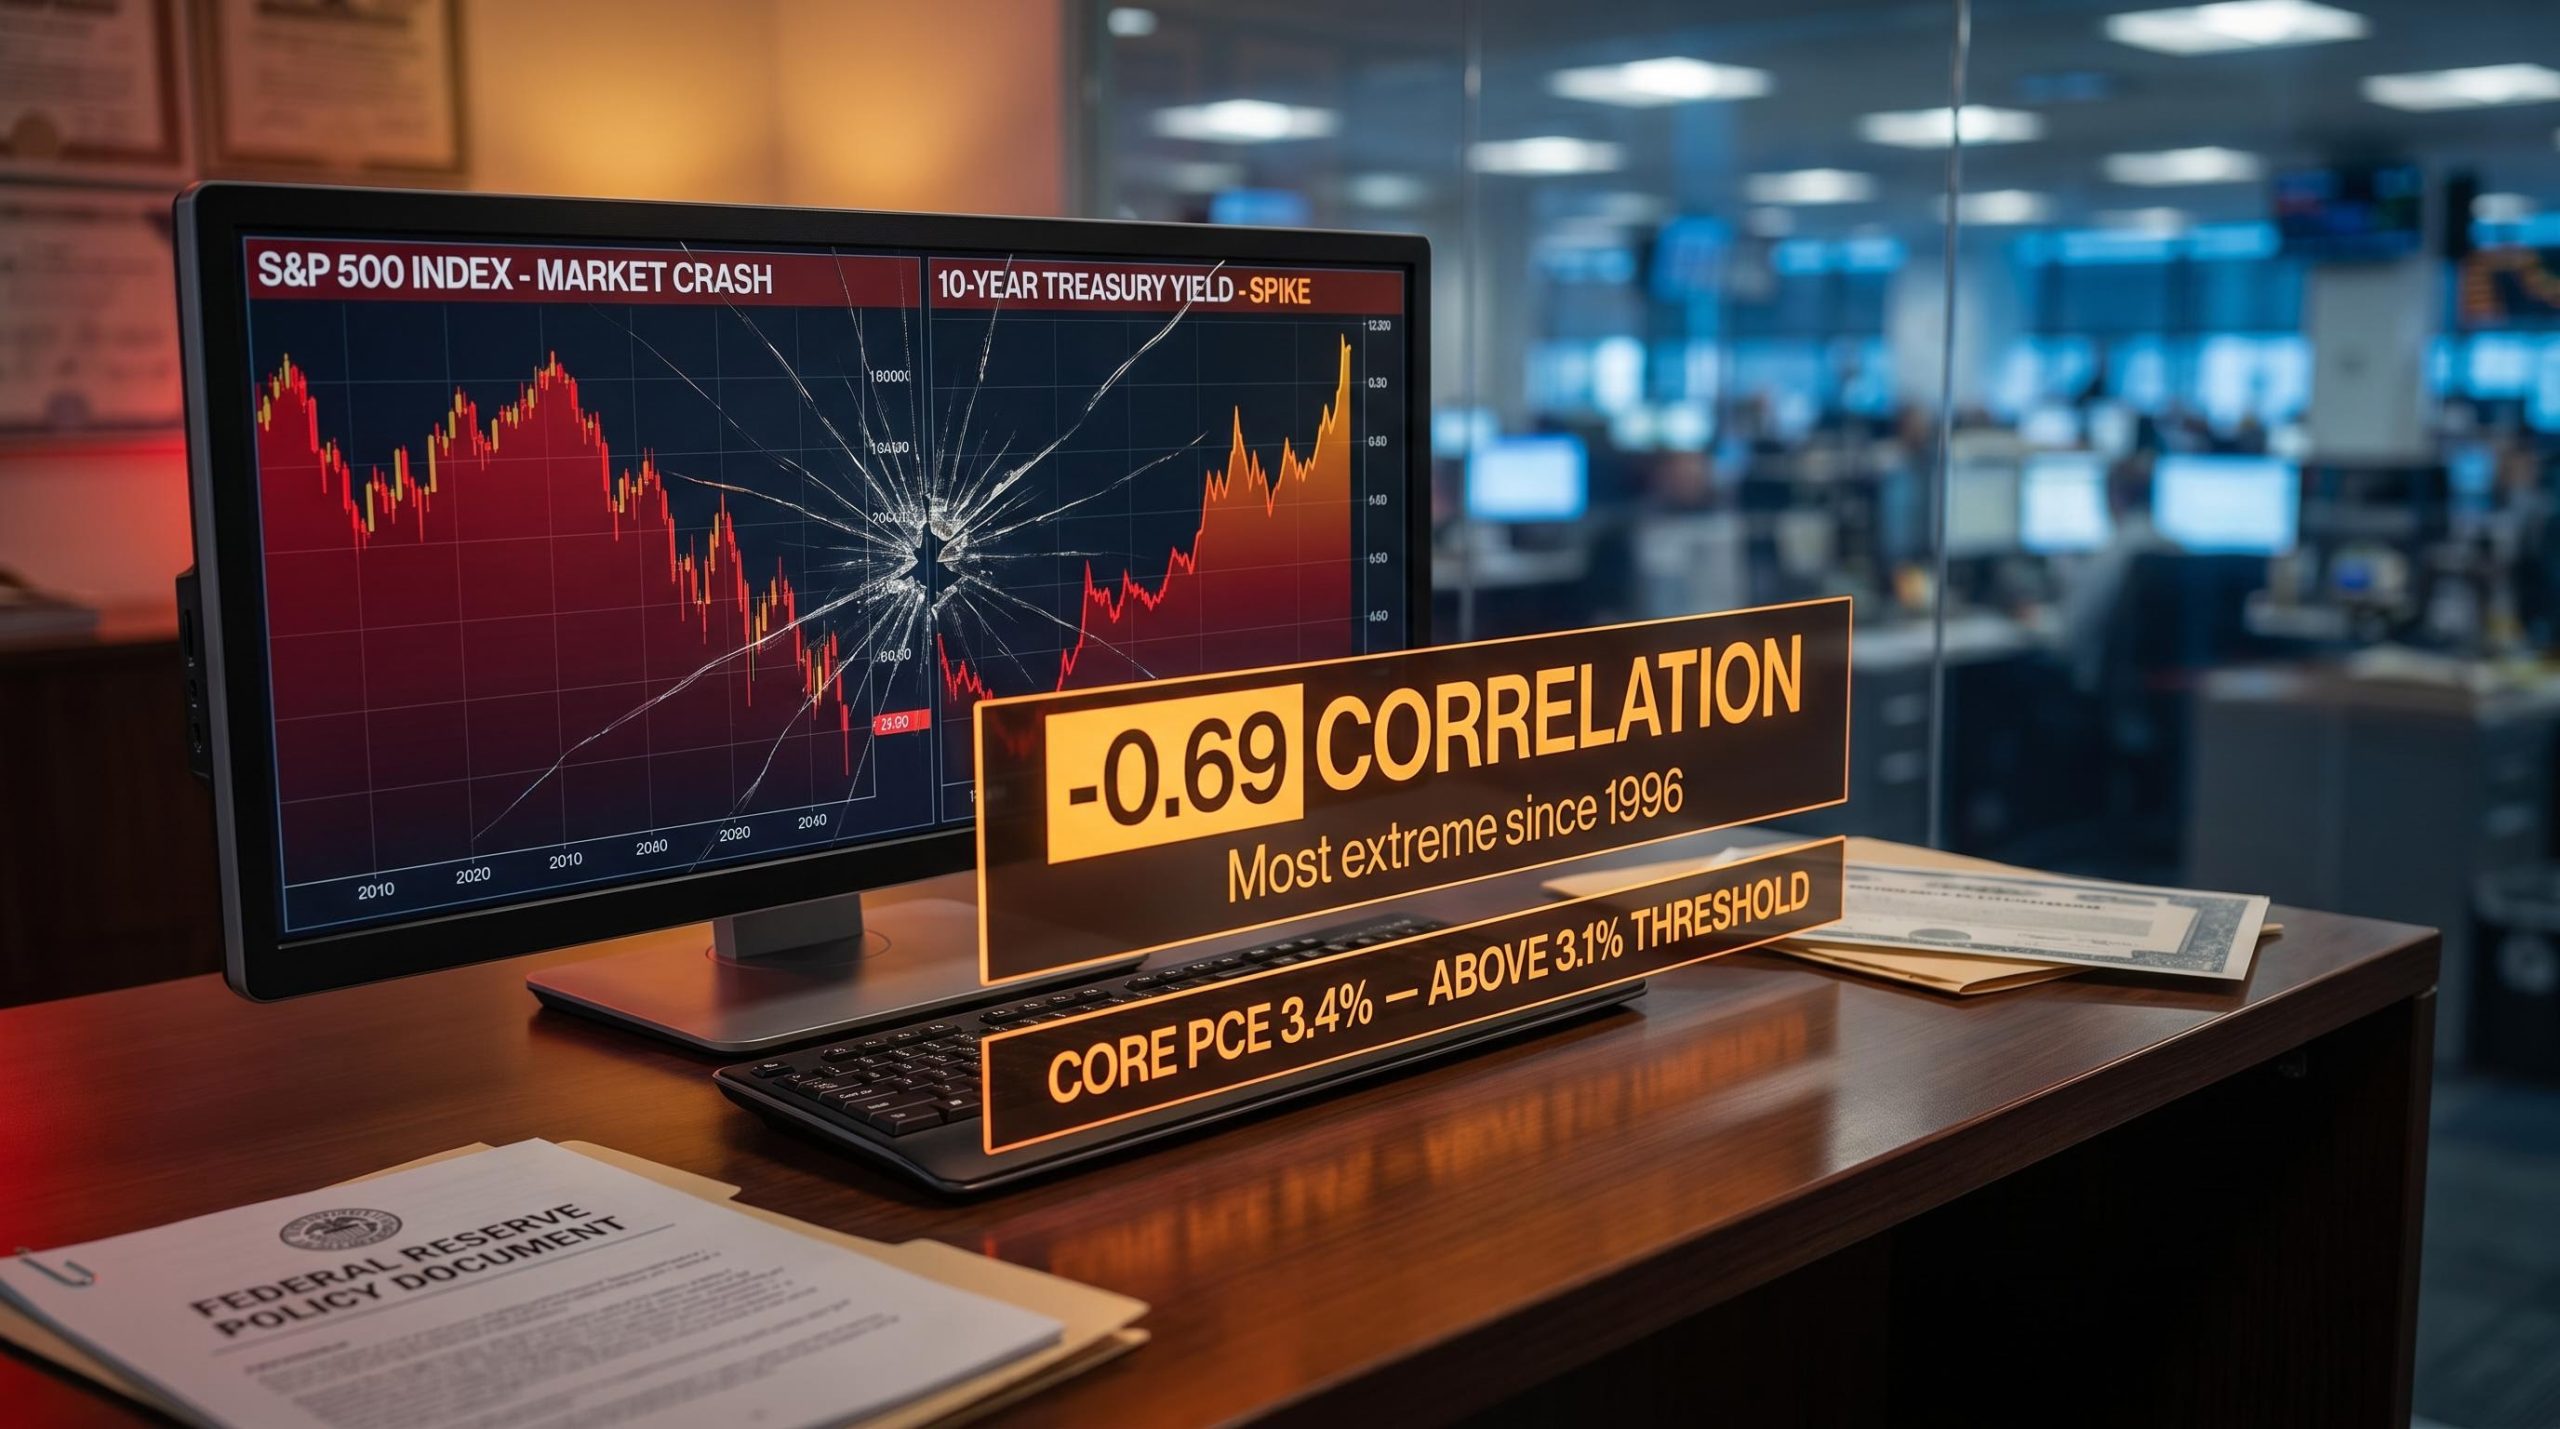
Stock-Bond Correlation Hits 30-Year Extreme, Rattling 60/40 Investors
3 hrs ago
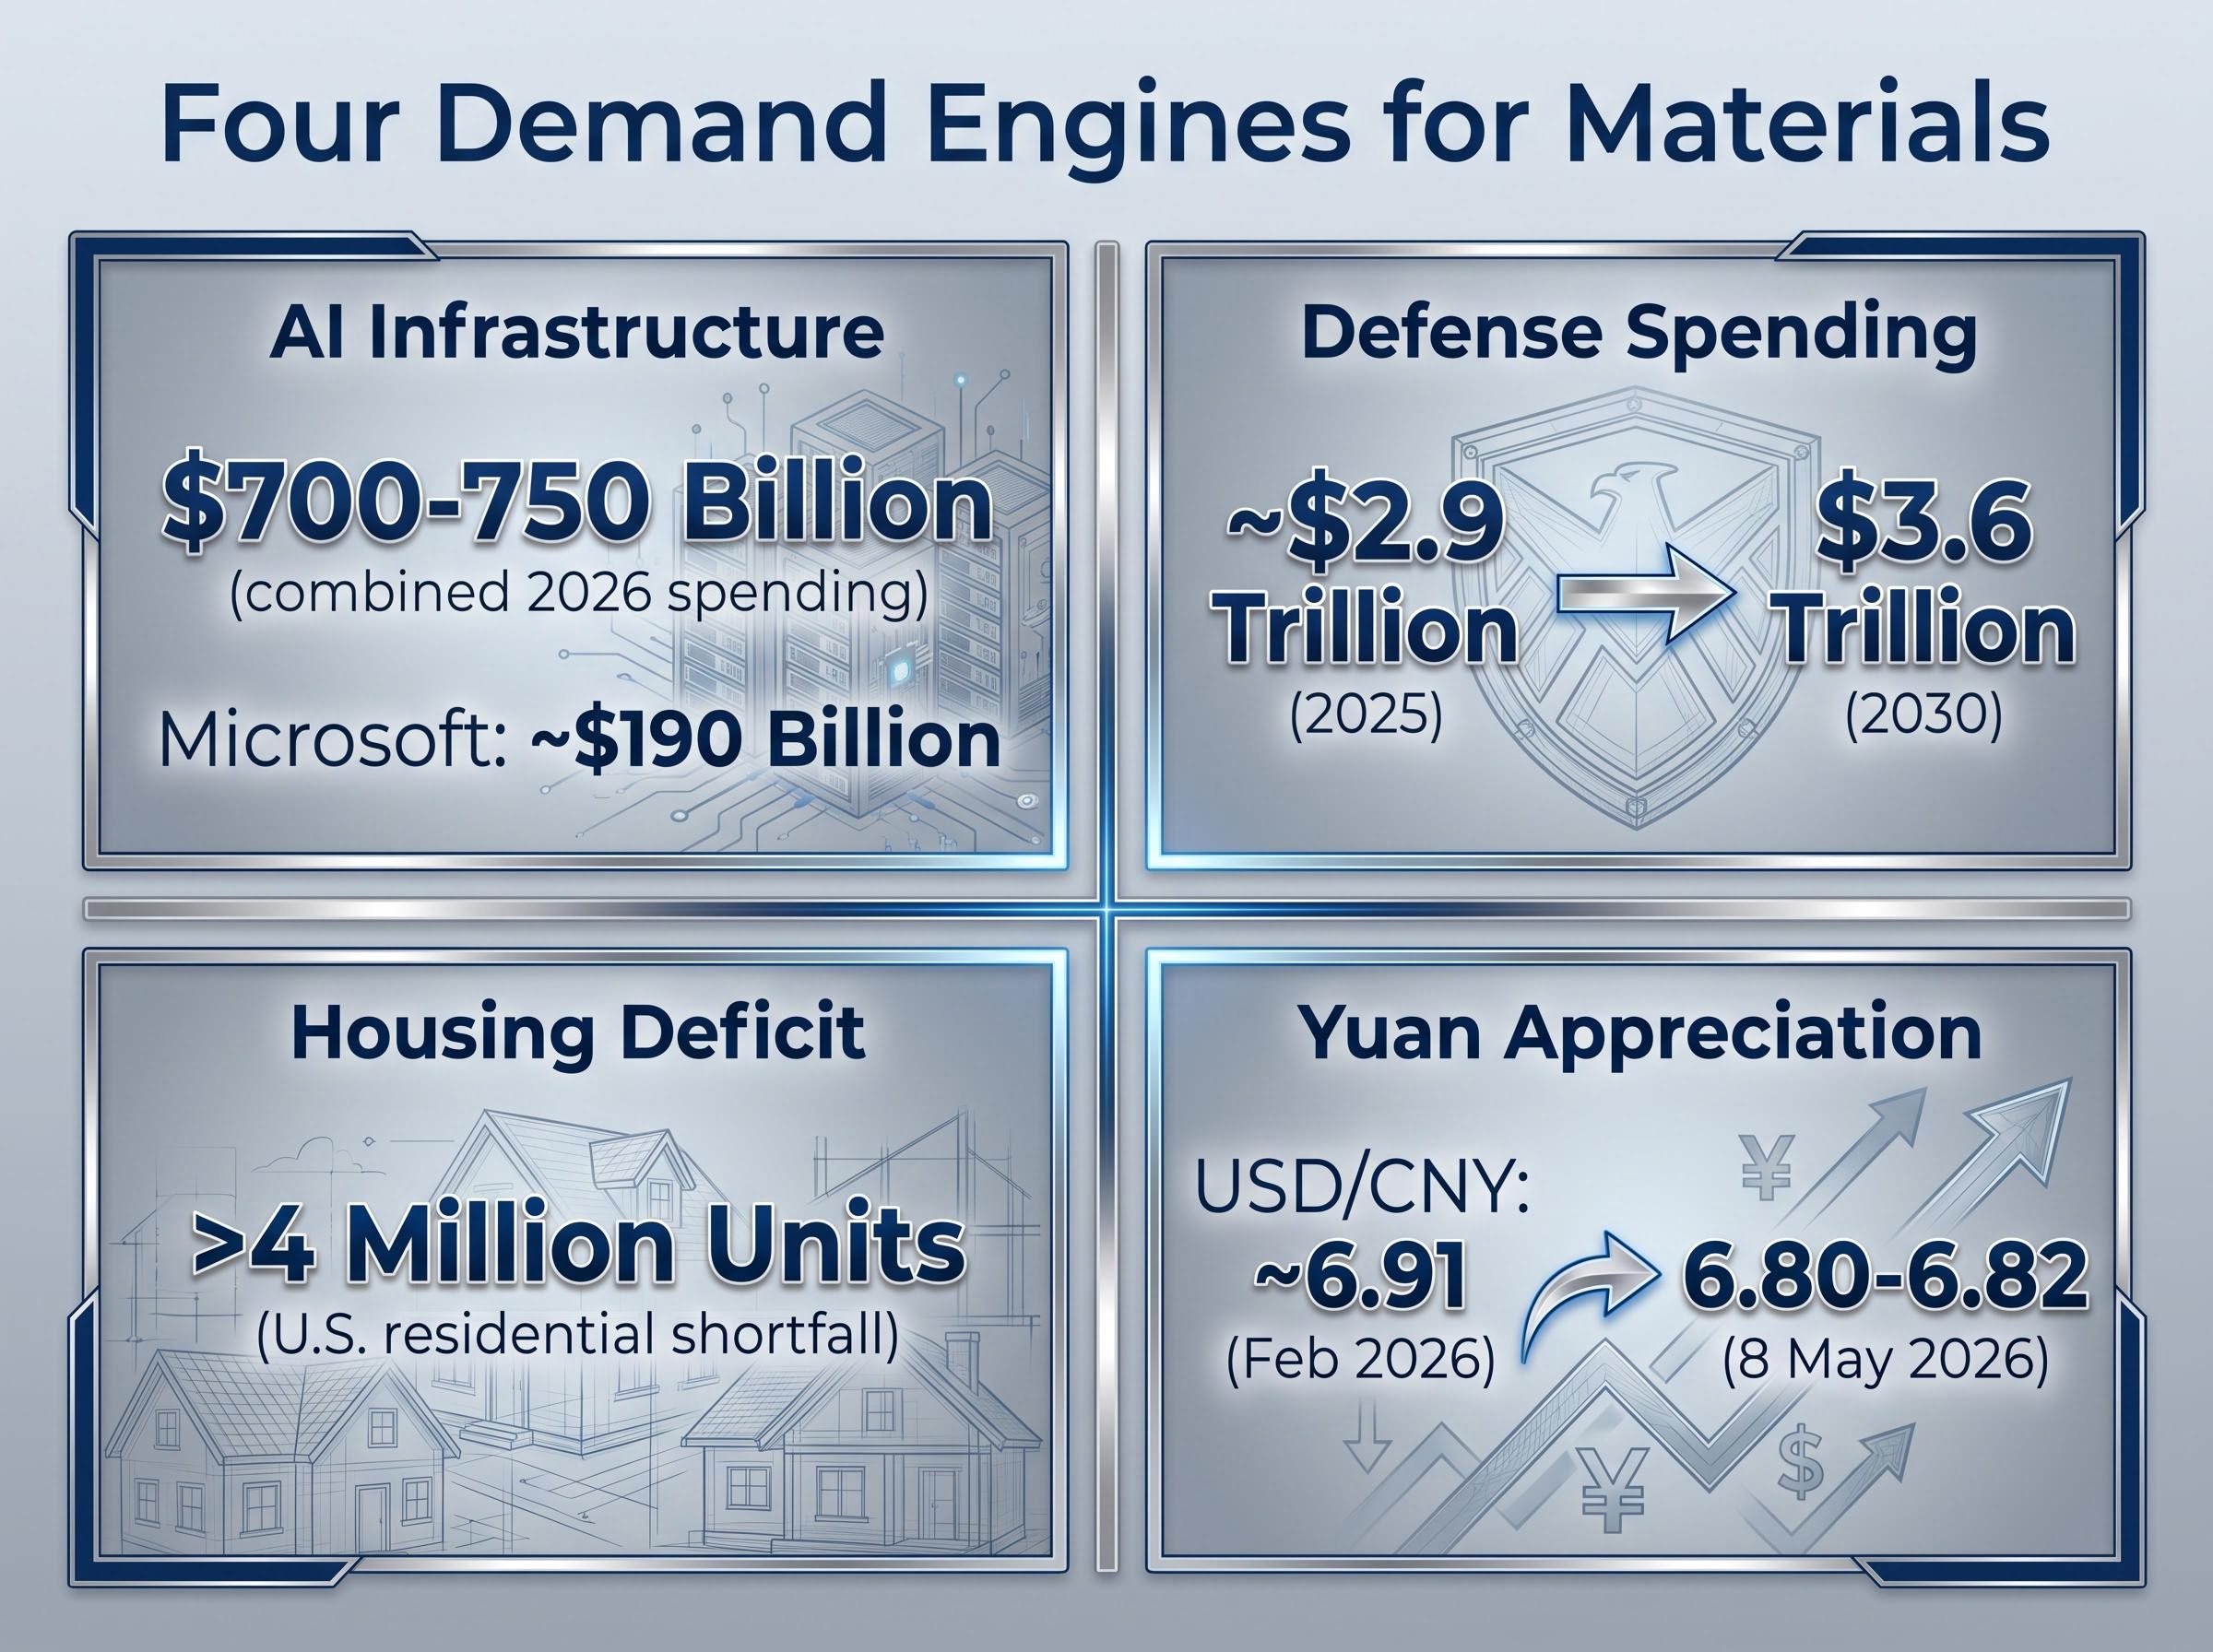
The materials sector has spent the better part of a decade fading from institutional attention. It now accounts for roughly 2% of S&P 500 market capitalisation, a near 30-year low that most portfolio managers treat as a reflection of structural irrelevance. Bank of America strategist Michael Hartnett reads it differently. In a framework published on 8 May 2026, Hartnett argued that four non-correlated demand forces, including $700-750 billion in hyperscaler AI infrastructure spending, accelerating global defence budgets, a domestic housing shortfall exceeding 4 million units, and a strengthening Chinese yuan, are converging on the single most neglected corner of the equity market. The XLB Materials Select Sector SPDR ETF has already returned 13.84% year-to-date as of 7 May 2026, yet institutional surveys continue to show bearish positioning. What follows is an unpacking of Hartnett’s full contrarian case: the demand catalysts behind copper and broader metals, the barbell portfolio logic that frames the trade, the macro backdrop that makes it legible, and the specific risks that could invalidate it before it plays out.
The starting point is not a forecast. It is a weight.
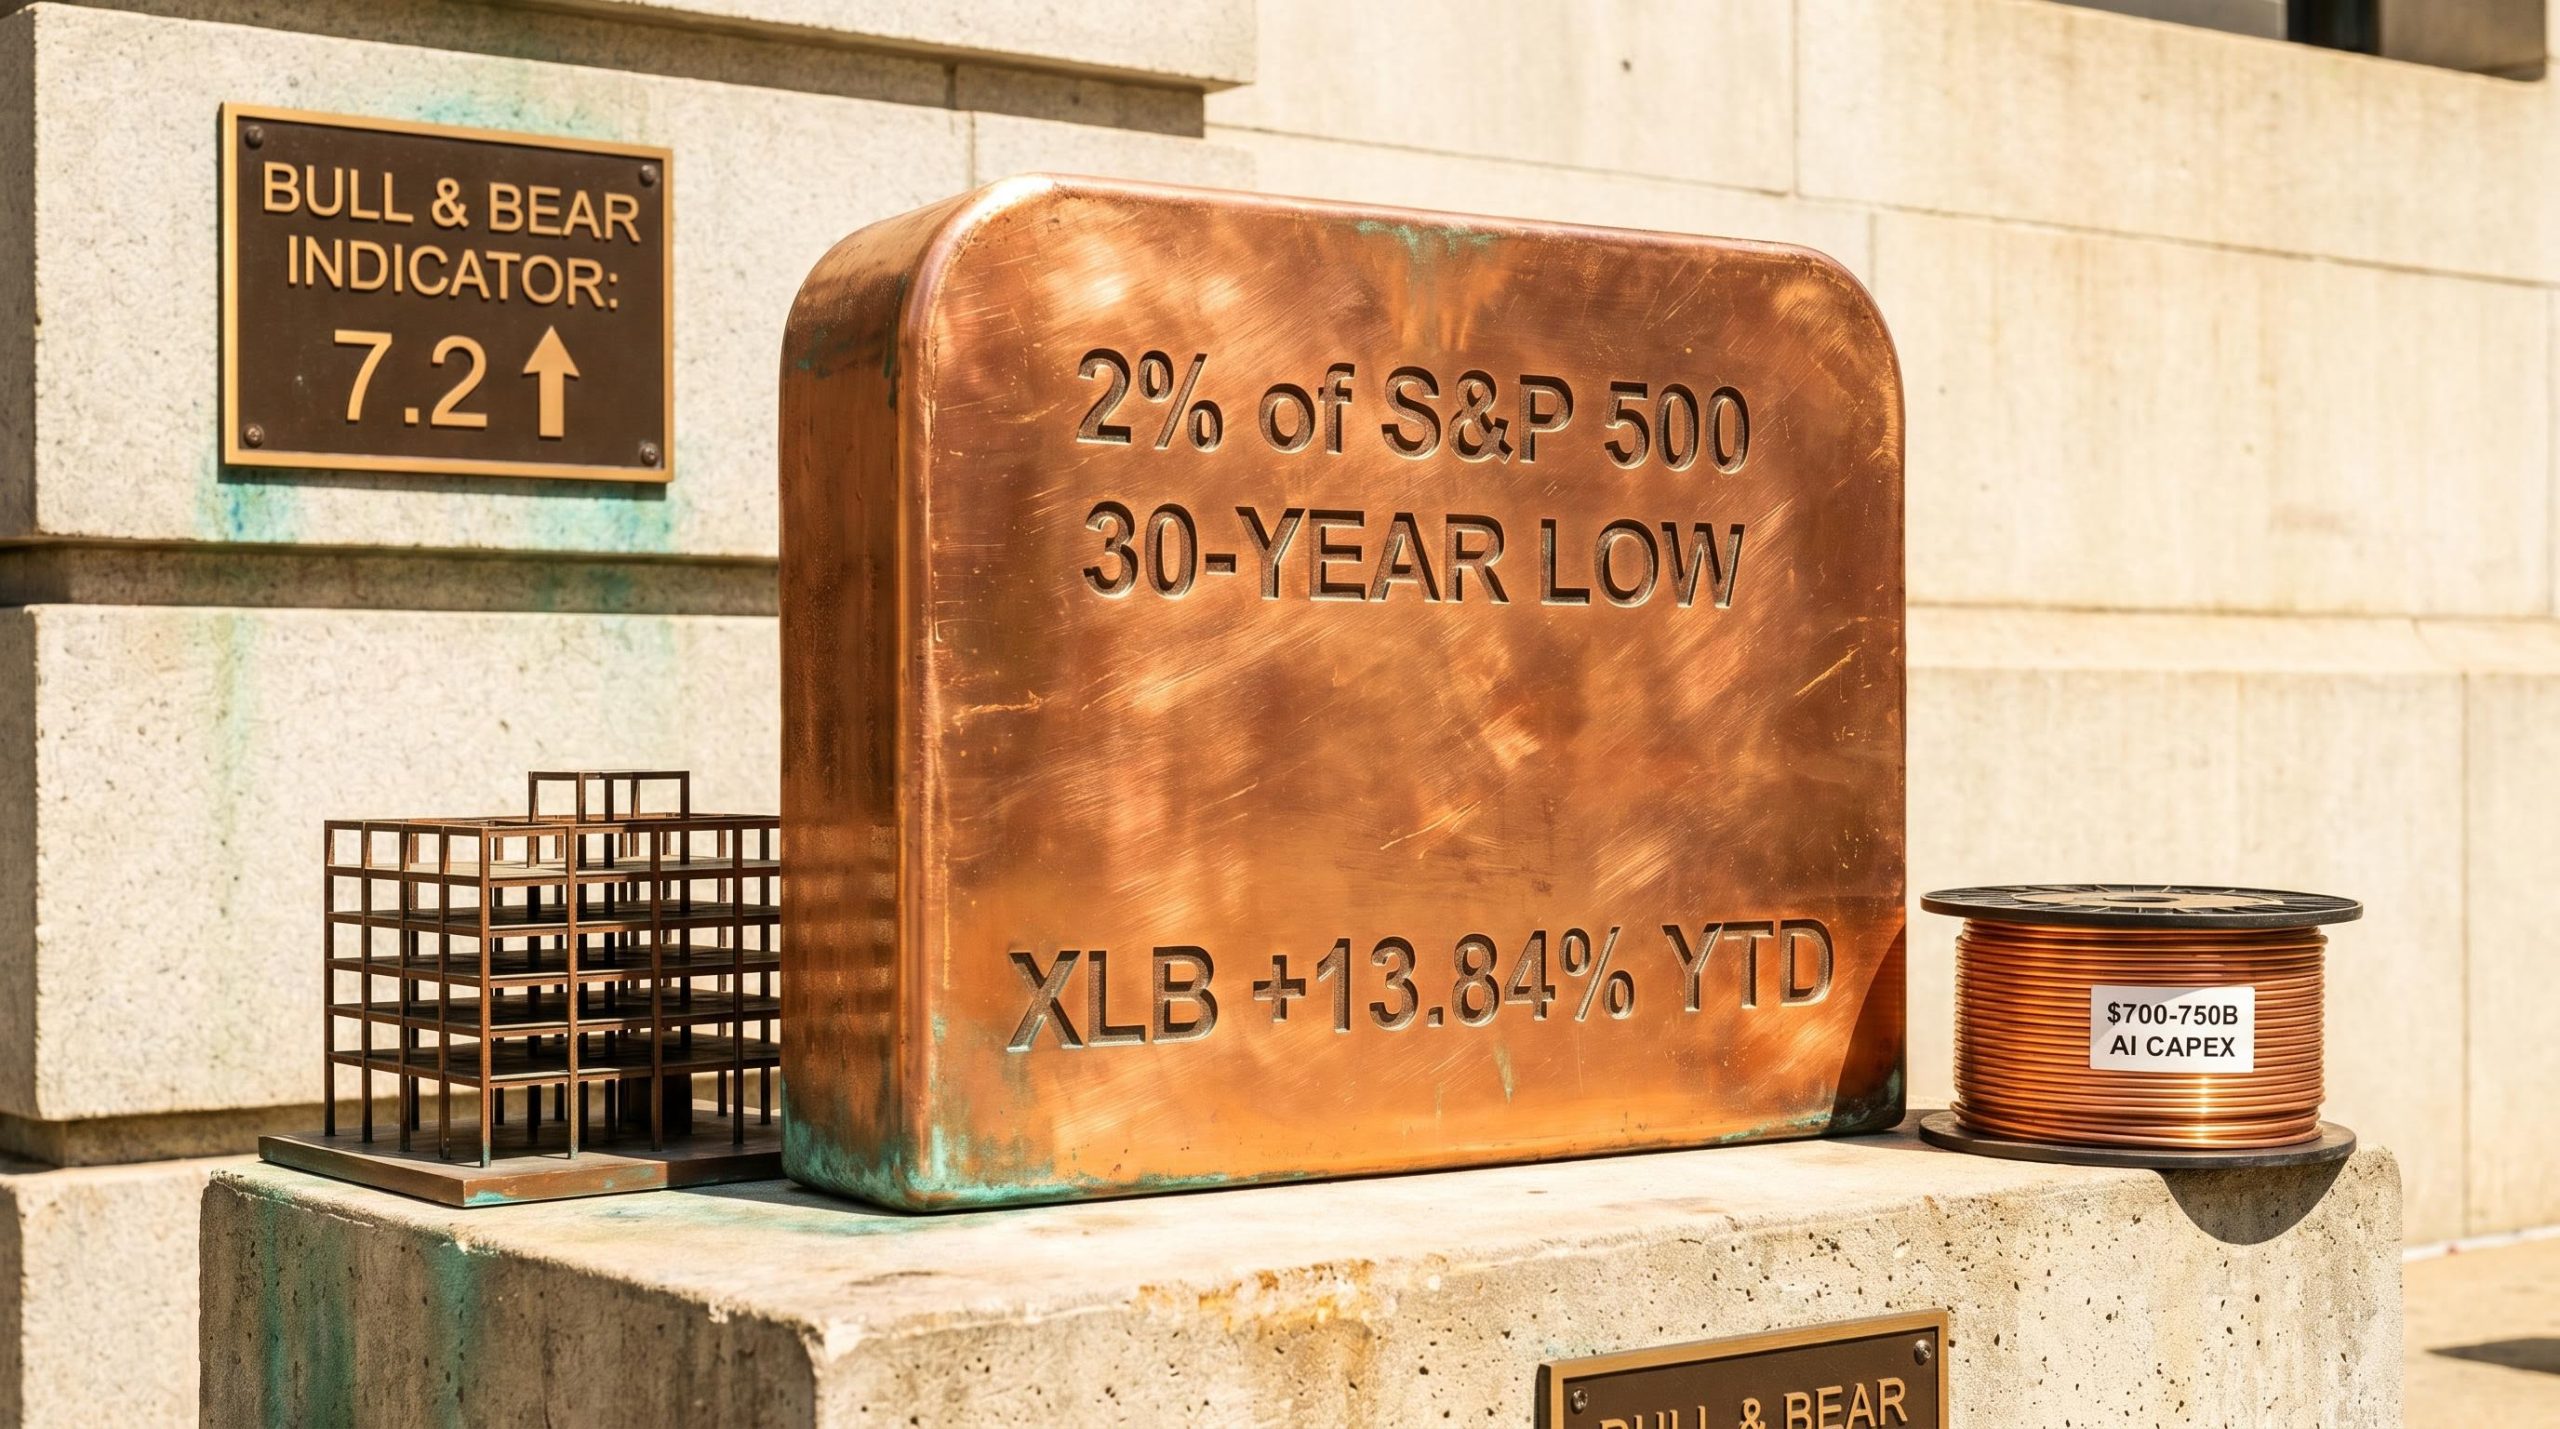
The materials sector accounts for approximately 2% of S&P 500 market capitalisation, its lowest share in nearly 30 years, according to Bank of America research.
That figure is what separates Hartnett’s thesis from a standard cyclical rotation call. A sector trading at multi-decade low representation is not merely cheap; it is structurally under-owned. For the weighting to have reached this level, active managers had to sell it down persistently across multiple cycles, meaning the current allocation reflects not a single misjudgement but a decade of compounding neglect.
Hartnett’s argument is explicitly anti-consensus. BofA’s own survey data shows bearish manager sentiment toward materials, which he interprets not as a fundamental warning but as a contrarian buy signal. The XLB has delivered 13.84% year-to-date as of 7 May 2026, yet fund manager positioning has barely shifted.
The BofA Bull and Bear Indicator sits at 7.2, up from 6.6, but still below the 8.0 threshold that historically triggers a sell signal. The trade, in Hartnett’s reading, has room to run before crowding becomes a concern.
Hartnett’s operative principle is concise: watch the flow, not the forecast. U.S. equity funds recorded six consecutive weeks of net inflows through early May, with $9.3 billion entering in the most recent week. Global equity funds added $10.82 billion over the same period.
Portfolio managers’ verbal caution is not reflected in where capital is actually moving. That divergence, between what managers say and what their allocations reveal, is precisely the setup Hartnett flags as preceding mean-reversion trades in structurally underweight sectors.
The question behind any contrarian thesis is whether the neglect is deserved. Hartnett’s answer rests on four distinct demand drivers that happen to converge on the same sector without depending on the same narrative.
| Driver | Specific Catalyst | Key Data Point | Materials Linkage |
|---|---|---|---|
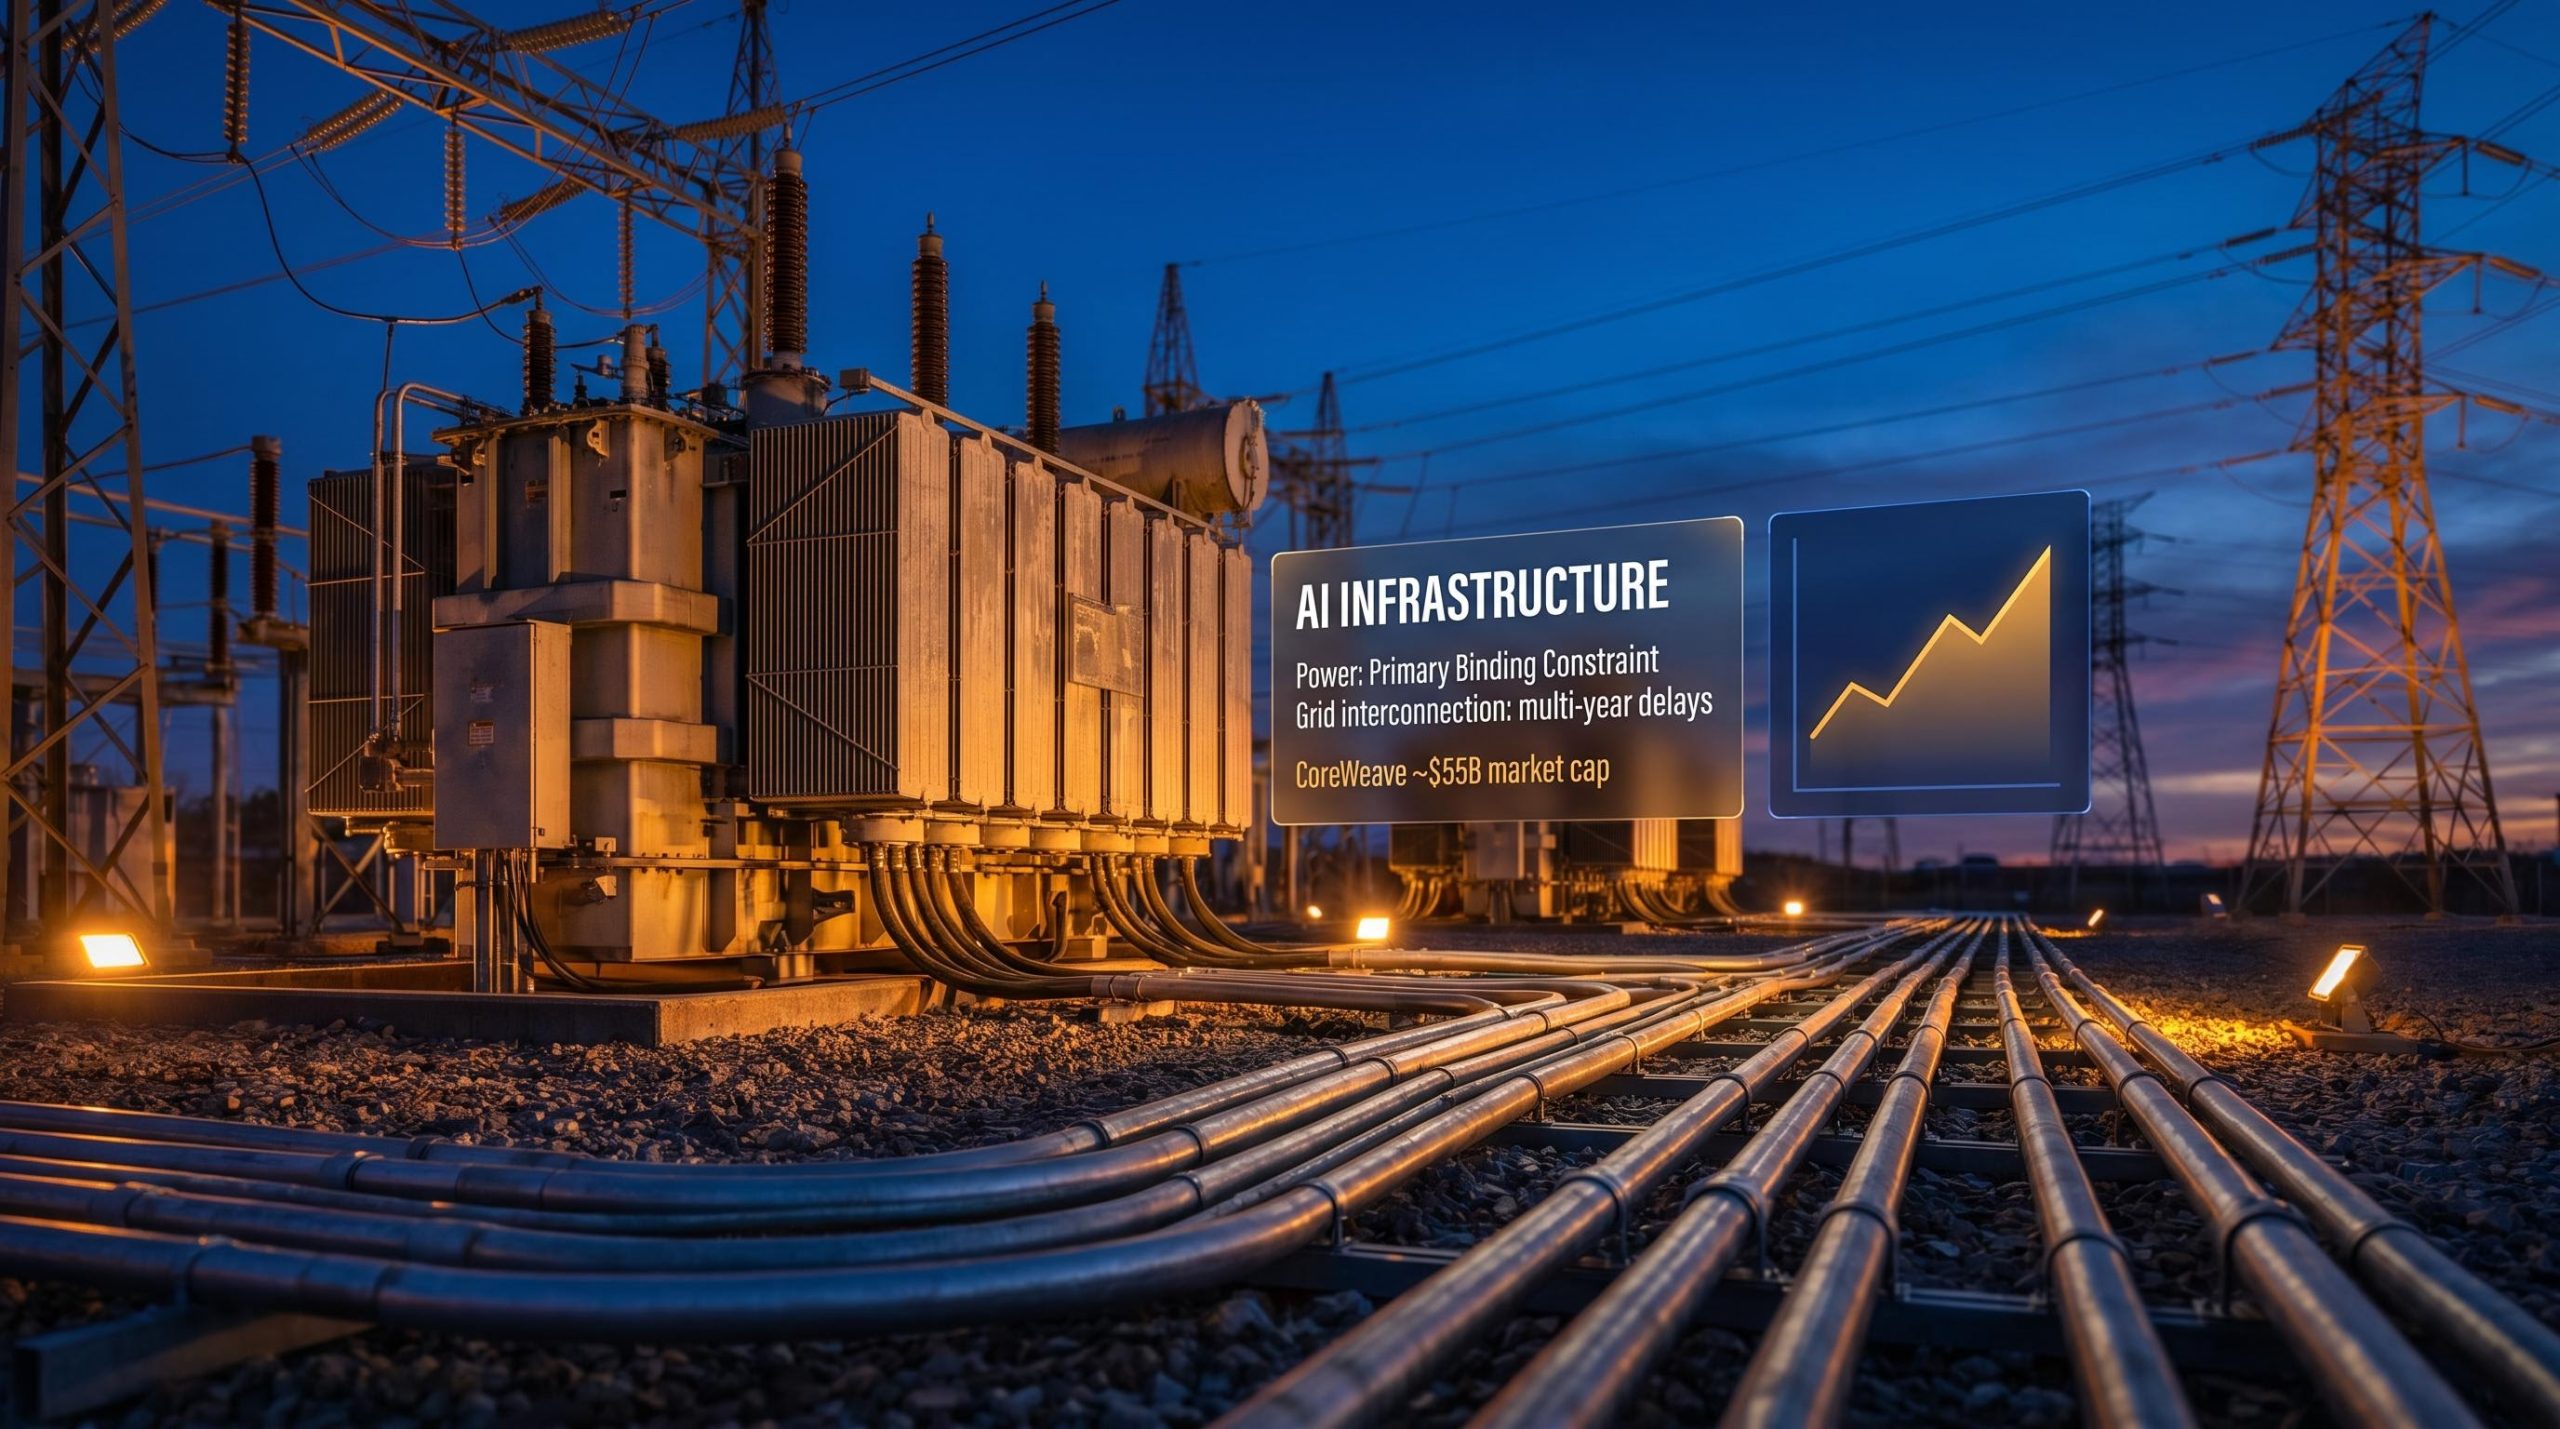
| AI Infrastructure | Hyperscaler capex acceleration | $700-750 billion combined 2026 spending; Microsoft guiding ~$190 billion | Data centre construction, copper wiring, steel structures, cooling systems |
| Defence Spending | Post-Ukraine, Taiwan Strait military build-out | ~$2.9 trillion global military expenditure in 2025 (SIPRI); trajectory toward $3.6 trillion by 2030 | Steel, aluminium, copper, and specialty metals for weapons systems and base infrastructure |
| Housing Deficit | U.S. residential supply shortfall | Deficit exceeding 4 million units | Lumber, copper piping, steel framing, concrete inputs |
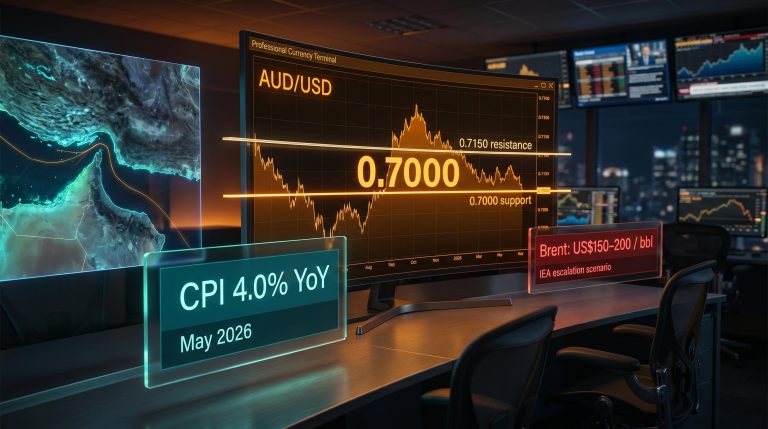
| Yuan Appreciation | Chinese demand recovery signal | USD/CNY at 6.80-6.82 (8 May 2026), down from ~6.91 in February | Currency tailwind for dollar-priced commodities; Chinese industrial demand recovery |
The non-correlation of these drivers is the analytical point. AI infrastructure spending is a technology-driven capital cycle. Defence budgets are geopolitically driven. The housing deficit is a domestic supply-side failure. Yuan appreciation reflects Chinese monetary and trade dynamics. No single catalyst needs to remain intact for the materials thesis to hold; the convergence is the margin of safety.
Approximately 75% of the $700 billion in hyperscaler capital expenditure is directed toward physical hardware and data centre construction, meaning the copper wiring, steel structures, and cooling infrastructure embedded in every facility represent a demand channel that scales with each quarterly capex update from Microsoft, Alphabet, Amazon, and Meta.
SIPRI’s 2025 military expenditure data confirms global defence spending reached approximately $2.9 trillion that year, with the decade-long upward trajectory pointing toward $3.6 trillion by 2030, a demand curve that feeds directly into steel, aluminium, copper, and specialty metals procurement across allied-nation defence programmes.
The yuan mechanics deserve specific attention:
Copper faces a projected 2026 supply deficit of approximately 1 million metric tonnes, according to industry estimates, a structural gap that three converging demand sources are widening rather than closing.
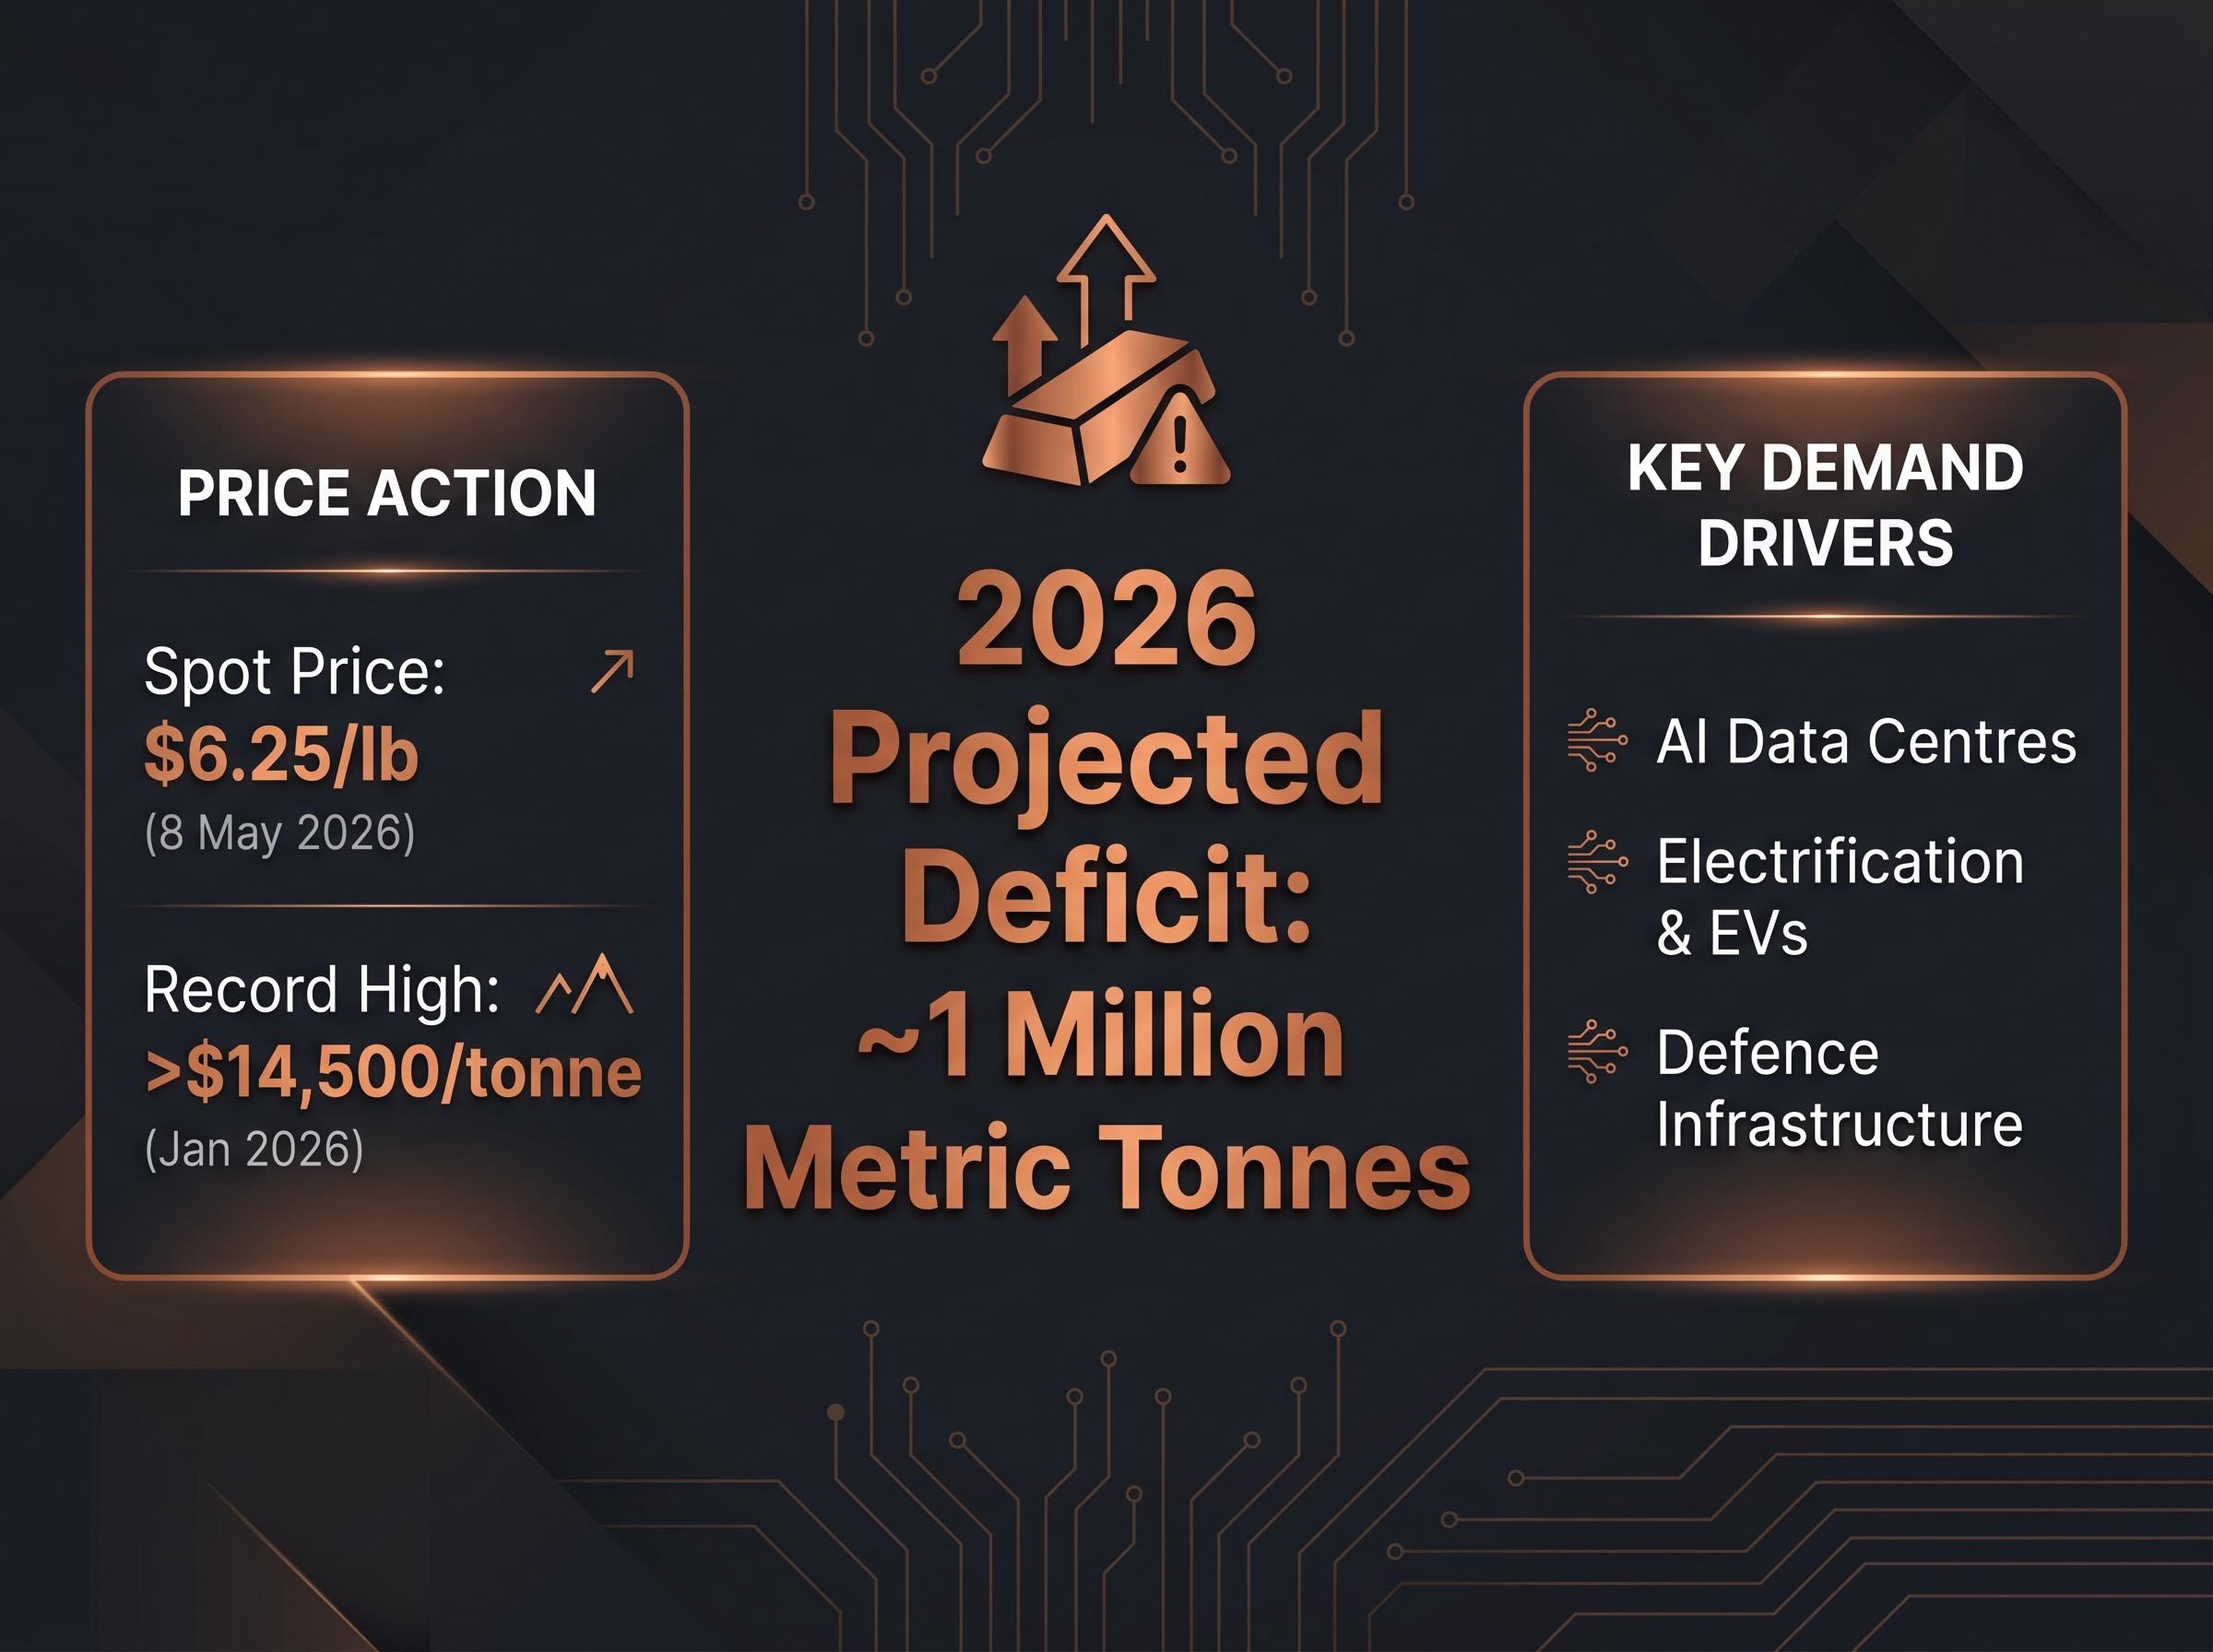
That deficit anchors Hartnett’s copper case. At a spot price of $6.25 per pound as of 8 May 2026, with a record high above $14,500 per tonne reached in January 2026, the metal’s price behaviour reflects tightness that is already being felt, not merely projected.
The three demand sources that make the deficit structural rather than cyclical each stand independently:
AI data centre power demand is projected to reach 9% of U.S. domestic electricity consumption by 2030, up from 4% in 2023, and the copper-intensive grid expansion required to deliver that electricity to facilities operated by Microsoft, Alphabet, and Amazon represents a demand channel that runs parallel to the direct copper content of the facilities themselves.
On the supply side, the International Energy Agency (IEA) flagged in March 2026 that smelters face mounting strategic pressures, a supply-side constraint that reinforces the deficit thesis rather than resolving it. Copper is not merely a component of the materials outlook; it is its most quantifiable expression.
Hartnett’s materials call does not exist as an isolated sector bet. It sits within a barbell construction: long AI and semiconductor leaders on one side, long deeply undervalued cyclical assets on the other. Materials, consumer, China, and UK equities populate the undervalued end. Distressed bonds are explicitly excluded, which narrows the field and increases the signal value of each inclusion.
The Four C Trades (BofA Flow Show, 11 April 2026): Curve steepeners, Commodities, China, Consumer. Each trade reinforces the others within a nominal GDP expansion framework.
The economic logic binding both sides of the barbell is nominal GDP growth. U.S. nominal GDP is estimated to have grown approximately 75% from 2020 to projected 2027, with 2026 consensus growth at approximately 5.5% and S&P 500 earnings per share growth consensus at approximately 20%. Technology leaders benefit from this through earnings growth. Cyclical assets benefit through demand recovery and asset reflation. The barbell pairs two different transmission mechanisms of the same macro force.
For vehicle selection, Hartnett cites the SPDR S&P Metals and Mining ETF (XME) as the preferred expression over the broader XLB, reflecting a preference for purer commodity exposure.
| ETF Ticker | Focus | Hartnett Preference | YTD Context | Rationale for Inclusion |
|---|---|---|---|---|
| XME | Metals and mining equities | Preferred vehicle | Purer commodity beta | Direct exposure to copper, steel, and mining producers; less diluted by chemicals and packaging |
| XLB | Broad materials sector | Sector benchmark | 13.84% YTD (7 May 2026) | Broader diversification across materials sub-industries; mainstream sector proxy |
Resource nationalism further shapes the geographic dimension. Hartnett’s framework favours allied-nation supply chains, positioning Canada, the United States, and Australia as beneficiary geographies where domestic extraction and processing are being incentivised by policy.
The variable that makes Hartnett’s full framework legible is nominal GDP growth, a concept that many investors overlook in favour of real (inflation-adjusted) growth figures. The distinction matters.
U.S. nominal GDP is estimated to have expanded approximately 75% from 2020 to projected 2027. For 2026, consensus nominal growth sits at approximately 5.5%. That environment lifts the revenue line for commodity producers through two simultaneous channels, which is why Hartnett’s Four C Trades include curve steepeners (the bond market’s own validation of the nominal growth environment) alongside direct commodity exposure.
The business fixed investment surge of 10.4% annualised in Q1 2026, the fastest pace since Q2 2023, driven by a 43.4% jump in information processing equipment and 22.6% growth in software, is the GDP-level confirmation that AI infrastructure capex is translating into real capital flows rather than remaining a forward-looking projection.
The dual mechanism is straightforward. Rising real demand (from AI infrastructure, defence, housing, and Chinese recovery) increases the volume of materials consumed. Rising price levels (the inflation component of nominal GDP) increase the dollar value per unit of output. Commodity producers capture both.
This dynamic is structurally different from how nominal growth affects, for example, consumer staples firms, which face higher input costs on the same mechanism that lifts commodity revenues. The asymmetry is what makes materials the favoured sector in a nominal expansion, and it is the reason Hartnett’s thesis rests on nominal rather than real growth as the relevant variable.
A contrarian thesis without articulated invalidation conditions is speculation. Three risks, in descending order of near-term immediacy, could prevent the materials trade from reaching its potential.
The BofA Bull and Bear Indicator reads 7.2, elevated but below the 8.0 sell-signal threshold. The gap between current positioning and the crowding-in danger zone suggests the trade still has room, but the indicator’s trajectory warrants monitoring as the primary timing signal.
Each of these risks is observable in real time. That is the difference between a thesis with exit discipline and one without it.
Hartnett’s materials thesis is not a momentum call. It is a mean-reversion and macro-alignment case built on verifiable inputs: a 30-year valuation low in sector weighting, four non-correlated demand tailwinds, a 1 million metric tonne copper supply deficit, and a contrarian sentiment setup where flows contradict surveys.
The three live signals most likely to confirm or deny the timeline are the Bull and Bear Indicator’s approach toward 8.0, the USD/CNY trajectory (currently 6.80-6.82), and the pace at which hyperscaler capex translates into physical materials demand.
Investors evaluating the thesis may consider assessing their current cyclical and materials allocation relative to the S&P 500’s 2% benchmark weighting, and how vehicles such as XME and XLB could fit within a barbell construction alongside existing technology exposure.
Precious metals positioning sits adjacent to the industrial metals thesis: gold’s structural bid from central bank accumulation projected at 750-850 tonnes in 2026 and Federal Reserve rate reductions create a commodity tailwind that is correlated with but distinct from copper’s supply-deficit dynamic, offering investors a way to diversify commodity exposure within the same macro backdrop.
This article is for informational purposes only and should not be considered financial advice. Investors should conduct their own research and consult with financial professionals before making investment decisions. Past performance does not guarantee future results. Financial projections are subject to market conditions and various risk factors.
Bank of America strategist Michael Hartnett argues the materials sector is at a near 30-year low in S&P 500 weighting at roughly 2%, creating a contrarian opportunity driven by four converging demand forces: AI infrastructure spending, rising defence budgets, a U.S. housing deficit exceeding 4 million units, and yuan appreciation signalling Chinese demand recovery.
Copper faces a projected 2026 supply deficit of approximately 1 million metric tonnes, while three simultaneous demand drivers, including AI data centre construction, electrification and EV production, and defence infrastructure, are widening that gap; spot copper was priced at $6.25 per pound as of 8 May 2026.
Hartnett identifies the SPDR S&P Metals and Mining ETF (XME) as his preferred vehicle for purer commodity beta, while the XLB Materials Select Sector SPDR ETF serves as the broader sector benchmark, having returned 13.84% year-to-date as of 7 May 2026.
The three primary risks are a potential NYSE double-peak formation that could drag cyclical sectors lower, developed market central bank rate hikes tightening financial conditions faster than the reflation narrative supports, and fragile fund flows evidenced by approximately $136 billion moving into cash funds in a single week and six consecutive weeks of China-focused equity outflows totalling roughly $47.5 billion.
Commodity producers benefit from nominal GDP expansion through two simultaneous channels: rising real demand increases the volume of materials consumed, while the inflation component of nominal growth increases the dollar value per unit of output, an asymmetry that Hartnett identifies as the core reason materials are favoured in a nominal expansion environment.