How to Value a Stock When the Future Isn’t in the Financials
just now

When two professional analysts look at the same company and produce price targets of $130 and $600 respectively, the gap is not a mistake. It is the entire lesson.
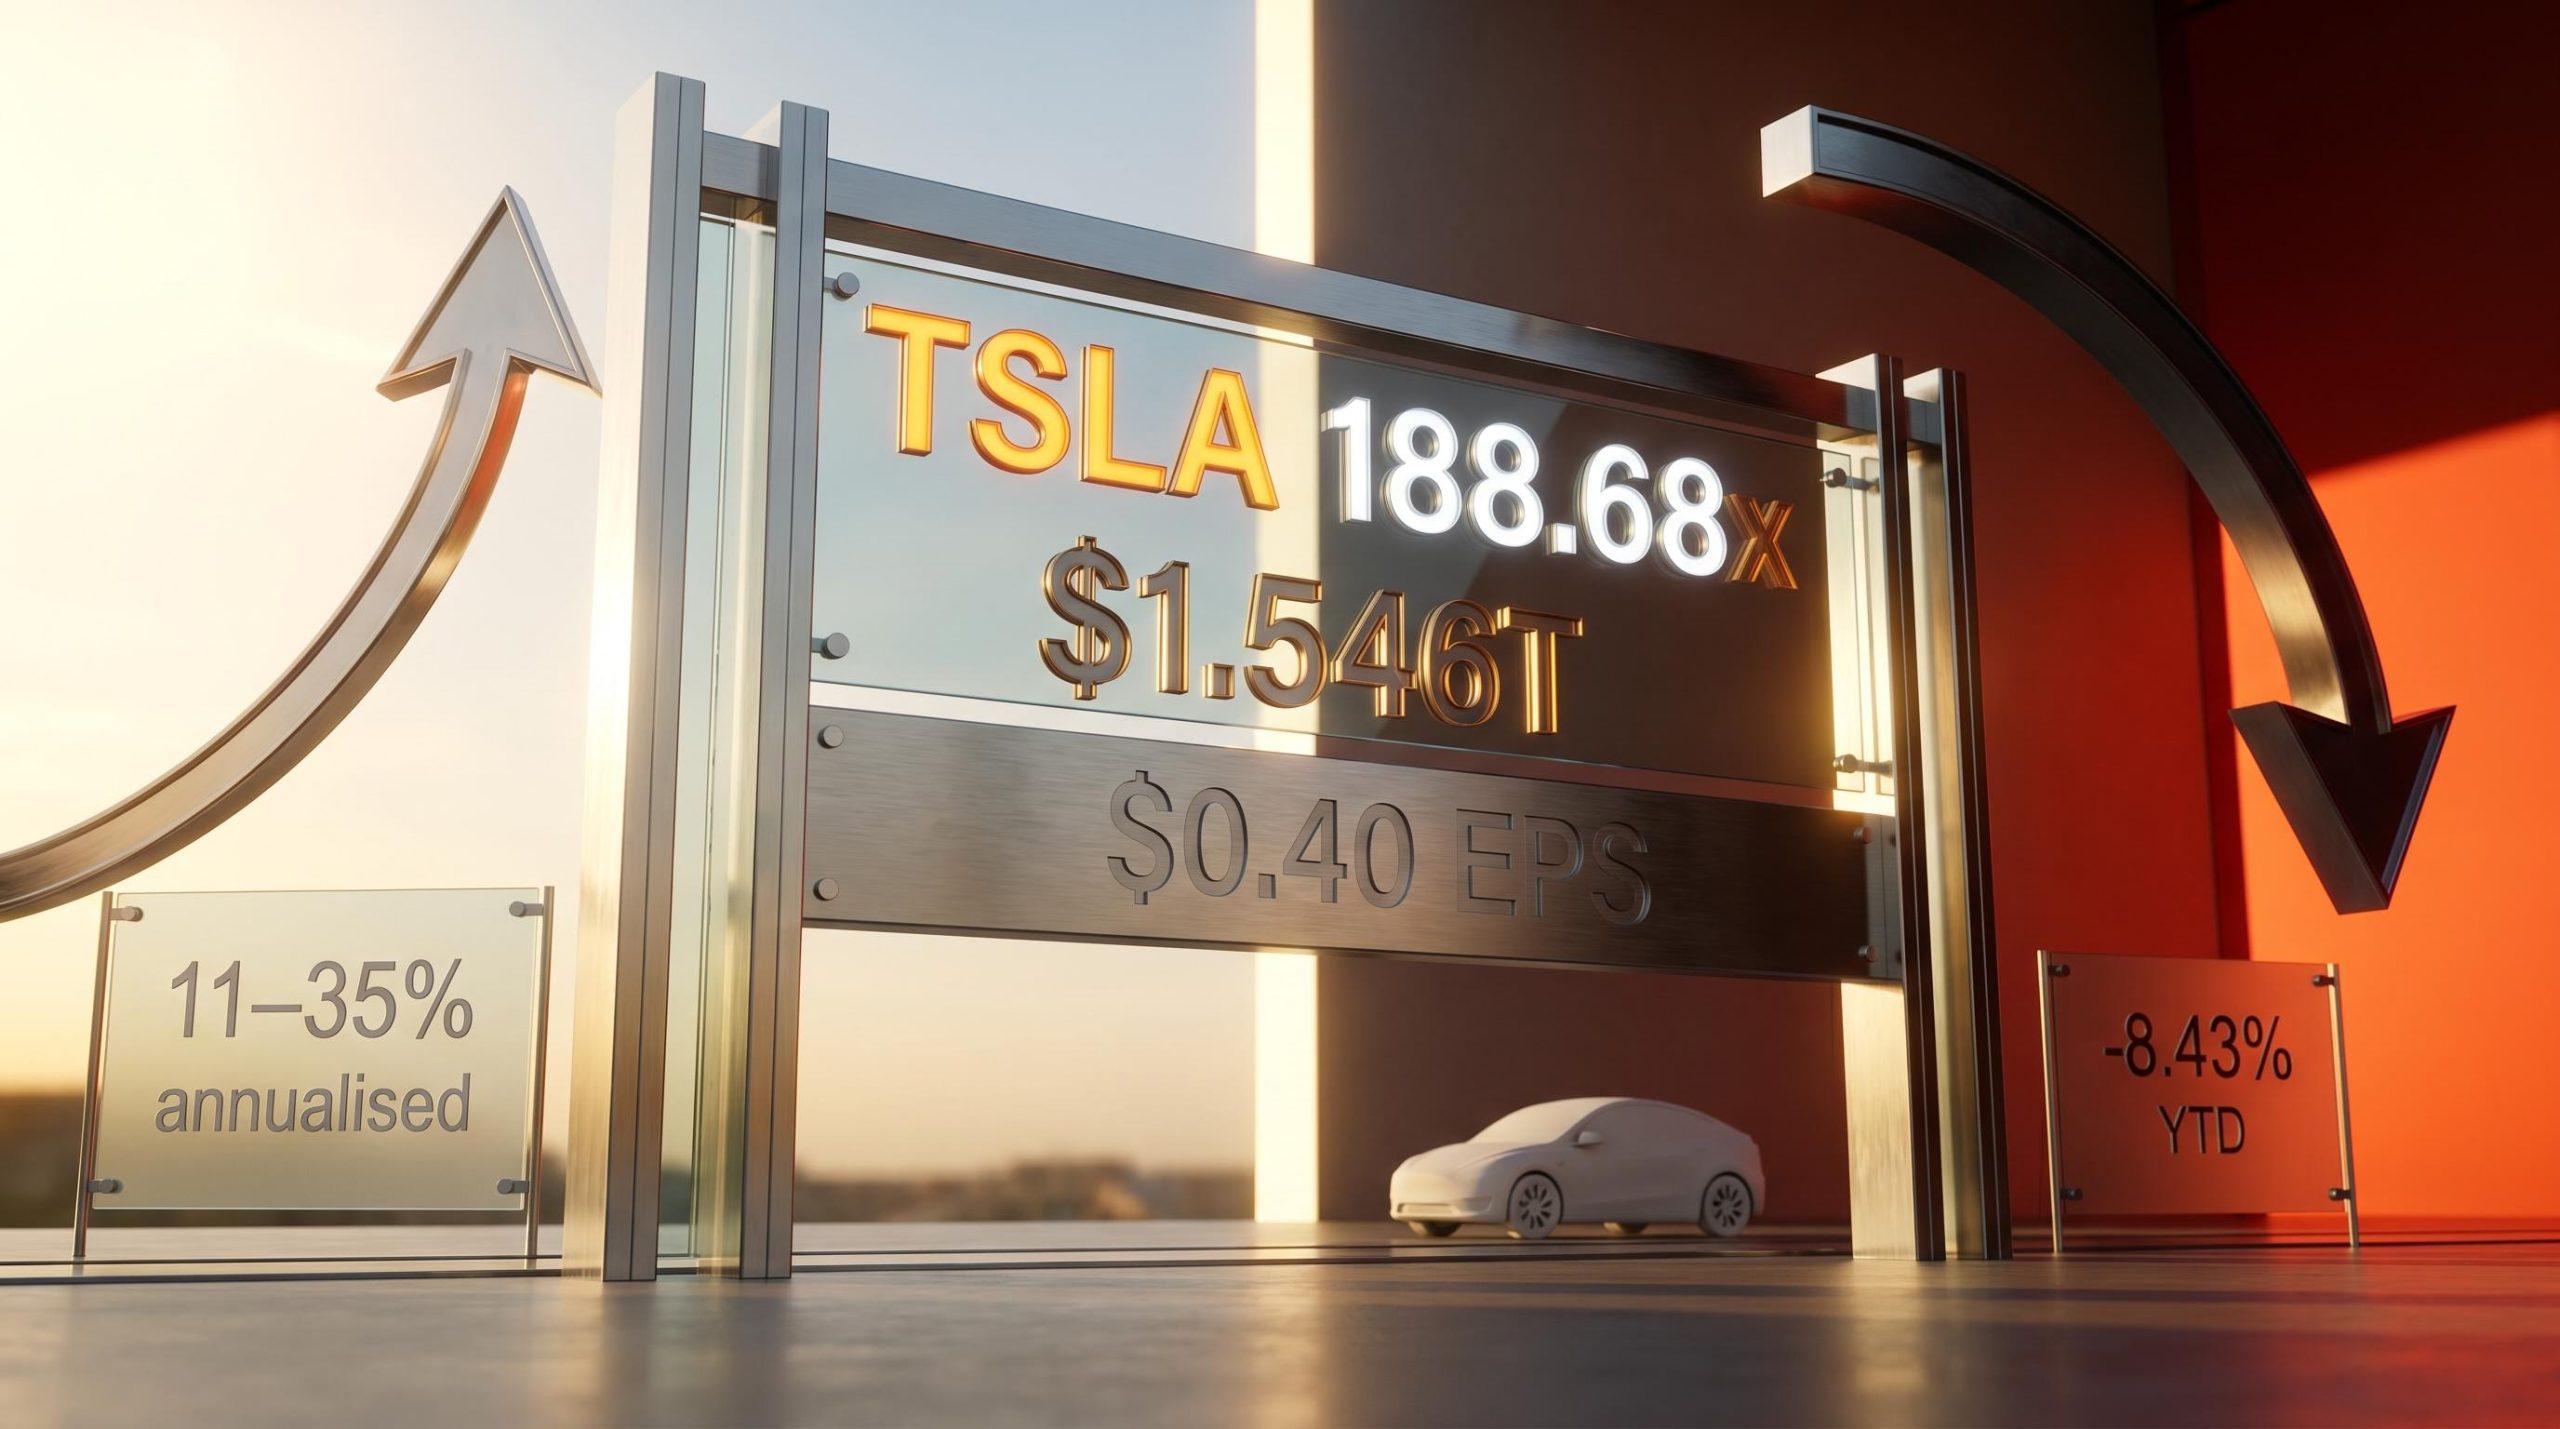
Tesla’s stock sits at $411.12 as of 8 May 2026, carrying a price-to-earnings ratio of approximately 317x. That number is not a valuation in the traditional sense. It is a statement about what investors believe Tesla will become. For anyone learning how to assess a company’s worth, the tension between what a business earns today and what it might earn in five to ten years is the single most important concept in equity analysis. Tesla right now is a near-perfect teaching case.
This guide uses Tesla’s Q1 2026 valuation as a live case study to walk through how professional investors construct bull and bear scenarios, how assumptions about growth and margins produce radically different return outcomes, and why the price paid at entry is one of the most consequential decisions any investor makes. The methodology applies to any company in transformation, not just Tesla.
A price-to-earnings (P/E) ratio of 317x would disqualify virtually any stock in a traditional screen. Automotive sector peers typically trade between 8x and 15x earnings. Software and SaaS companies at their most richly valued might reach 40x-60x. Tesla sits above both, and the question for any investor encountering this for the first time is straightforward: is the metric broken, or is it measuring something different?
The answer is the latter. Tesla reported Q1 2026 adjusted earnings per share of approximately $0.40, above the $0.35 consensus estimate, on revenue of $22.4 billion (16% year-on-year growth). Both figures beat forecasts. Yet even at those improved numbers, the auto-only earnings would never justify $411.12 per share by any conventional automotive valuation framework.
| Sector | Typical P/E Range | Tesla’s Current P/E |
|---|---|---|
| Traditional Automotive | 8x-15x | ~317x |
| Software / SaaS | 30x-60x | ~317x |
The disparity raises a question that sits at the heart of stock valuation analysis: which sector is the market treating Tesla as? The answer, for investors willing to look past the headline number, is neither.
The dividend discount model, which values a stock as the present value of its future dividend stream, illustrates exactly why traditional income-based frameworks cannot anchor Tesla’s price: a company generating most of its projected value from unproven future segments produces no stable dividend yield for the model to discount.
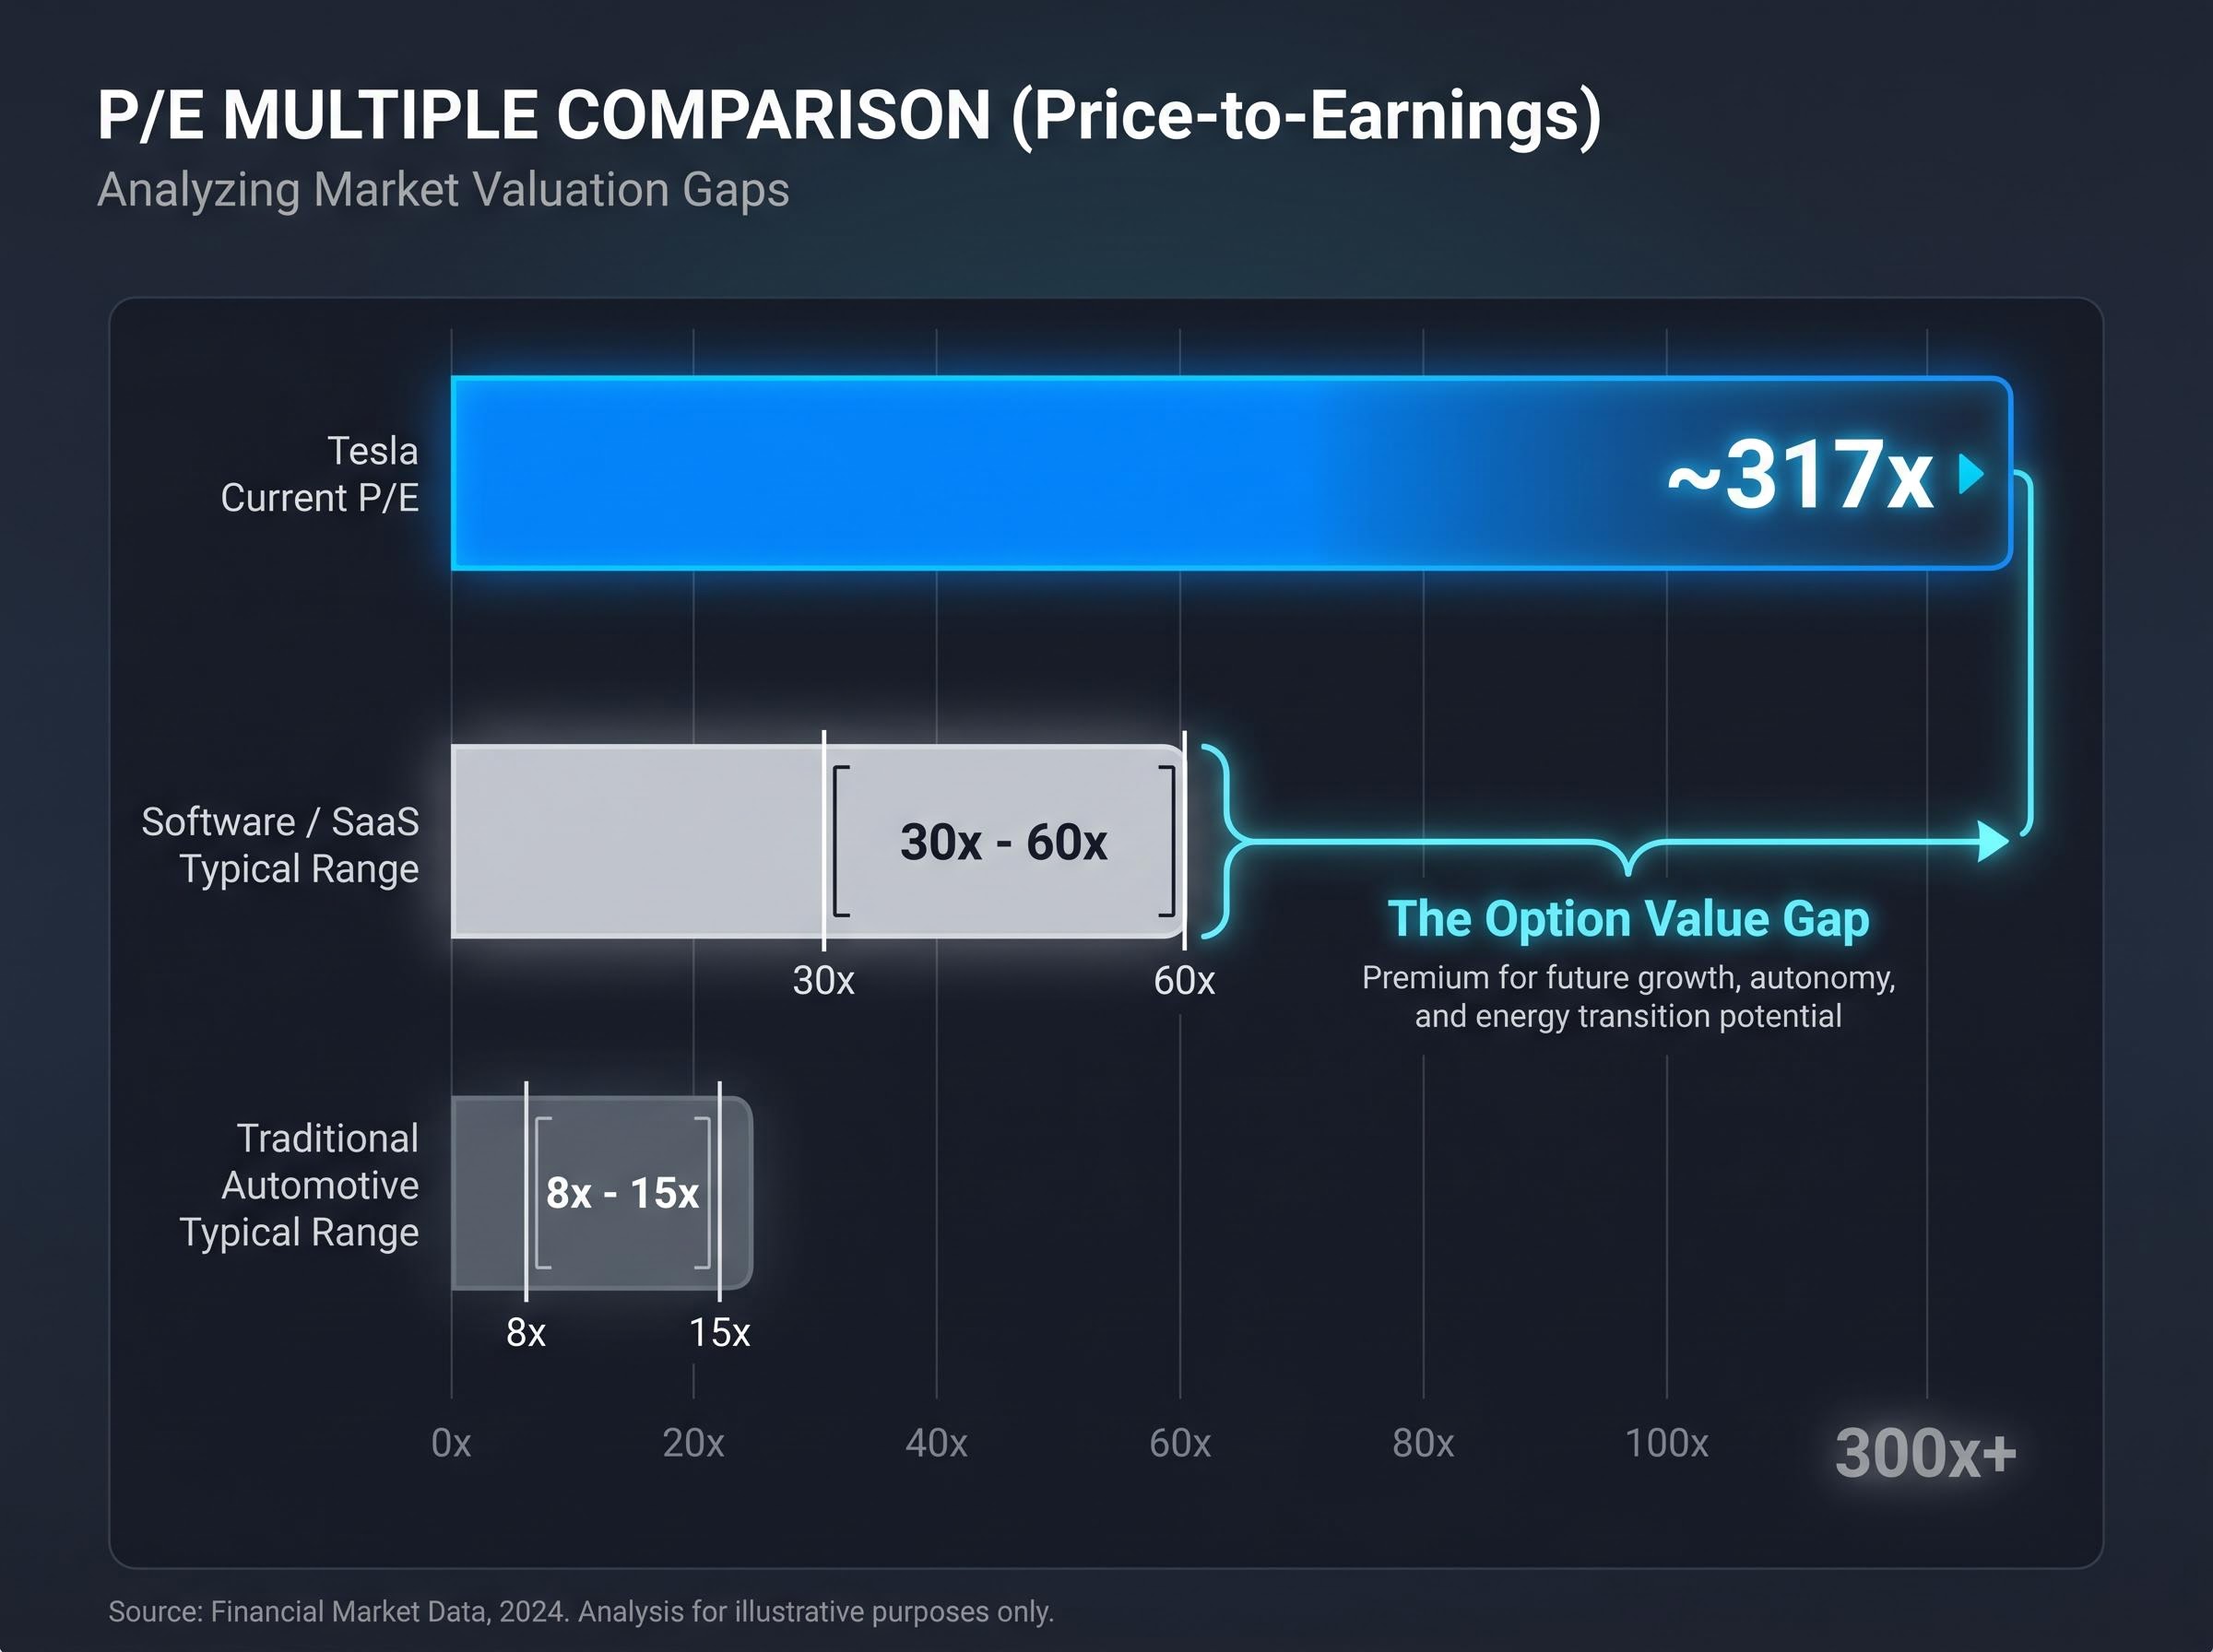
The gap between Tesla’s auto-sector earnings and its market price represents what professionals call option value. In plain language, the market is paying today for revenue streams that do not yet exist but could be substantial: autonomous ride-hailing, humanoid robotics, and full self-driving software licensing.
This is distinct from speculative gambling. Option value can be evaluated through probability-weighted scenario analysis, where each potential revenue stream is assigned both a projected value and a likelihood of materialising. The discipline lies in making those assumptions explicit rather than accepting the market’s pricing uncritically.
Scenario analysis is not a guessing exercise. It is a structured discipline with specific inputs that must be defined before opening a spreadsheet. The framework rests on three scenarios: bull, base, and bear. Each one represents a plausible future state for the company, defined not by optimism or pessimism, but by explicit assumptions about three variables.
These three inputs, applied consistently across scenarios, produce the range of outcomes. They are sequential and interdependent: a higher growth rate paired with compressed margins and a lower multiple can produce the same result as moderate growth with expanding margins and a premium multiple. The framework forces that interaction into the open.
The multiple-scenario DCF valuation methodology distinguishes between three formal variants: scenario-based DCF, decision tree analysis DCF, and stochastic-simulation DCF, each suited to different levels of uncertainty about future business mix and providing the theoretical foundation that practitioners apply when valuing companies whose earnings are dominated by unproven revenue streams.
Same company, different assumptions: Wells Fargo’s $130 target (Underweight, set January 2026) and New Street Research’s $600 target (Overweight, assigned in the weeks preceding early May 2026) reflect the same Tesla financial data filtered through radically different scenario inputs. The $470 spread is not confusion. It is the width of legitimate analytical disagreement.
That width is itself informative. A narrow analyst target range signals consensus on what a business is worth. A spread this wide signals that the market has not resolved which version of the company’s future to price, and that uncertainty is a risk signal independent of which scenario any individual investor favours.
The bear case strips Tesla down to what it demonstrably is today: a premium electric vehicle manufacturer with an adjacent energy business. It assigns no material value to Optimus, Cyber Cab, or FSD licensing revenue. The question it asks is simple: if only the proven business counts, what is a share worth?
The inputs are specific:
| Bear Case Input | Assumed Range |
|---|---|
| Revenue Growth Rate | 6%-12% (midpoint ~9%) |
| Net Profit Margin | 8%-14% |
| Valuation Multiple | 18x-22x earnings |
| 10-Year Return Outcome | Negative across all scenarios |
At an entry price in the range of $375-$411 per share, every combination of bear case assumptions produces negative projected returns over a 10-year horizon. That result lands even though Tesla beat Q1 earnings estimates and posted 16% revenue growth.
The competitive pressures underpinning this thesis are concrete. Chinese EV manufacturers, led by BYD, continue to exert structural erosion pressure on global market share. Margin compression from price competition remains a persistent headwind. In autonomous vehicles, Waymo operates a fully autonomous commercial service (no safety driver) in 10 US cities as of February 2026, targeting 1 million weekly rides by year-end. Tesla, by contrast, had not filed for a commercial autonomous vehicle permit in California as of the most recent reporting period.
At current price levels, the bear case produces no path to positive returns over a decade. A company can perform well operationally and still be a poor investment at the wrong entry price.
That is the counterintuitive lesson. Tesla’s earnings beat did not change the bear case arithmetic. The entry price did.
The bull case is not optimism dressed in numbers. It is a structured attempt to assign value to revenue streams that have not yet generated meaningful cash flow but could, under specific conditions, become the majority of Tesla’s enterprise value. The methodology challenge is real: how do you value something that does not yet exist?
Three new revenue streams underpin the thesis:
Elon Musk has characterised Optimus as potentially representing approximately 80% of Tesla’s future enterprise value, a claim originating from a September 2025 social media post rather than a formal strategic document. Whether or not that figure proves accurate, the bull case assigns substantial probability to at least one of these verticals reaching commercial scale.
The inputs reflect that ambition:
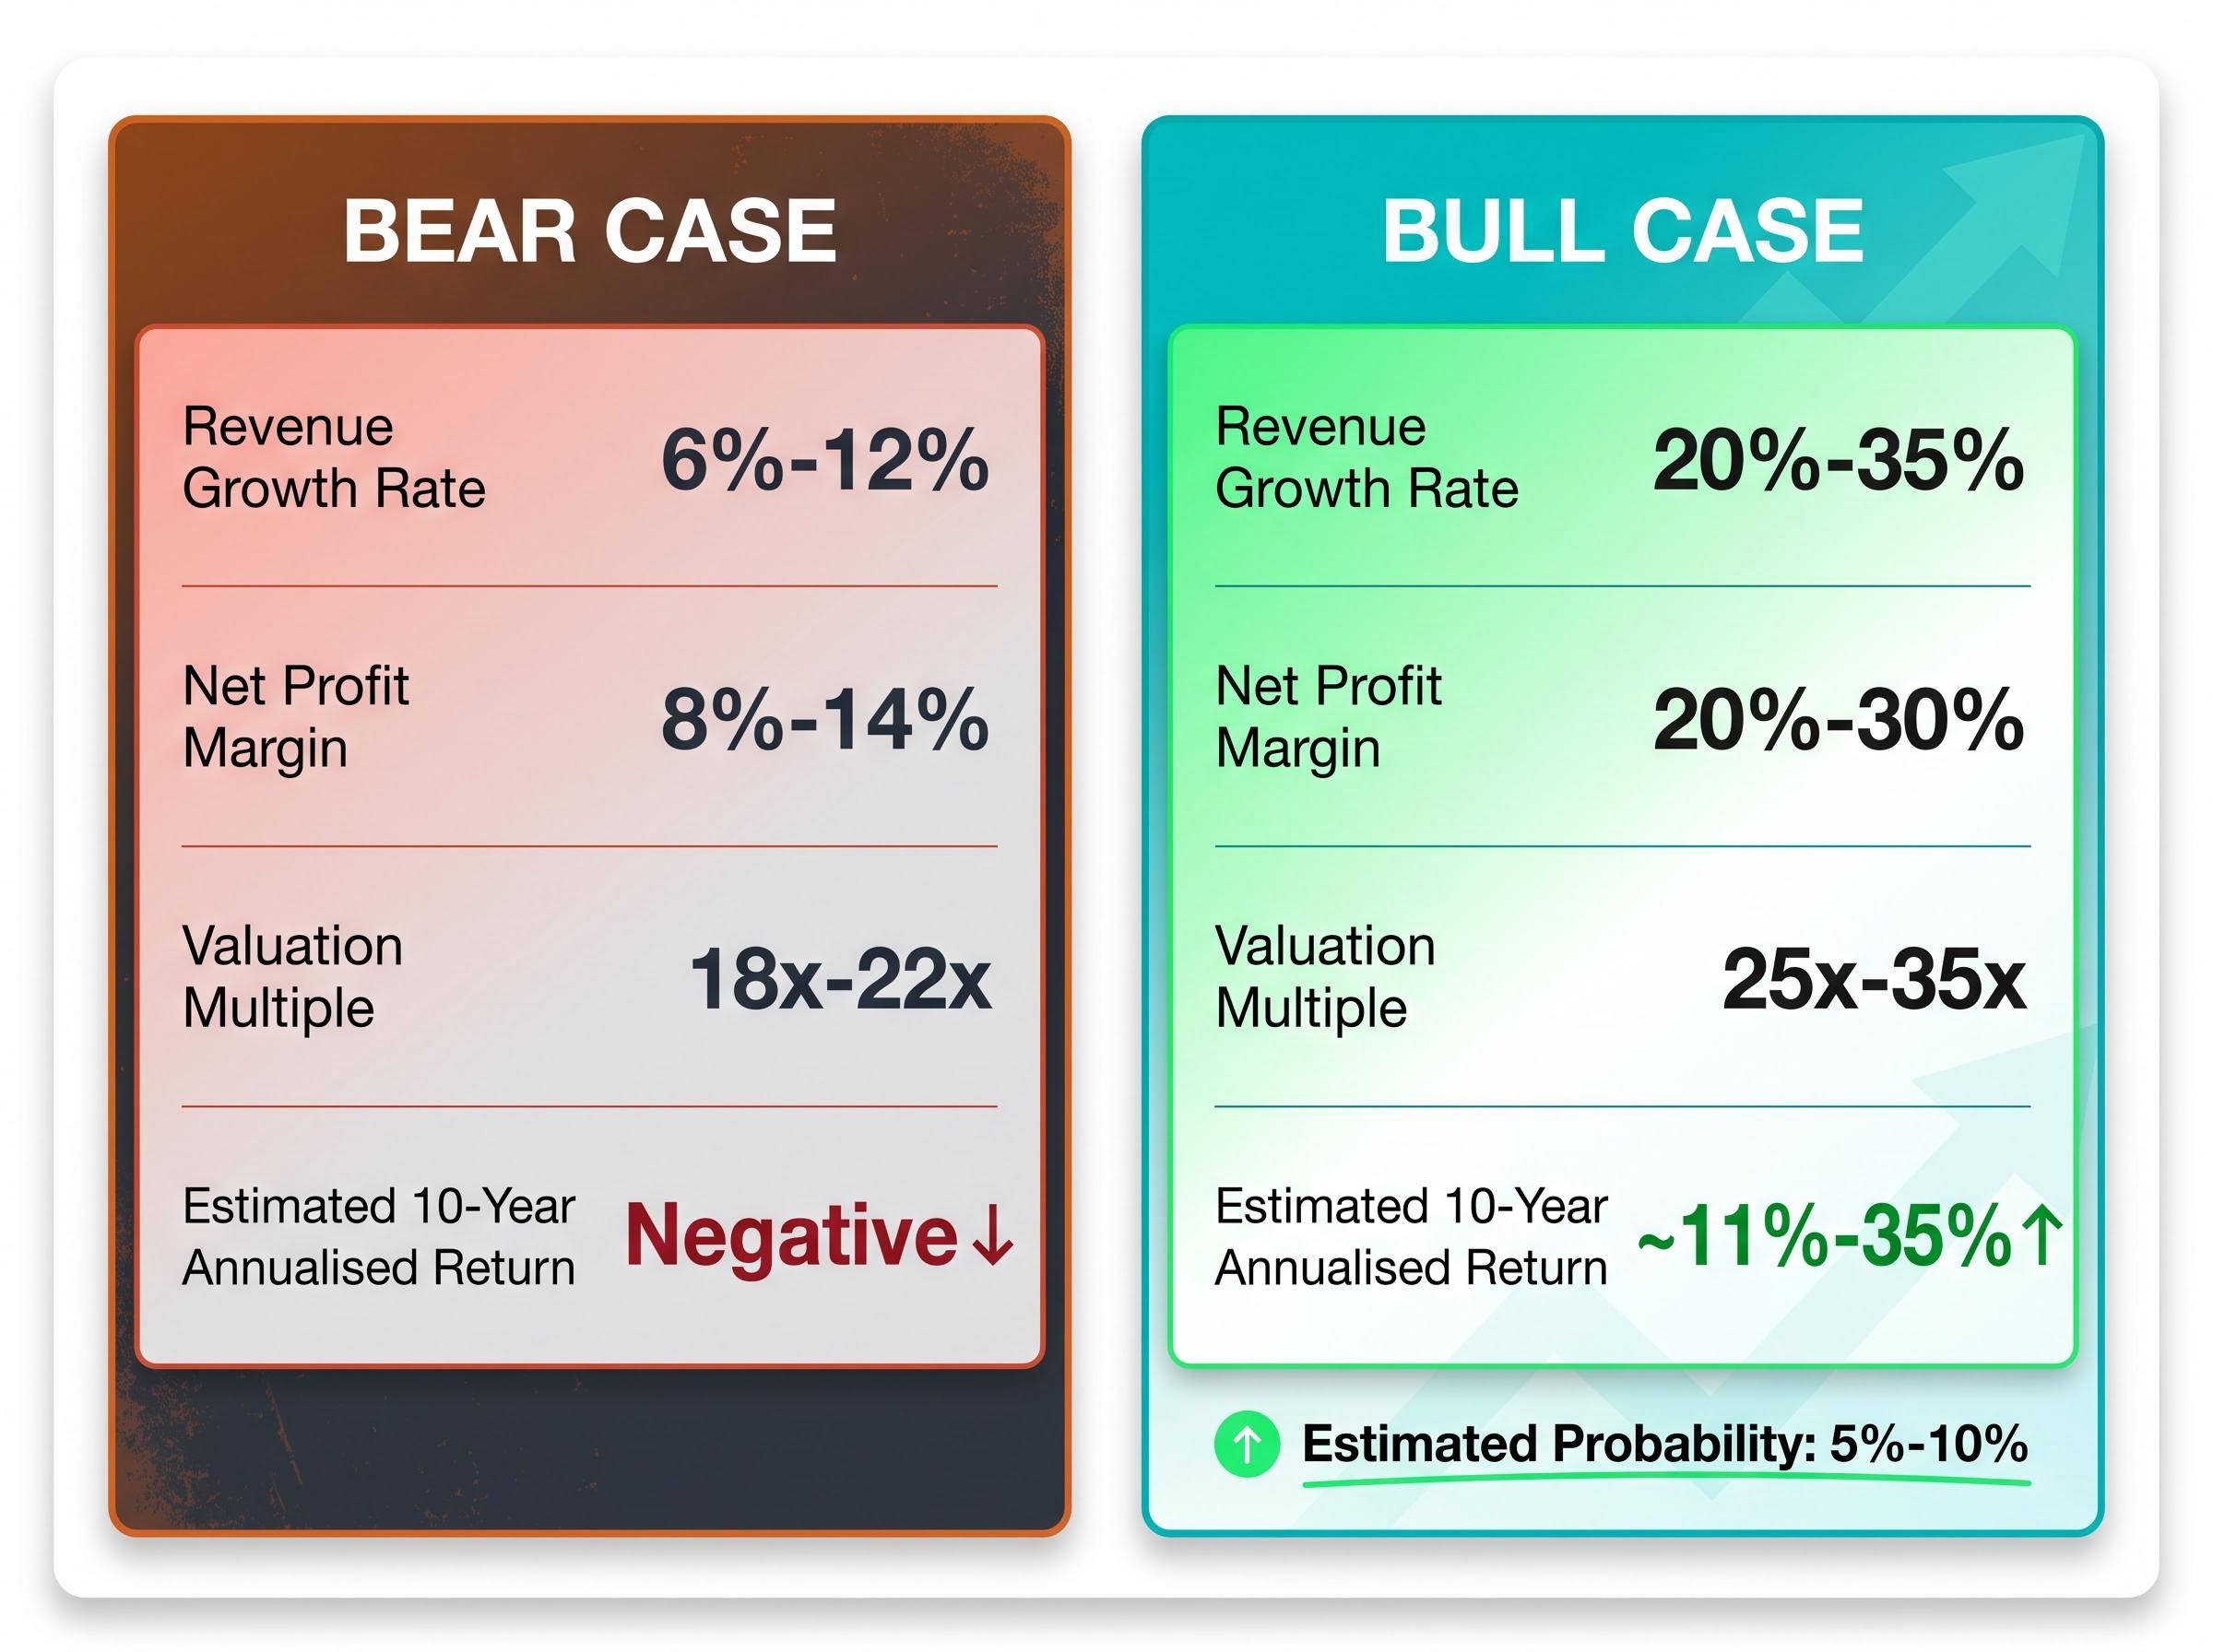
| Input | Bear Case | Bull Case |
|---|---|---|
| Revenue Growth Rate | 6%-12% | 20%-35% |
| Net Profit Margin | 8%-14% | 20%-30% |
| Valuation Multiple | 18x-22x | 25x-35x |
| Estimated 10-Year Annualised Return | Negative | ~11%-35% |
The estimated probability of the full bull case materialising sits at approximately 5%-10%. Tesla’s $25 billion capex guidance for 2026, directed primarily toward AI infrastructure, signals management’s commitment to these verticals. Whether that commitment translates into revenue remains the open question.
Each of Tesla’s business segments operates in a fundamentally different industry with its own margin profile and comparable set. Automotive manufacturing carries low-single-digit to mid-teen margins and trades at single-digit earnings multiples. Software and FSD licensing resembles SaaS economics with recurring revenue and high margins. Energy storage sits closer to utility infrastructure valuations. Humanoid robotics has no established comparable set at all.
Applying a single blended multiple to this business collapses that complexity. It either overvalues the auto business by applying a tech premium or undervalues the software and robotics segments by dragging them down to auto-sector norms. The CFA Institute’s sum-of-parts valuation framework, which values each segment independently using appropriate sector multiples before aggregating them, provides the formal methodology for addressing this problem.
The same company at two different prices is not the same investment. Tesla was available at approximately $100 per share a few years prior to this analysis. At $411.12 today, the stock has appreciated more than fourfold. An investor who bought at $100 and applies the bear case assumptions still holds a position with a fundamentally different return profile than someone buying at $411 with identical assumptions.
This is the concept of margin of safety made concrete. At $100, even the bear case might have produced tolerable returns. At $411, even Piper Sandler’s $500 Overweight target implies only approximately 22% upside, a thin cushion for a stock whose forward earnings estimates project more than 5x growth from current levels, incorporating expected AI and autonomy contributions that have not yet materialised. It is worth noting that analyst EPS estimates for Tesla declined more than 90% from their peak before recovering, a reminder of how dramatically earnings expectations can shift.
Margin of safety as a concept extends well beyond individual stock selection: at the broad market level, the Buffett Indicator currently sits approximately 2.4 standard deviations above its long-run trend, a condition that historically compresses the margin of safety available across virtually all equity positions simultaneously.
The 317x P/E ratio tells this story in a single number. That multiple only makes sense if the market is implicitly assigning a high probability to the bull case. The scenario framework makes that implicit bet explicit.
An investor buying Tesla at $100 and an investor buying at $411 owned the same company. They did not own the same investment. The entry price determined which scenario needed to materialise for a positive return.
Before buying any stock in transition, three questions deserve answers:
Tesla’s $130-$600 analyst target dispersion is the clearest single indicator that this company exemplifies the conditions under which scenario-based valuation is not optional but necessary. The methodology, however, is not specific to Tesla or electric vehicles.
The same dynamics appear across transition-stage growth companies where current earnings understate projected value: aggressive expansion targets, execution-dependent margin profiles, and valuation premiums that require multiple years of compounding to justify, creating identical scenario-analysis problems for investors regardless of sector.
The five-step framework applies to any company facing a similar transformation:
The conditions that signal this framework is needed appear across sectors and geographies:
Tesla’s 53.7% US EV market share in January 2026 illustrates why even apparently positive headline metrics require disaggregation. That share figure coexists with structural Chinese competitive pressure globally, and the two data points tell different stories depending on which geographic segment an investor weights. The framework surfaces these tensions rather than hiding them.
For readers seeking deeper technical grounding, the CFA Institute’s formal guidance on sum-of-parts valuation methodologies, including segment aggregation techniques and conglomerate discount considerations, provides a structured extension of the approach outlined here.
Tesla’s $130-$600 analyst spread is not confusion. It is the direct result of legitimate disagreement over which scenario will materialise, and both views can be internally consistent given their assumptions. Wells Fargo’s bear case and New Street Research’s bull case are looking at identical financial data and reaching opposite conclusions because they weight different segments, assign different probabilities, and apply different multiples.
The methodology in this guide does not produce a definitive answer on Tesla’s stock. It produces a structured way to make an explicit, defensible bet rather than an implicit, unexamined one. That distinction is the difference between analysis and speculation.
The next time a high-multiple stock appears obviously overvalued or obviously undervalued, run the three-scenario framework before forming a view. Define the inputs. Assign the probabilities. Calculate the return at the current price. The numbers will either confirm the instinct or challenge it, and either outcome is more useful than conviction without a framework.
This article is for informational purposes only and should not be considered financial advice. Investors should conduct their own research and consult with financial professionals before making investment decisions. Past performance does not guarantee future results. Financial projections are subject to market conditions and various risk factors.
Stock valuation analysis is the process of estimating a company's intrinsic worth by examining financial metrics, growth assumptions, and comparable multiples, helping investors determine whether a stock is priced fairly relative to its prospects. It matters because the price paid at entry is one of the most consequential decisions an investor makes, directly determining which future scenario must materialise for a positive return.
A P/E ratio of 317x means the market is paying roughly 317 times current earnings for a share, a level that cannot be justified by the existing business alone and instead reflects the market pricing in substantial future revenue from unproven segments such as autonomous ride-hailing, humanoid robotics, and FSD software licensing. Traditional automotive peers trade at 8x-15x, so the premium represents what analysts call option value on those potential future businesses.
Analysts define three explicit inputs for each scenario: a revenue growth rate, a net profit margin assumption, and an exit valuation multiple, then calculate the projected return at the current entry price. For Tesla, the bear case uses 6%-12% revenue growth and an 18x-22x multiple, producing negative 10-year returns at current prices, while the bull case uses 20%-35% growth and a 25x-35x multiple, producing estimated annualised returns of roughly 11%-35%.
The $470 spread between Wells Fargo's $130 target and New Street Research's $600 target reflects legitimate disagreement over which business segments will generate value, what probability to assign each scenario, and which valuation multiples to apply, not errors or confusion. Wide analyst target dispersion is itself a risk signal, indicating the market has not resolved which version of the company's future to price in.
Margin of safety refers to the buffer between the price you pay and your estimate of a company's intrinsic value, and it means the same company at two different prices represents two fundamentally different investments. An investor who bought Tesla near $100 per share holds a position with a very different return profile under bear case assumptions than someone buying at $411, even though both own identical shares in the same business.