Why Australian Investors Keep Repeating the Same 4 Mistakes
1 hr ago

Nvidia is simultaneously the largest company in the S&P 500 and one of its most undervalued relative to peers. That contradiction, according to Bank of America analysts, has a specific and addressable cause. With the company projected to generate more than $400 billion in combined free cash flow across 2026 and 2027, a figure roughly equivalent to Apple and Microsoft combined, Nvidia’s near-50% valuation discount to its Magnificent Seven peers is drawing serious analytical scrutiny. The gap is not explained by growth concerns or competitive deterioration. It appears to be a structural problem tied to how Nvidia deploys its cash. What follows is an examination of why the company’s capital return policy has created a self-imposed valuation ceiling, what a policy shift would quantitatively mean for the stock, and how investors weighing Nvidia today should interpret the distance between the company’s cash generation and its market multiple.
At a market capitalisation of approximately $4.82 trillion as of early May 2026, Nvidia is the most valuable publicly traded company in the United States. It also trades at roughly half the forward earnings multiple of its closest peers.
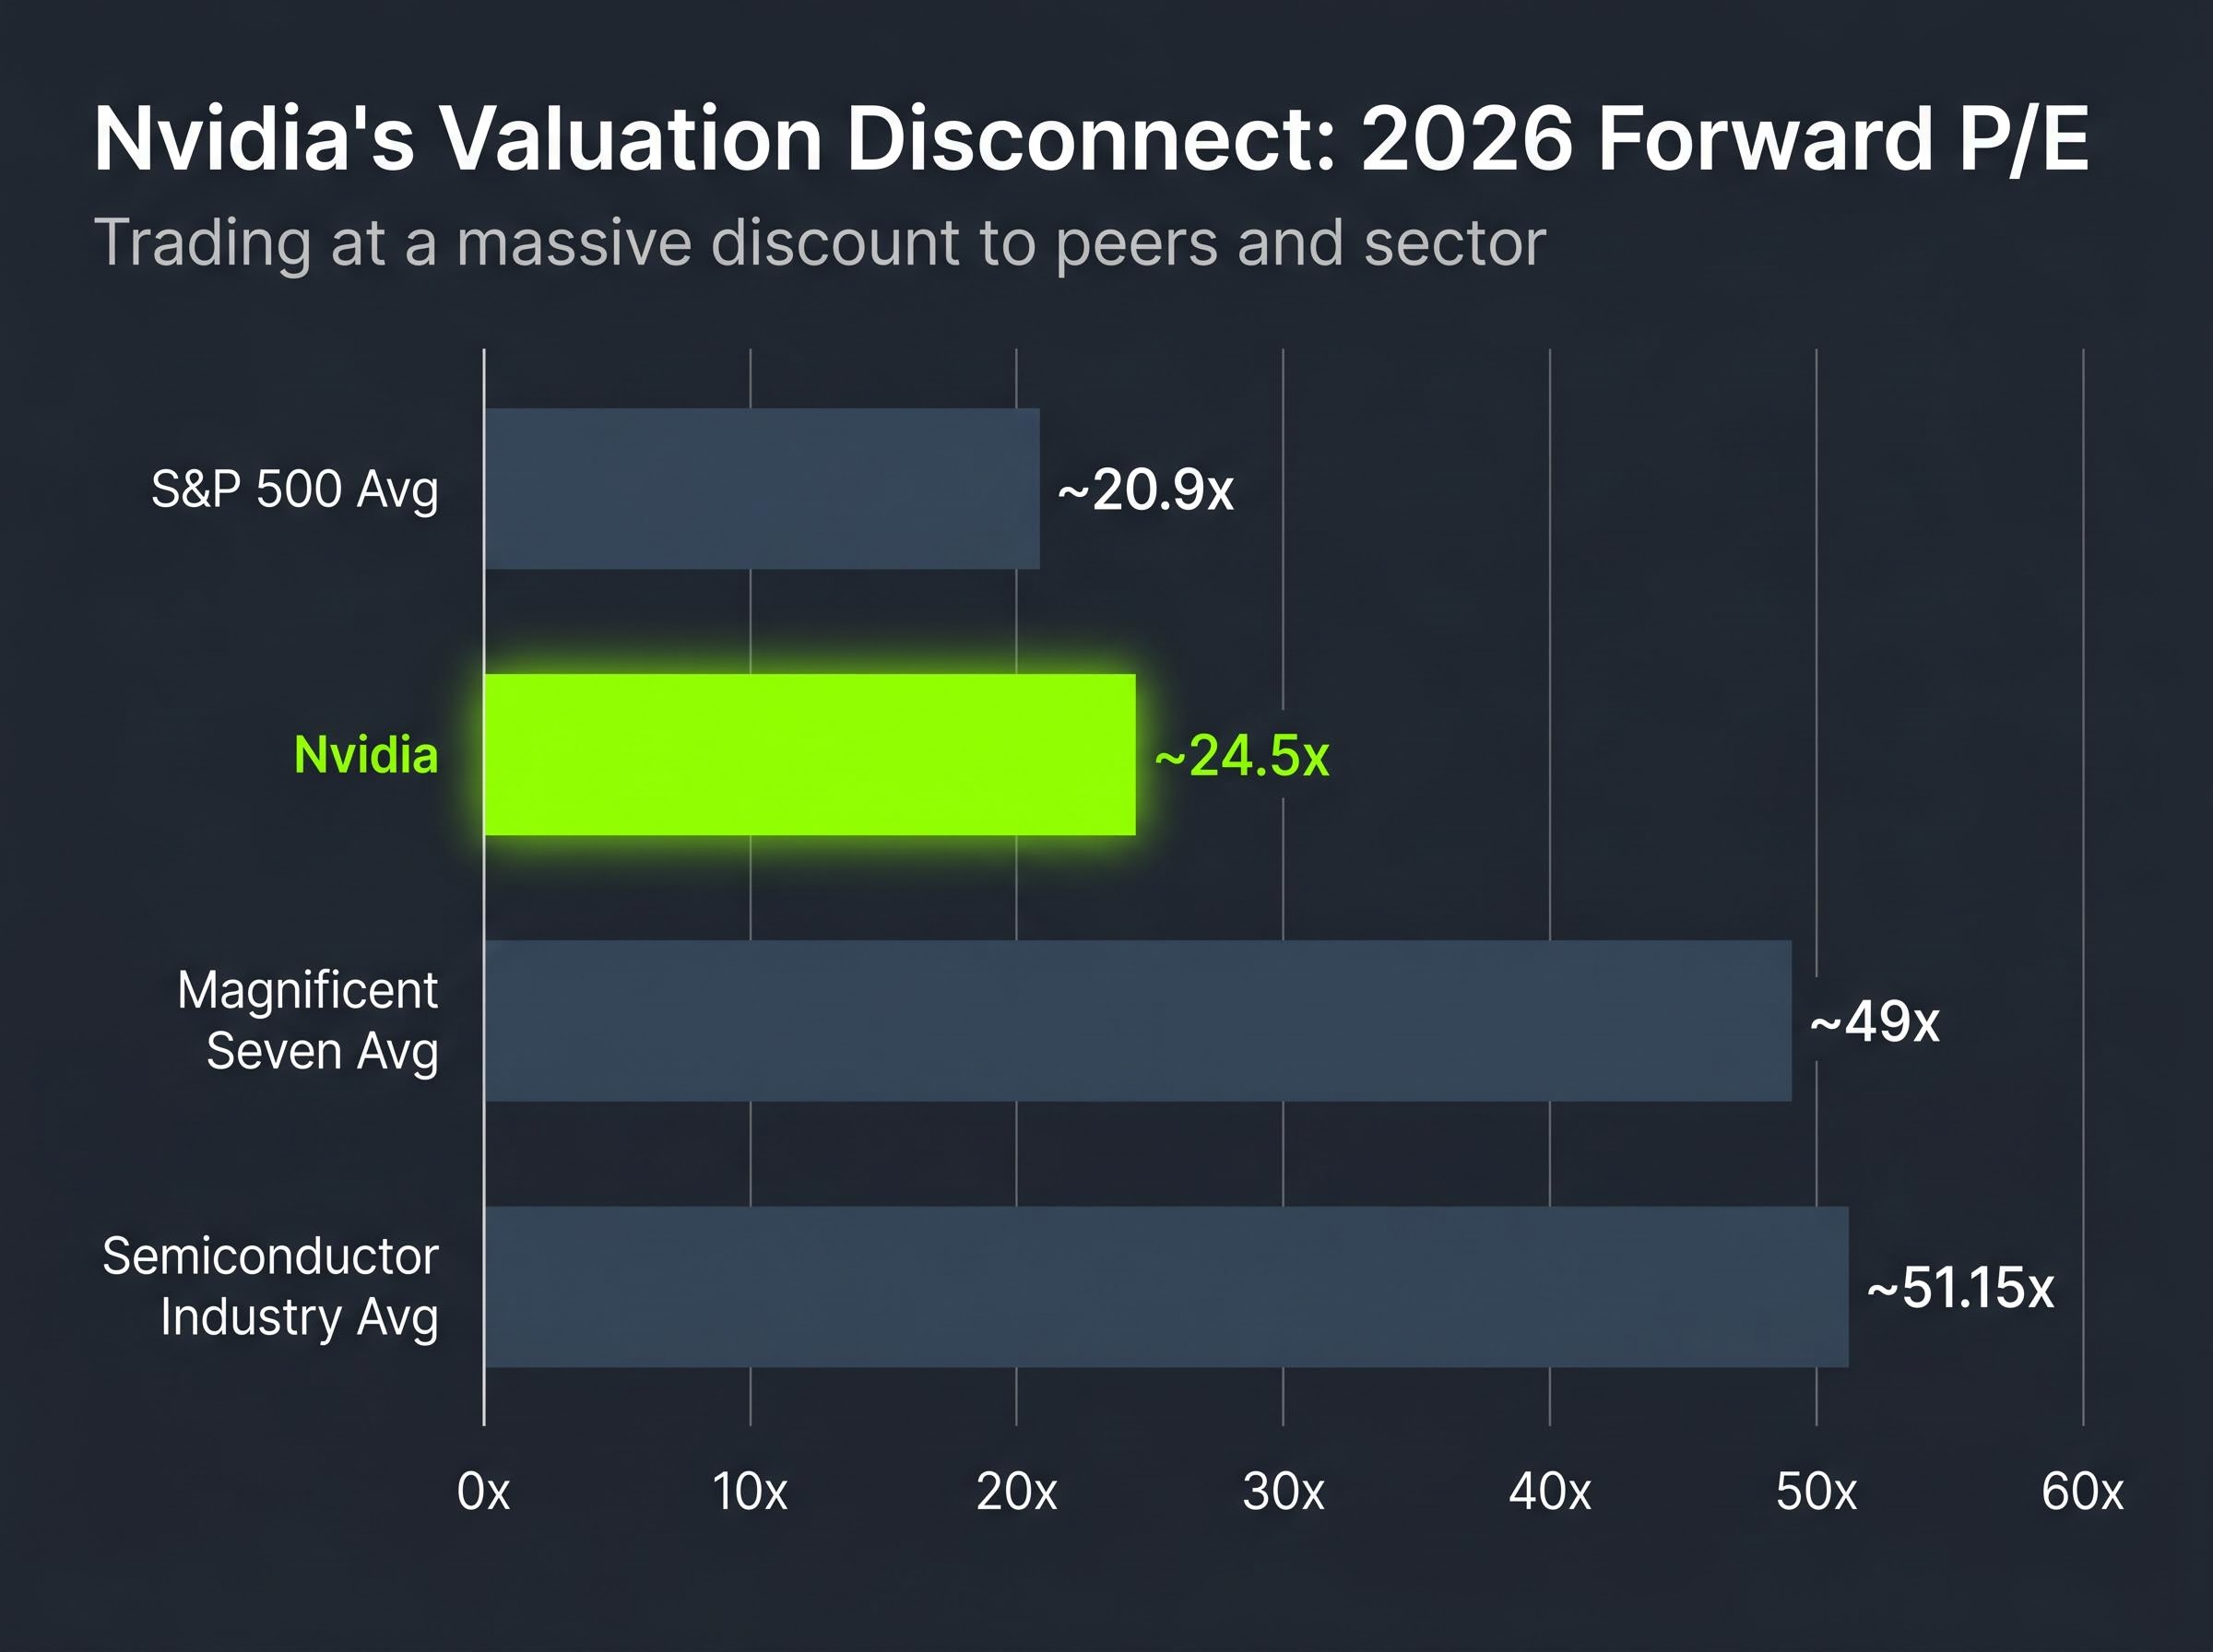
Nvidia’s forward price-to-earnings ratio sits at approximately 24.5x on 2026 estimates. The Magnificent Seven peer average is approximately 49x. On 2027 estimates, that gap narrows only marginally: Nvidia at roughly 19x versus a peer average of approximately 41.5x. The company’s market cap-to-free cash flow multiple trades approximately 30% lower than Apple and Microsoft, despite projected cash generation that matches or exceeds both.
Nvidia is projected to generate more than $400 billion in free cash flow across 2026 and 2027, roughly equivalent to Apple and Microsoft combined, yet trades at a roughly 30% lower market cap-to-FCF multiple than those two peers.
For context, Nvidia’s 24.5x forward P/E sits above the S&P 500 average of approximately 20.9x but well below the semiconductor industry average of 51.15x. The discount is not a function of the company growing more slowly than its sector. It is not a function of margin compression. Something else is suppressing the multiple.
Magnificent Seven concentration in cap-weighted indices has itself become a structural force, with the group representing nearly 34% of the S&P 500 by early 2026, meaning the very peer group used to benchmark Nvidia’s discount carries outsized influence over passive fund flows and index-level valuation dynamics.
| Company | 2026 Forward P/E | 2027 Forward P/E | Dividend Yield |
|---|---|---|---|
| Nvidia | ~24.5x | ~19x | ~0.02% |
| Magnificent Seven Avg. | ~49x | ~41.5x | ~0.89% |
| S&P 500 Avg. | ~20.9x | N/A | Varies |
| Semiconductor Industry Avg. | ~51.15x | N/A | Varies |
Nvidia returned $41.1 billion to shareholders in fiscal year 2026 through dividends and repurchases. In absolute terms, that is a substantial figure. In relative terms, it represents a company deploying less than half of what it generates, and a sharp departure from its own history.
NVIDIA’s fiscal 2026 financial results confirm the $41.1 billion returned to shareholders through repurchases and cash dividends, an official figure that anchors the return rate comparison against both the company’s historical norm and its current peer group.
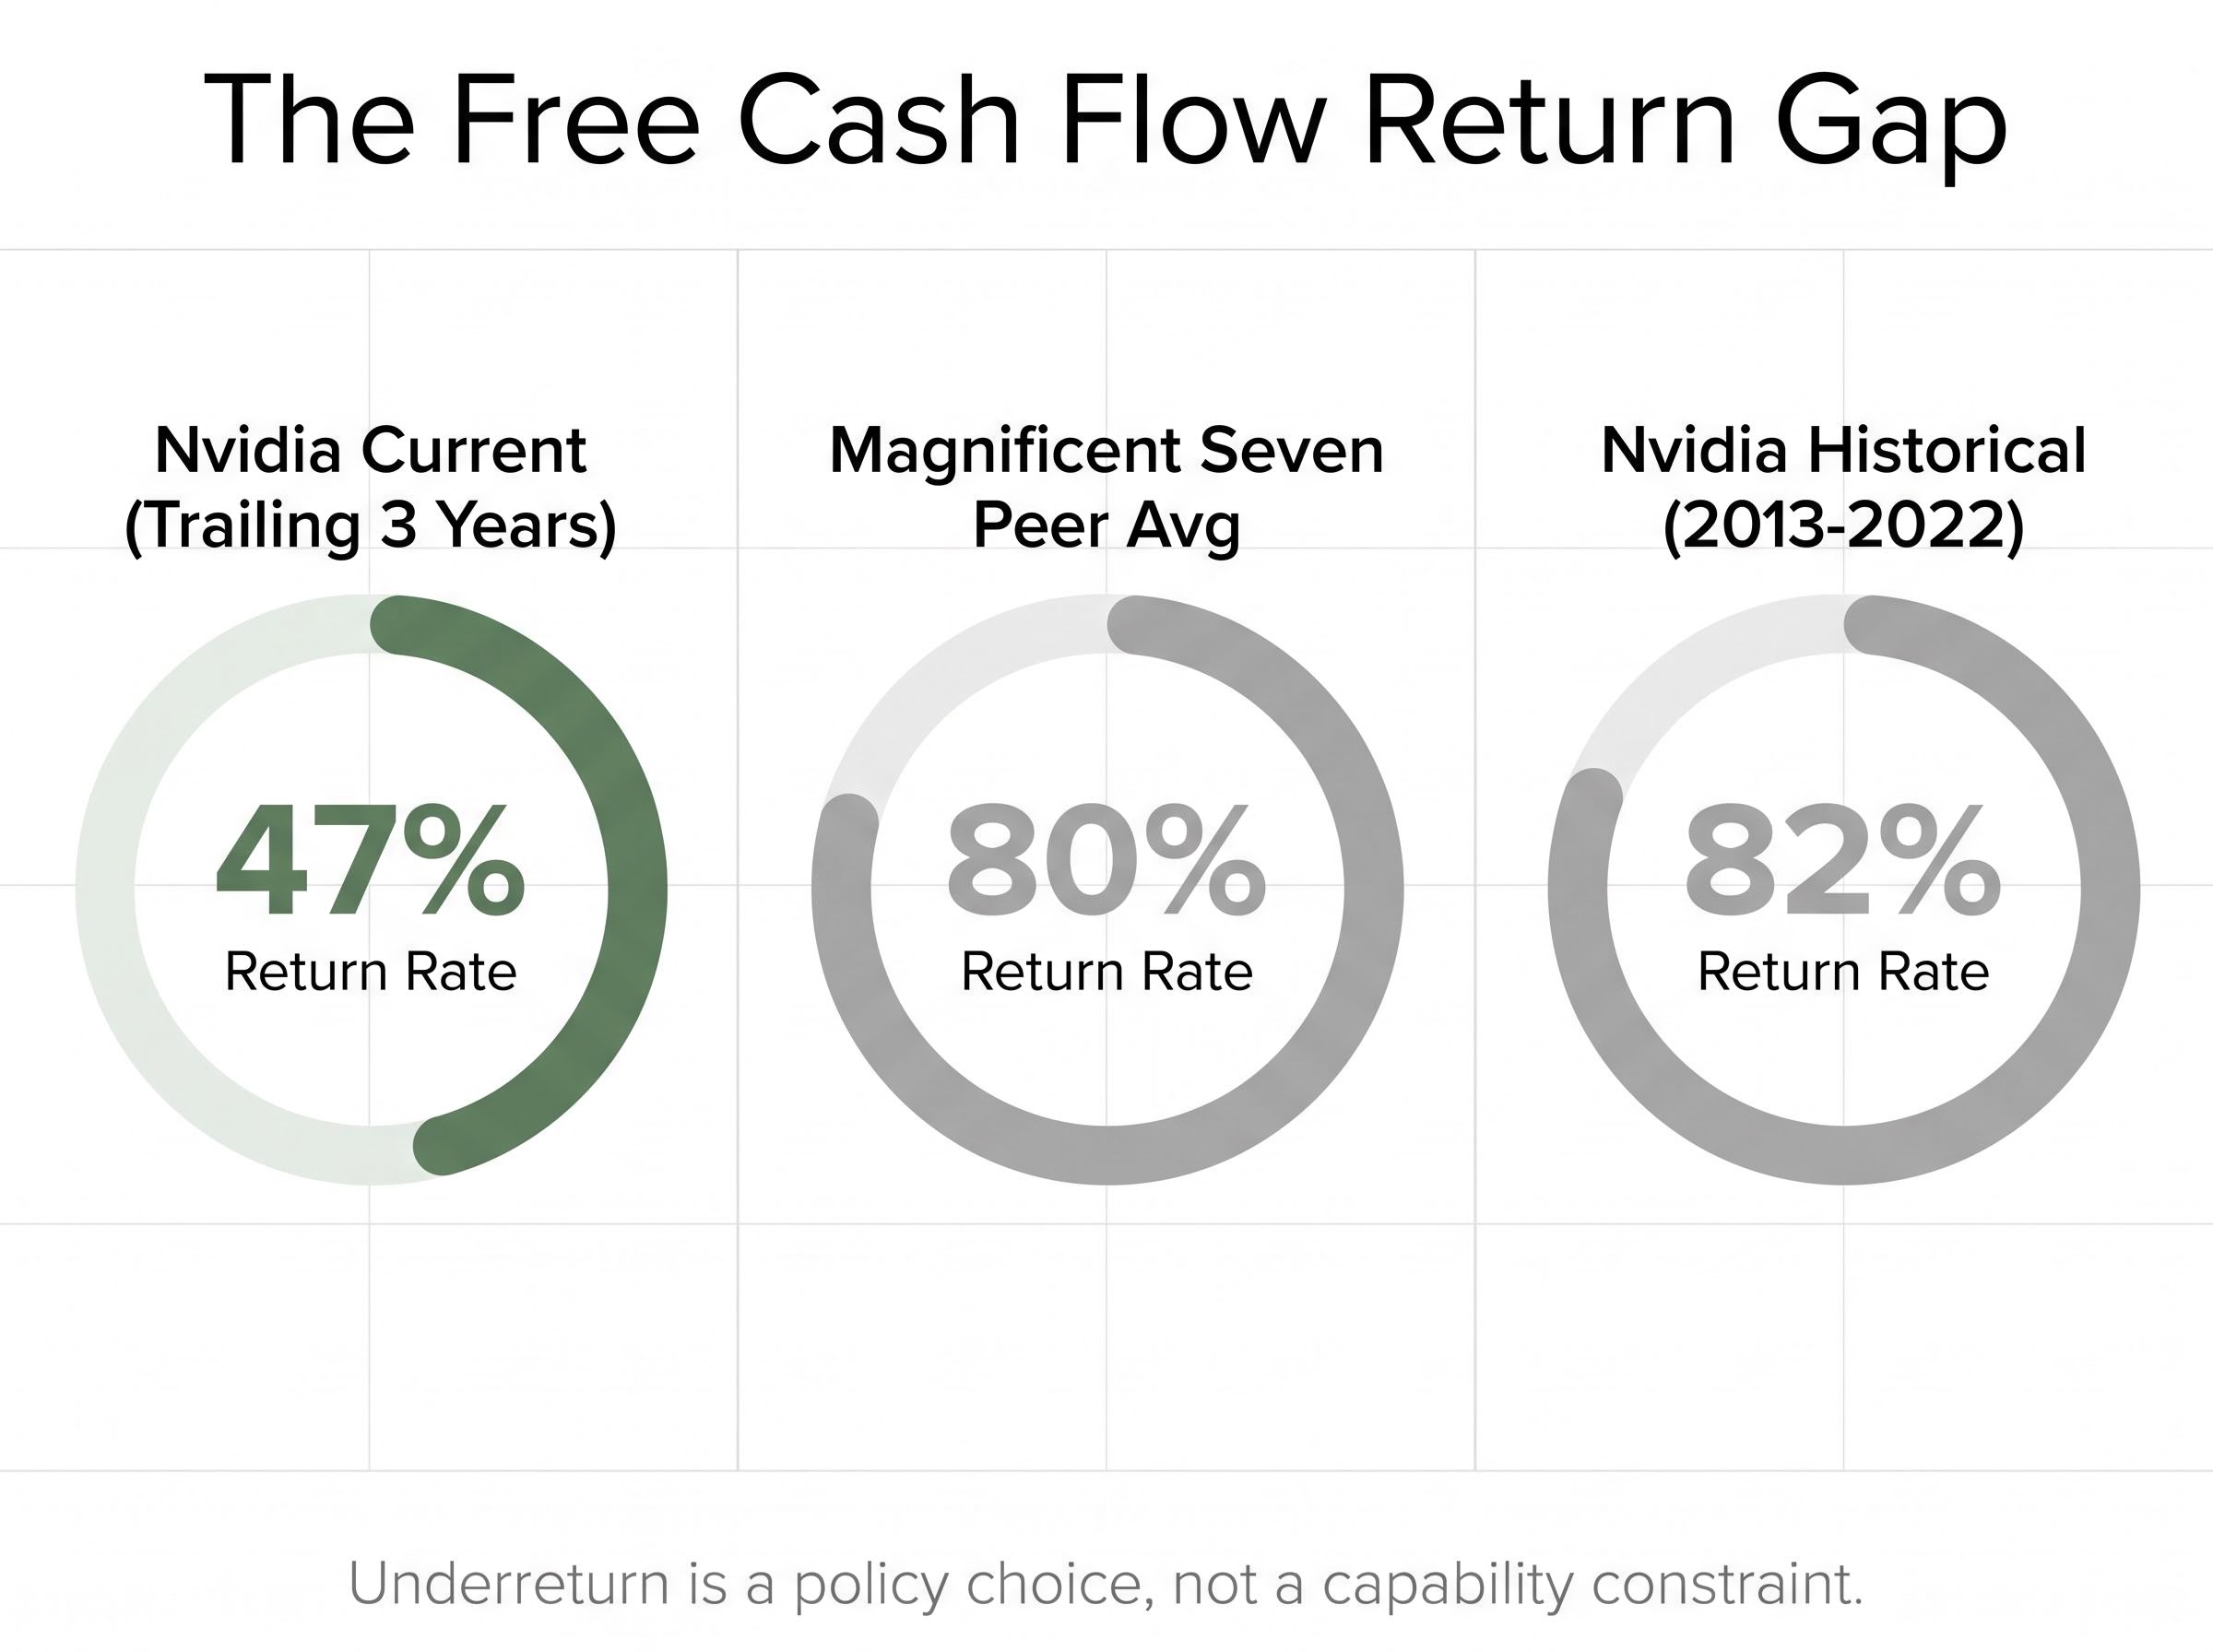
Over the past three years, Nvidia’s free cash flow return rate has averaged approximately 47%. Between 2013 and 2022, that same figure was approximately 82%. The current peer group average sits at approximately 80%. The decline is not a story about a company that cannot afford to return more cash. It is a story about a company that has chosen not to.
The gap between 47% and 82% is not a rounding error. It represents tens of billions of dollars annually that could be flowing to shareholders but instead remain on the balance sheet. For investors evaluating whether this discount is a buying opportunity, the distinction matters: the underreturn is a policy choice, not a capability constraint.
The tension at the centre of the Bank of America thesis maps onto a broader debate about dividend investing vs total return: whether a company maximises shareholder wealth by distributing cash regularly or by retaining it for reinvestment, and whether the market prices those two strategies equivalently when the underlying cash generation is the same.
The return rate only tells part of the story. The composition of those returns matters as well, and Nvidia’s dividend yield of approximately 0.02% introduces a structural problem that goes beyond shareholder preference.
At that yield, Nvidia is held by approximately 16% of equity income funds, versus a peer average of approximately 32%. Across the Magnificent Seven cohort, income fund penetration ranges from 9% to 57%, placing Nvidia near the bottom of its own peer group. The yield is not merely low; it is functionally invisible to an entire category of institutional capital.
The connection between Nvidia’s near-zero dividend yield and its valuation discount runs through a mechanism that has little to do with the company’s business fundamentals and everything to do with how institutional money is mandated to flow.
Income-oriented funds, including equity income funds, dividend growth funds, and balanced portfolios, operate under mandates that require or strongly incentivise holdings above certain yield thresholds. A stock yielding 0.02% does not clear those thresholds regardless of its underlying cash generation, growth profile, or market position. The result is structural exclusion: not a decision by fund managers to avoid Nvidia, but a mandate-driven inability to own it.
The sequence operates as follows:
Bank of America analysts, led by Vivek Arya, have identified this ownership gap as the primary mechanism linking capital allocation policy to the stock’s persistent undervaluation. With Nvidia held by approximately 16% of equity income funds against a peer average of approximately 32%, the demand shortfall is quantifiable. A capital return pivot would not simply signal financial confidence. It would functionally expand the pool of buyers eligible to hold the stock.
The analytical case for a re-rating rests on arithmetic, not speculation. Bank of America’s framework proposes raising Nvidia’s dividend yield to a range of 0.5% to 1.0%, comparable to Apple’s approximately 0.4% and Microsoft’s approximately 0.8%. At that level, Nvidia would clear the yield thresholds that currently lock it out of income fund mandates.
The cost of this shift is quantifiable. BofA estimates the annual outlay at $26 billion to $51 billion, equivalent to 15% to 30% of projected 2026 free cash flow. Against a combined FCF base exceeding $400 billion over 2026 and 2027, the financial burden is modest.
Nvidia’s projected free cash flow across 2026 and 2027 is roughly equivalent to Apple and Microsoft combined, a cash generation base that makes the cost of a yield increase financially immaterial relative to the potential re-rating benefit.
| Scenario | Target Yield | Estimated Annual Cost | % of 2026 FCF |
|---|---|---|---|
| Low | 0.5% | ~$26 billion | ~15% |
| Mid | 0.75% | ~$38 billion | ~22% |
| High | 1.0% | ~$51 billion | ~30% |
The re-rating argument is distinct from the standard AI demand bull case. It does not depend on revenue acceleration, new product cycles, or hyperscaler capital expenditure growth. BofA maintains a Buy rating with a $300 price target and has raised revenue forecasts for FY2027 through FY2029 to $342 billion, $423 billion, and $496 billion respectively. The capital return thesis is additive: it offers a valuation catalyst that operates independently of the growth story.
AI stock valuations across the Nasdaq 100 have re-rated sharply following the April 2026 lows, with momentum indicators entering overbought territory even as Magnificent Seven earnings face pressure to validate AI revenue at scale, a backdrop that makes the capital return argument more compelling as a multiple-expansion lever independent of the growth narrative.
A forward price-to-earnings ratio measures what investors are paying today for each dollar of a company’s expected future earnings. It is the most widely used valuation comparison tool because it allows direct comparison across companies of different sizes, sectors, and growth profiles. When one company trades at a 50% discount to peers on this metric, it signals either that the market expects materially worse earnings outcomes or that something structural is suppressing the price.
Nvidia’s forward P/E sits in a distinctive position across three reference points:
The forward P/E, however, captures only the earnings estimate. It does not distinguish between a dollar of earnings that is retained and a dollar of earnings that is returned to shareholders as deployable cash.
Free cash flow multiples strip out non-cash accounting items and reflect the actual cash a company generates that is available for dividends, buybacks, or reinvestment. On this basis, Nvidia trades approximately 30% lower than Apple and Microsoft despite projected FCF that rivals both combined over the next two years.
The FCF metric is particularly relevant to the capital return argument. A company generating more than $400 billion in free cash flow across 2026 and 2027 has substantial optionality that earnings-per-share figures alone do not capture. The gap between the P/E discount and the FCF discount suggests the market is pricing Nvidia’s cash pile as less valuable per dollar than its peers’, precisely because less of that cash is being directed to shareholders.
The structural argument distils to a single claim: Nvidia’s valuation discount is not primarily a reflection of growth risk but of a capital return policy that limits its ownership base and suppresses demand. The AI demand case supports the growth trajectory. The capital return case addresses the multiple.
Analyst consensus price targets reflect this dual thesis. Based on early May 2026 pricing of approximately $198.45:
Nvidia’s approximately 80% AI accelerator market share, expected to hold through at least 2026, underpins the fundamental case. BofA models at least 70% share retention even under competitive pressure scenarios. The unresolved variable is management’s willingness to shift capital allocation in a direction that would broaden the stock’s institutional ownership base.
A practical investor framework follows three steps:
The two narratives, AI demand growth and capital return expansion, are additive rather than competing. A policy pivot would represent incremental upside layered on top of an already constructive fundamental backdrop.
Investors exploring the demand-side foundation beneath Nvidia’s free cash flow projections will find our deep-dive into the AI hardware capex cycle, which examines how hyperscaler infrastructure spending of $600 billion to $750 billion in 2026 translates into semiconductor revenue, the risks of software monetisation lag, and what grid capacity constraints mean for procurement timelines.
This article is for informational purposes only and should not be considered financial advice. Investors should conduct their own research and consult with financial professionals before making investment decisions.
Nvidia’s valuation discount is a choice the company is implicitly making with every quarter that passes without a material shift in capital return policy. At a 47% FCF return rate, against a historical norm of 82% and a peer average of 80%, the gap is widening in visibility if not in magnitude. The income fund exclusion problem and the broader shareholder return shortfall are dimensions of the same structural underperformance.
The FCF trajectory makes continued inaction increasingly difficult to defend. More than $400 billion in projected free cash flow over two years is not a resource constraint; it is an allocation question. For investors positioned in or evaluating Nvidia, two signals matter most: capital allocation commentary in upcoming earnings calls, and any measurable shift in institutional income fund ownership. Those are the leading indicators that the re-rating process, if it comes, has begun.
Past performance does not guarantee future results. Financial projections are subject to market conditions and various risk factors.
Bank of America analysts argue Nvidia trades at roughly half the forward P/E of its Magnificent Seven peers not because of growth concerns but because its near-zero dividend yield and low free cash flow return rate structurally exclude it from income fund mandates, suppressing institutional demand.
A forward P/E ratio measures what investors pay today for each dollar of a company's expected future earnings; Nvidia's forward P/E of approximately 24.5x sits well below its semiconductor sector average of 51.15x and its Magnificent Seven peer average of 49x, signalling a structural valuation discount rather than weaker growth prospects.
Nvidia is projected to generate more than $400 billion in combined free cash flow across 2026 and 2027, a figure roughly equivalent to Apple and Microsoft combined, yet the company currently returns only about 47% of its free cash flow to shareholders against a peer average of approximately 80%.
Bank of America proposes Nvidia raise its dividend yield to a range of 0.5% to 1.0%, costing an estimated $26 billion to $51 billion annually (15% to 30% of projected 2026 free cash flow), which would clear yield thresholds that currently prevent income-oriented funds from holding the stock.
Based on early May 2026 pricing of approximately $198.45, price targets range from Goldman Sachs at $250 to Bank of America and Cantor Fitzgerald both at $300, implying upside of approximately 26% to 51%, with Cantor Fitzgerald citing an upside scenario as high as $400.