
Nike Stock at $45: Recovery Bet or Value Trap?
36 mins ago

Nike shares closed 30 April 2026 at $44.36, down roughly 62% over five years. In the same period, On Running posted approximately 30% revenue growth and Hoka expanded nearly 19% in its most recent quarter. Those numbers frame one of the starkest competitive divergences in consumer discretionary investing right now, and they demand more than a headline reading.
The Q3 FY2026 earnings release on 31 March 2026 confirmed that Nike’s revenue challenge is not a single-quarter blip: net income fell 35%, Converse dropped 35%, Greater China declined 10% on a currency-neutral basis, and management guided for a further 20% China revenue decline next quarter. Yet the stock trades at roughly 1-2 times sales, a valuation level that historically signals either deep value or a value trap. That ambiguity is precisely what makes this stock analytically interesting.
What follows works through what the numbers actually reveal, how competitor growth rates contextualise Nike’s competitive position, what scenario analysis implies for risk-reward at current prices, and which signals investors should monitor to distinguish a genuine turnaround from continued erosion.
The earnings beat was real. Nike reported EPS of $0.35 against consensus expectations of $0.28, and revenue of $11.28 billion edged past the $11.23 billion estimate. For investors scanning headline results, the quarter looked like stabilisation.
Beneath those numbers, the deterioration is harder to dismiss.
Net income fell approximately 35% year-over-year to $520 million. EBIT declined 23% to $635 million. Gross margin compressed to 40.2%, down more than 130 basis points year-over-year, driven primarily by US-China tariff headwinds that management expects to cost the company approximately $1 billion in total. Converse revenue dropped 35%, acting as a standalone drag on the group result.
Nike’s tariff cost disclosures, reported by BNN Bloomberg, confirmed management’s projection that US-China trade levies would add approximately $1 billion to total costs, a headwind that flows directly into the gross margin compression visible in the Q3 FY2026 results.
| Metric | Q3 FY2026 | Year-over-Year Change |
|---|---|---|
| Revenue | $11.28 billion | Flat |
| Net Income | $520 million | Down ~35% |
| Gross Margin | 40.2% | Down 130+ basis points |
| Nike Direct Revenue | $4.5 billion | Down 4% |
| Wholesale Revenue | $6.5 billion | Up 5% |
The channel story contains an internal reversal worth watching. Nike Direct fell 4% to $4.5 billion, while wholesale grew 5% to $6.5 billion. That wholesale recovery reflects the early results of CEO Elliott Hill’s “Win Now” strategy, which has prioritised rebuilding retailer relationships after the prior administration’s heavy direct-to-consumer push. Retailers appear to be re-engaging, though one quarter of improvement against years of channel friction is not yet confirmation.
Greater China declined 7% on a reported basis and 10% currency-neutral. Management’s forward signal was blunt: China revenue is expected to fall approximately 20% in Q4 FY2026 as channel cleanup continues. The largest geographic drag has not bottomed.
Set Nike’s approximately 10% full-year revenue decline against the growth trajectories of the brands taking its market share:
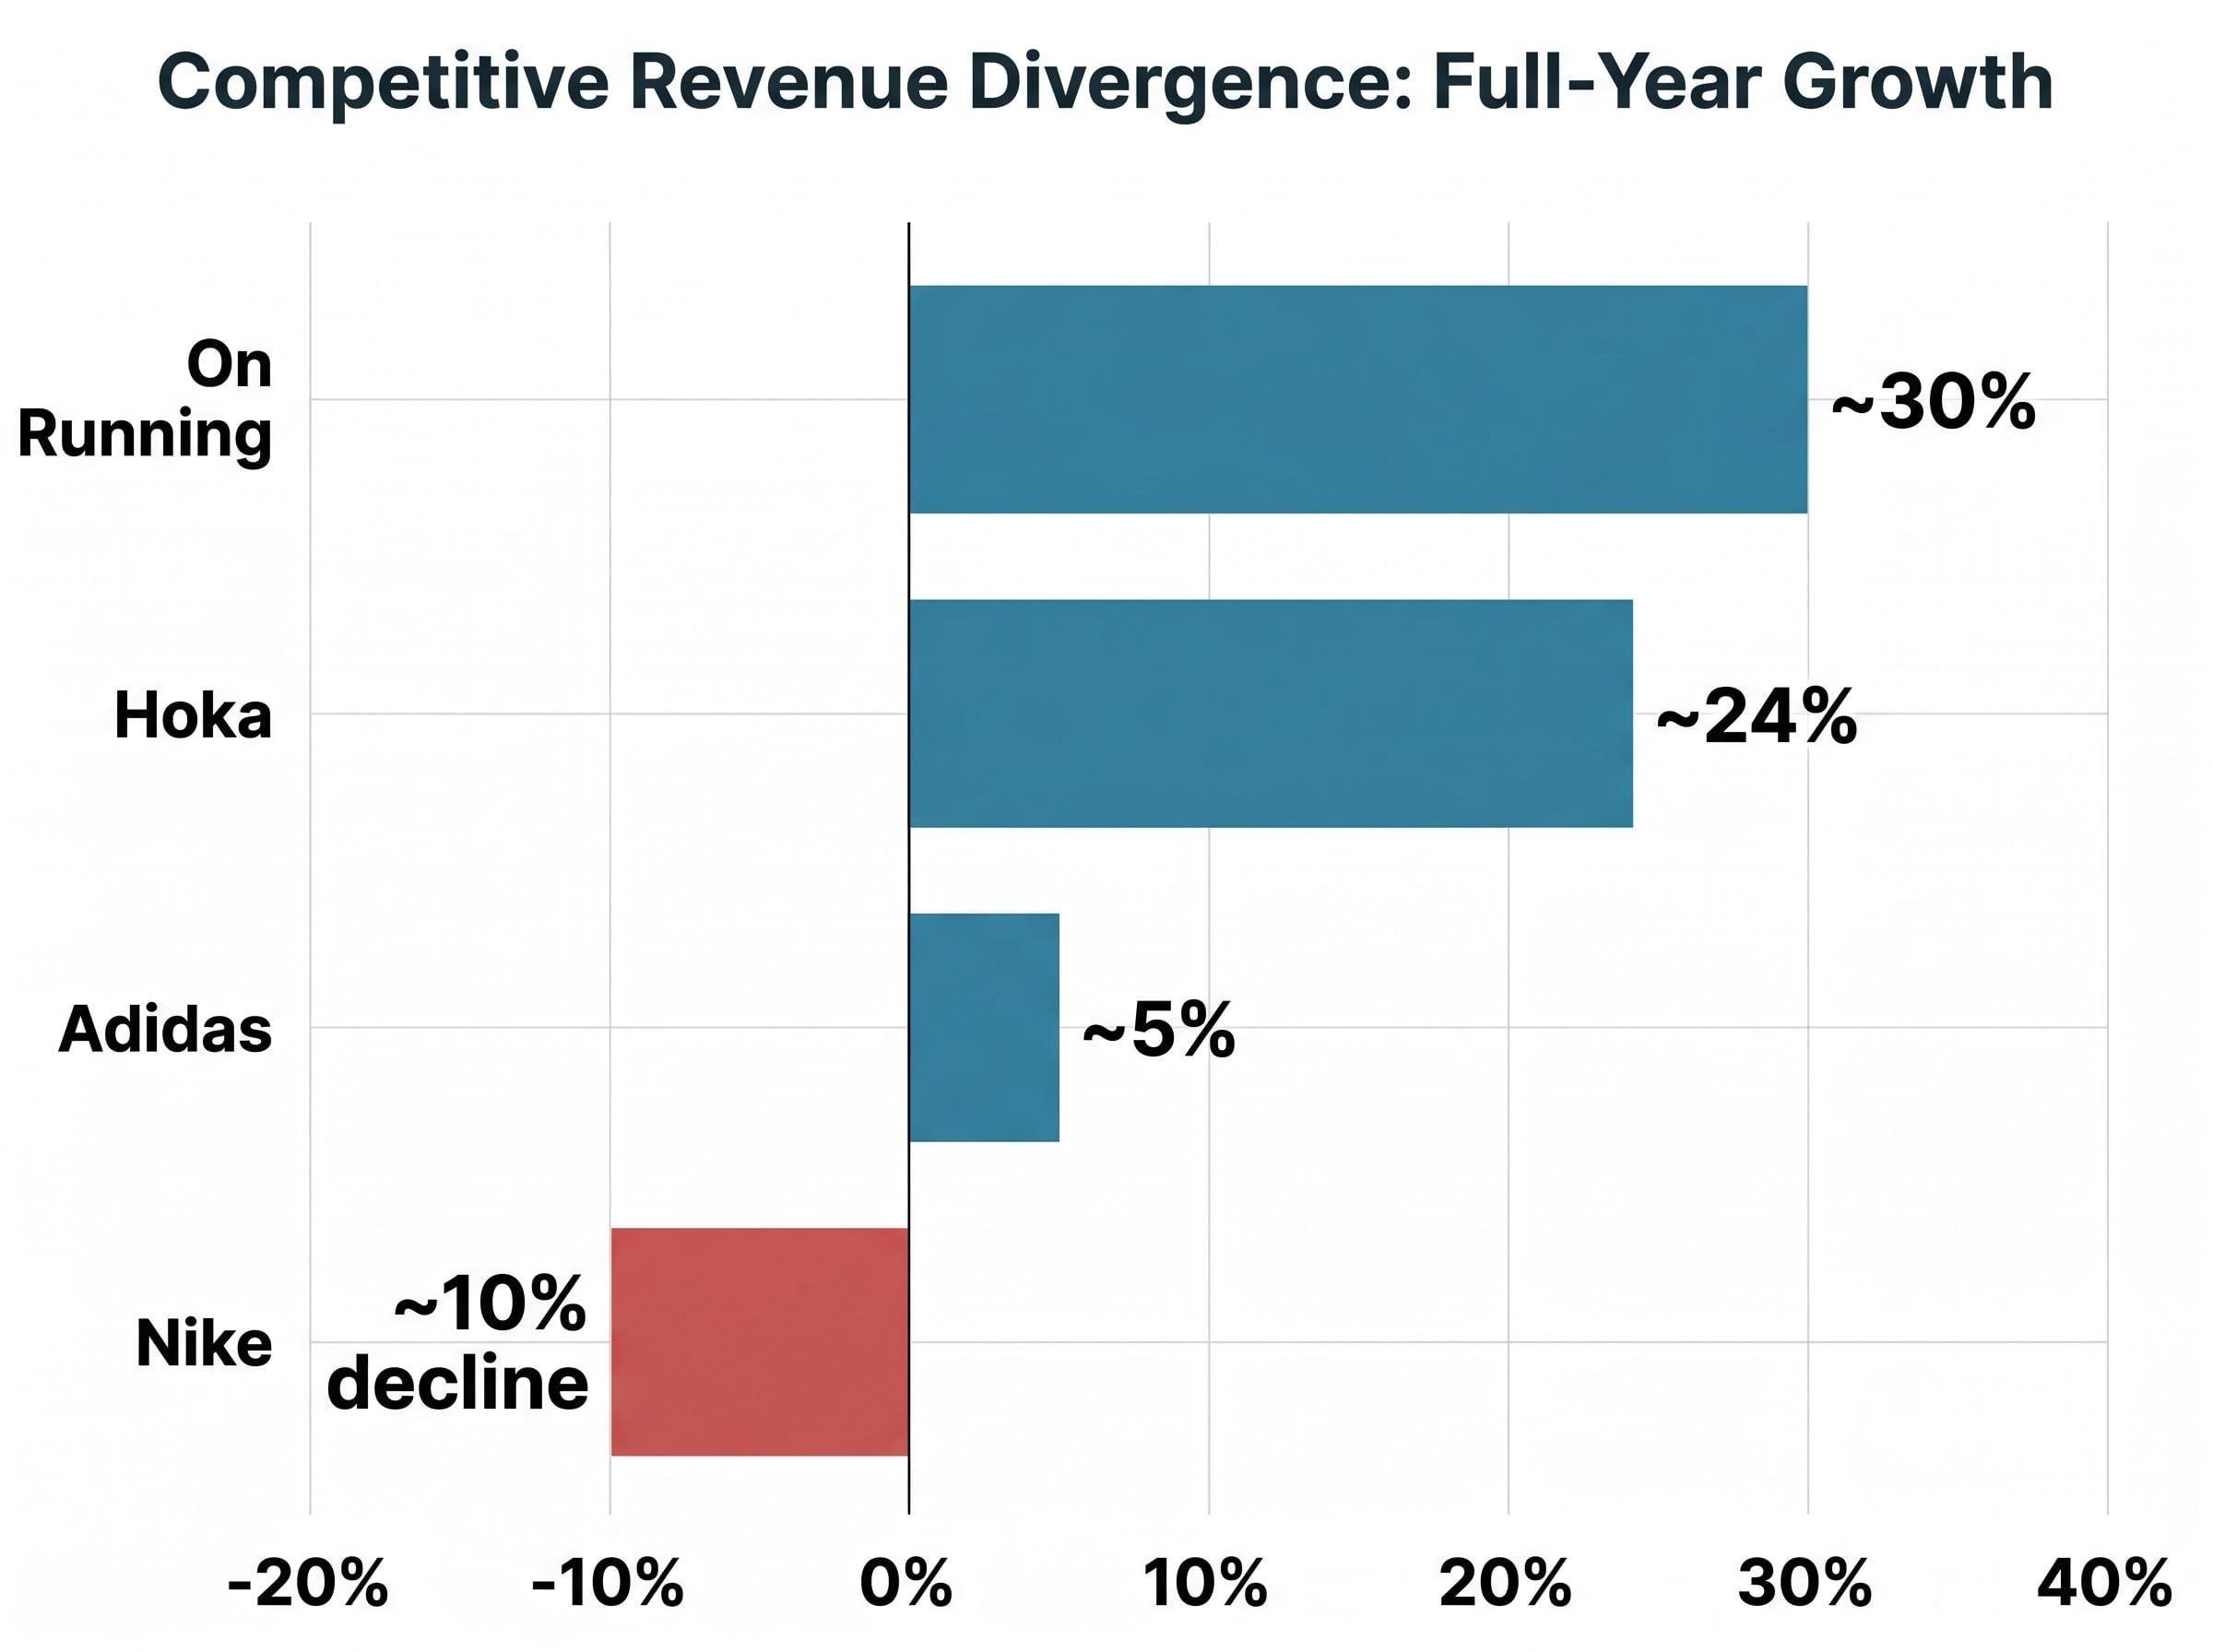
On Running’s full-year 2025 results confirmed net sales of CHF 3,014 million, representing 30% year-over-year growth, placing the competitive pressure on Nike’s performance running franchise in sharper quantitative relief.
The divergence is not evenly distributed. On Running and Hoka are winning in premium performance running, the category Nike historically dominated. Adidas is recovering share in lifestyle and heritage segments. The difference matters because performance running customers build product credibility and community identity around a brand; once that loyalty shifts, the switching cost for competitors to hold those customers drops while the cost for Nike to reclaim them rises.
Lululemon’s brand dilution offers a parallel case study: the company erased approximately $17 billion in shareholder equity over five years as gross margin contracted 550 basis points and competitive pressure intensified from the same premium athletic segment where Nike is fighting to hold position.
Nike’s running category did grow approximately 20% in the most recent period, a counterpoint worth noting. The question is whether that growth rate can compound fast enough to offset the structural share losses visible across the rest of the portfolio.
Whether Nike’s revenue decline is cyclical (demand will return as excess inventory clears) or structural (competitors have permanently captured customer segments) is the single most important analytical question for prospective investors. The competitor data above is the clearest evidence available to inform that judgement.
Price-to-sales is a ratio that measures a company’s stock market value relative to its total revenue. For consumer brand stocks specifically, it is useful because it sidesteps the distortion that compressed margins introduce into earnings-based metrics. When a company’s profit margins are temporarily depressed, earnings-based valuations can make the stock look either absurdly expensive or meaningless; price-to-sales offers a cleaner read on what the market is paying per dollar of top-line activity.
Nike currently trades at approximately $44.36 per share, giving it a market capitalisation of roughly $67 billion against an anticipated annual revenue base of approximately $46 billion. That implies a price-to-sales ratio of approximately 1-2 times. Profit margins sit below 10%, against a normalised potential of approximately 14-15% based on historical performance. The dividend yield stands at 3.69% on an annual dividend of $1.64 per share.
A low sales multiple in isolation, however, is not a value signal. It is a starting condition.
For the valuation case to materialise, three things have to happen together, not sequentially, but in combination:
If only one or two of these conditions materialise, the stock can remain at depressed levels for years. The five-year decline of approximately 61.8% and YTD 2026 decline of approximately 29.4% illustrate the cost of waiting for all three to align.
Each scenario below rests on two explicit assumptions: a revenue growth rate over the next five years and an earnings multiple the market assigns at the end of that period. The purpose is not to predict which scenario will materialise, but to show investors what specific business outcomes are required for each return profile.
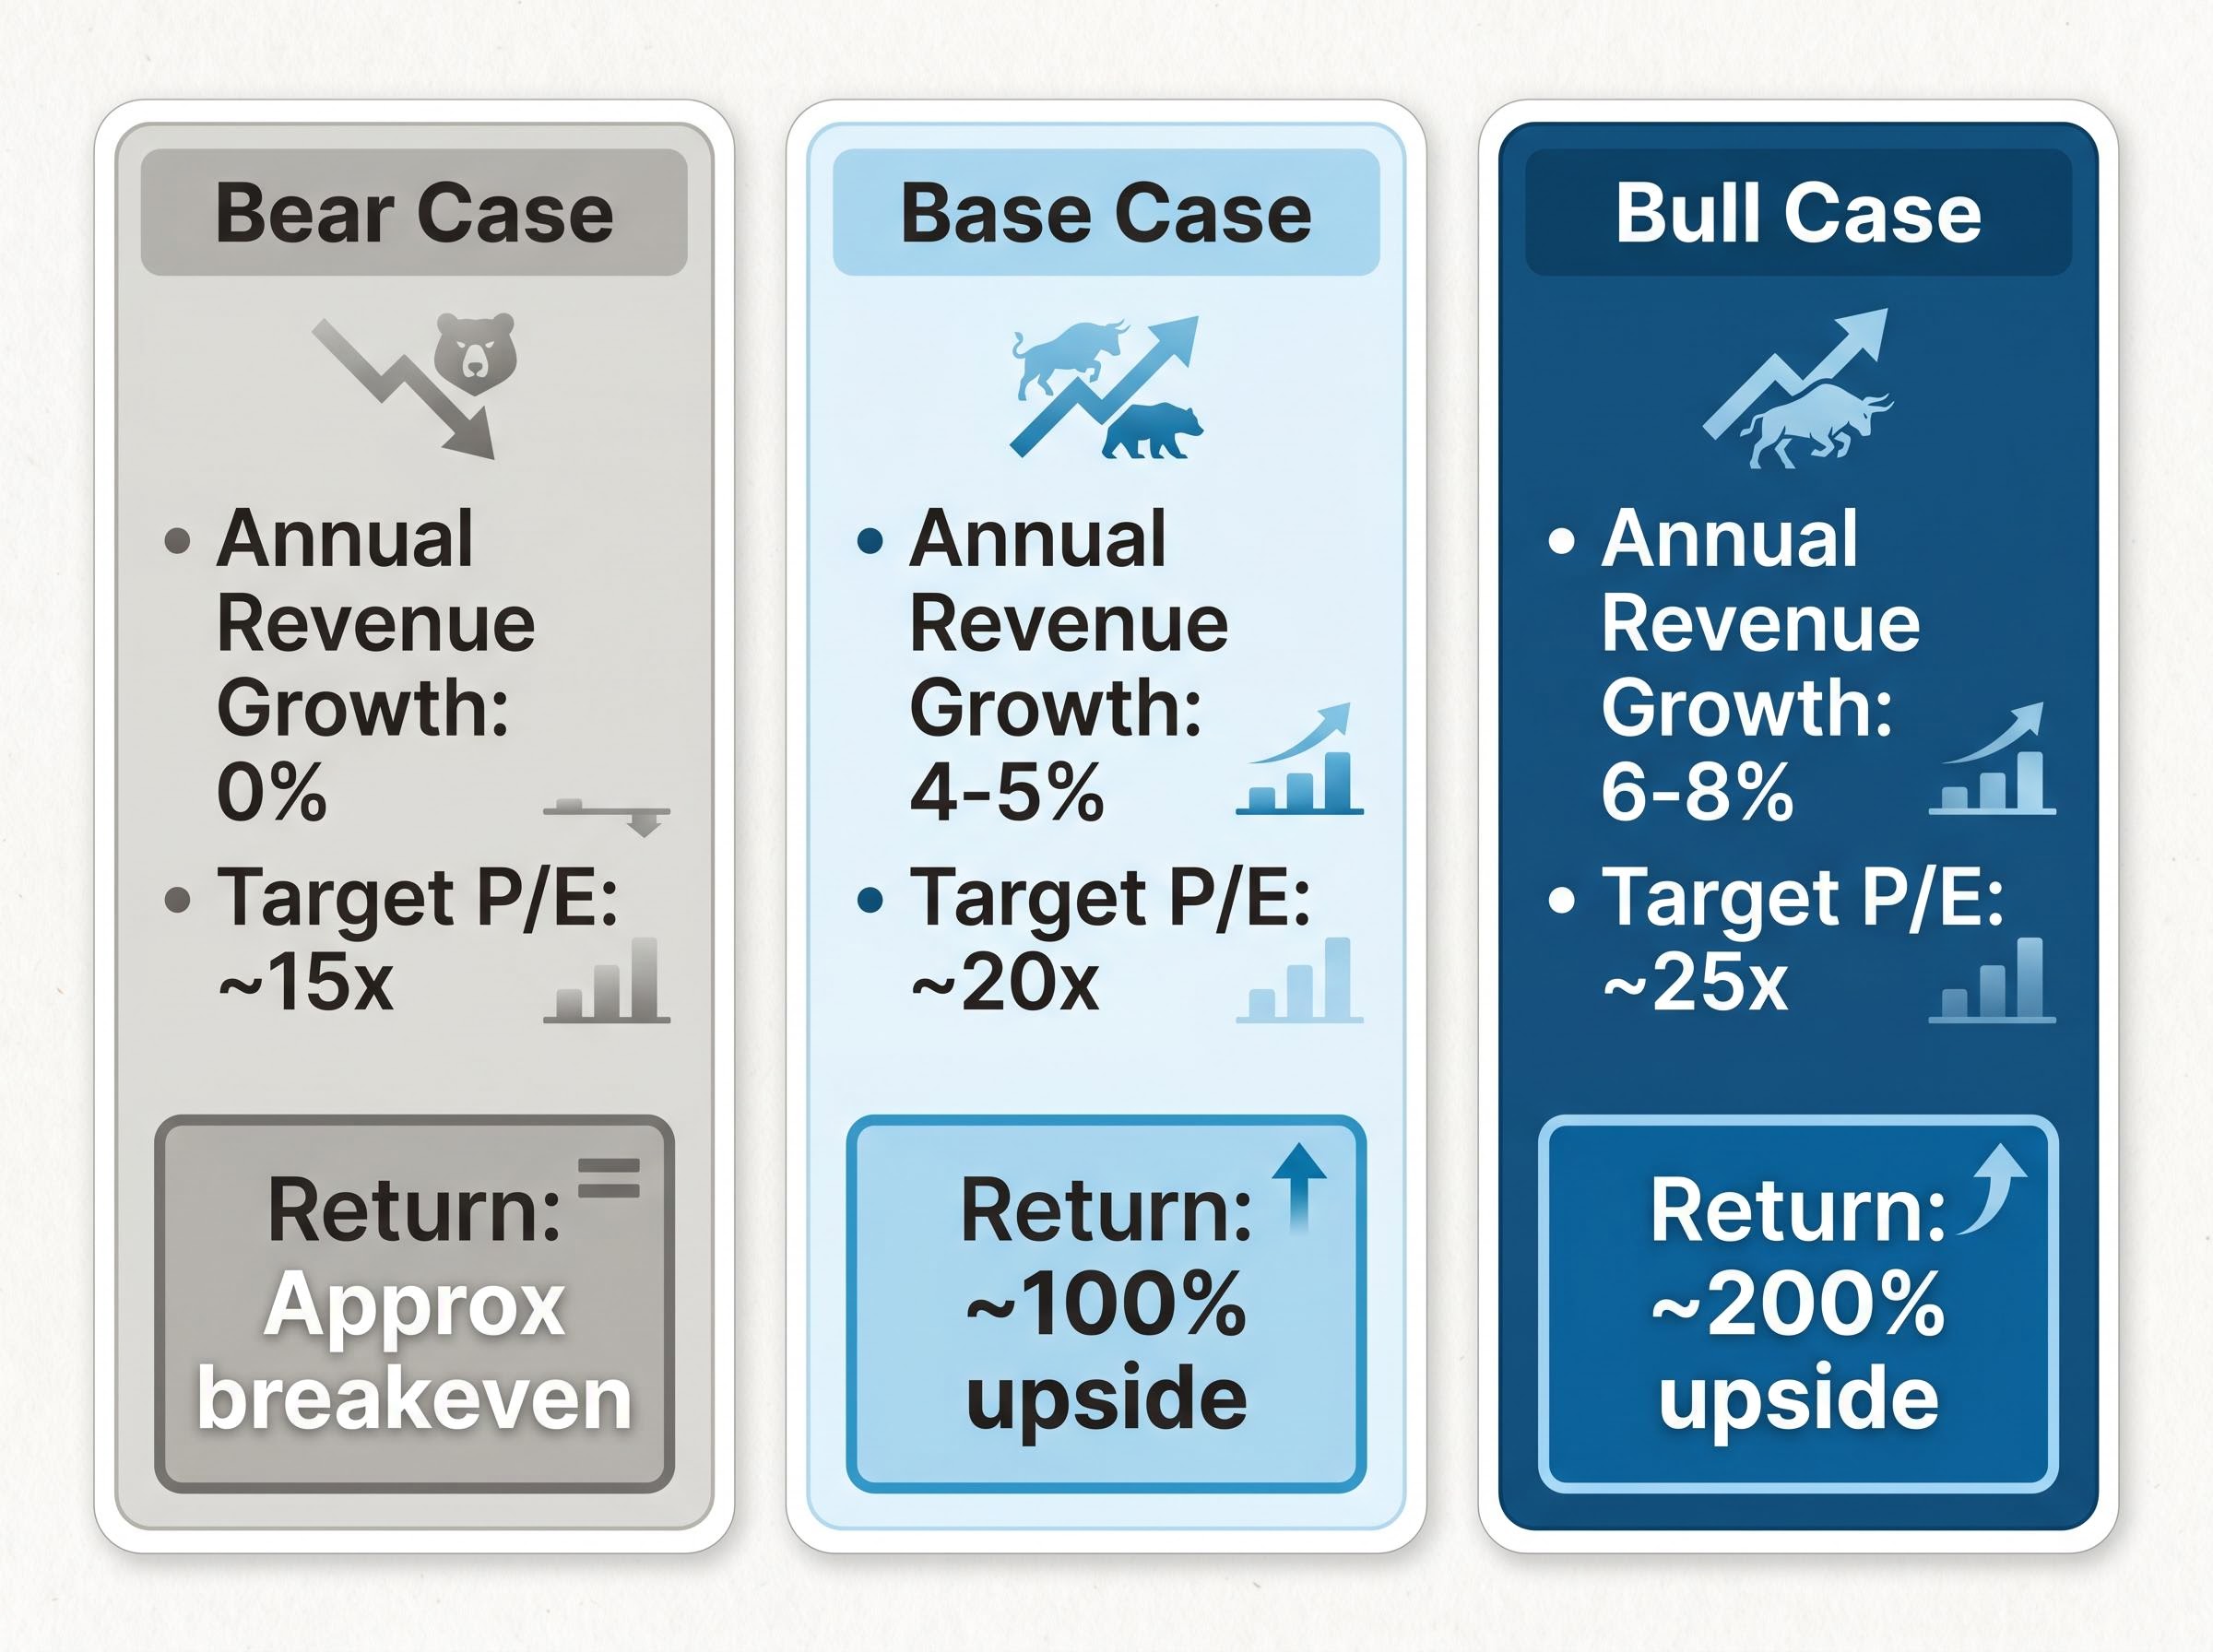
| Scenario | Revenue Growth (Annual) | Target P/E Multiple | Implied 5-Year Return |
|---|---|---|---|
| Bear | 0% | ~15x | Approximately breakeven |
| Base | 4-5% | ~20x | ~100% upside |
| Bull | 6-8% | ~25x | ~200% upside |
The bear case does not imply catastrophic loss from current levels. Zero revenue growth over five years at a 15-times earnings multiple implies roughly breakeven or mildly negative real returns, assuming margins do not deteriorate further. The floor, barring a structural collapse of the brand, appears limited by the $6.66 billion cash position (down approximately 23% year-over-year) and the dividend.
The base and bull cases are contingent on turnaround execution. 4-8% annual revenue growth combined with multiple expansion to 20-25 times implies potential 100-200% upside over five years. That is a multi-year thesis, not a near-term catalyst.
Jefferies maintained a Buy rating on 1 April 2026, cutting its price target to $90 from $110. That remains the most optimistic institutional anchor point. Consensus sits at approximately $62.34.
The asymmetry is visible: meaningful upside if the turnaround succeeds, limited but real capital erosion if it does not.
Rather than offering a verdict on Nike’s recovery prospects, the more useful analytical exercise is defining what confirmation looks like in advance. Investors monitoring NKE should track three domains:
The wholesale recovery and running category growth are real data points. North America posted multi-channel growth for the first time in approximately two years as of Q3 FY2026. Elliott Hill’s “Win Now” framework is producing measurable early results.
One quarter of improvement against a multi-year deterioration trend is not confirmation. China’s projected 20% Q4 decline means the largest geographic drag has not yet bottomed, limiting confidence in a near-term inflection.
There is a practical difference between a turnaround investment and a growth investment. A growth investment buys demonstrated momentum: rising revenue, expanding margins, visible execution. A turnaround investment buys deteriorated fundamentals in anticipation of recovery. That distinction affects position sizing, time horizon, and the tolerance required for interim volatility. Nike at $44.36 is a turnaround bet, not a growth holding.
The Starbucks turnaround strategy provides a useful comparator for the mechanics Nike is attempting: both companies are restructuring around a China recovery thesis, both have appointed new leadership mandated to rebuild channel and operational discipline, and both are offering dividend income to investors willing to hold through multi-quarter uncertainty.
Peter Lynch observed that a large proportion of anticipated corporate turnarounds fail to materialise. That observation is not a verdict on Nike, but a calibration tool: the conviction required to hold a turnaround position through continued deterioration is higher than most investors initially estimate.
The decision framework for NKE at current levels reduces to three questions:
The bear case implies roughly breakeven. The bull case implies substantial upside. The 3.69% dividend yield provides partial compensation while waiting. The evidence for a confirmed recovery, however, does not yet exist.
This article is for informational purposes only and should not be considered financial advice. Investors should conduct their own research and consult with financial professionals before making investment decisions. Past performance does not guarantee future results. Financial projections are subject to market conditions and various risk factors.
Nike at $44 represents a legitimate value argument. The stock is priced for prolonged weakness, the balance sheet retains $6.66 billion in cash, and the dividend yield provides income while the thesis plays out. The bear case does not imply catastrophic loss. The bull case implies meaningful upside.
The evidence for confirmed recovery, however, is not yet visible in the results. Competitor growth rates have shifted the consumer discretionary map in ways that make Nike’s recovery path narrower than in prior cycles. One quarter of wholesale improvement and running category strength is a signal, not a trend.
The Q4 FY2026 results, expected in mid-2026, will be the first meaningful test of whether the 20% China decline guidance was conservative or directionally accurate, and whether North America multi-channel growth can sustain. Investors evaluating NKE should track that release with the scenario assumptions and monitoring signals from this analysis as their reference frame, rather than reacting to headline EPS beats or misses in isolation.
A price-to-sales ratio measures a company's market value relative to its total revenue, and it is useful for Nike because compressed profit margins distort earnings-based metrics. At roughly 1-2 times sales, Nike's current valuation signals either deep value or a value trap depending on whether revenue and margins recover.
Nike shares have declined approximately 62% over five years due to a combination of revenue erosion, gross margin compression from US-China tariffs, a struggling Converse segment down 35%, and competitive share losses to On Running and Hoka in premium performance running.
Investors should monitor gross margin trends, whether the projected 20% China revenue decline in Q4 FY2026 proves to be the trough, sustained wholesale recovery across multiple quarters, and whether the running category's 20% growth rate holds as the product pipeline matures.
On Running posted approximately 30% revenue growth in its most recent fiscal year and Hoka grew 18.5% in Q3 FY2026, while Nike reported an approximately 10% full-year revenue decline over the same comparable period.
A bear case with zero revenue growth implies roughly breakeven returns over five years, a base case of 4-5% annual growth implies approximately 100% upside, and a bull case of 6-8% growth implies approximately 200% upside, all contingent on multiple expansion alongside operational recovery.


