
In 1929, a Harvard-educated market analyst watched the entire edifice of speculative finance collapse around him. His response was not to retreat from markets but to rebuild how he thought about them from first principles. John Burr Williams is rarely mentioned alongside Benjamin Graham or Warren Buffett, yet the intellectual framework he forged in the wreckage of the Great Depression became the bedrock of modern equity valuation. The dividend discount model, which millions of finance students and professional analysts use today, originated as a direct philosophical rebuttal to the speculative mania Williams witnessed firsthand. What follows traces the origin story of this model from its historical roots through its mechanics, its philosophical underpinnings, and its enduring relevance, giving readers both the “why it was invented” and the “how it works” that textbooks typically separate.
The market catastrophe that created a theory
Williams was not observing the 1920s bull market from a lecture hall. He was a working market participant, buying and selling securities through the decade’s most euphoric years, watching valuations detach from any recognisable measure of business performance. When the crash came, the disillusionment was not abstract. It was professional.
His response was unusual. Rather than leaving finance, Williams returned to Harvard to pursue doctoral study, a deliberate intellectual reckoning with the question of what had gone so fundamentally wrong. The thesis he produced, later published as The Theory of Investment Value in 1938, was simultaneously a diagnosis of speculative excess and a prescription for a sounder approach to valuing securities.
Three milestones frame Williams’ intellectual arc:
- Active participation in securities markets during the 1920s bull run, giving him firsthand exposure to the speculative culture he would later critique.
- His return to Harvard after the crash to pursue a doctorate, reframing the question of valuation from first principles.
- Publication of his thesis as a book in 1938, approximately 11 years before Graham’s The Intelligent Investor appeared in 1949.
Benjamin Graham, among the first reviewers of Williams’ published work, praised its emphasis on dividends as a corrective to the speculative habits of Wall Street. That endorsement from the most respected value investor of the era signalled that Williams had identified something the profession needed to hear.
When big ASX news breaks, our subscribers know first
Value from yield: Williams’s core philosophical insight
Williams began not with equations but with agriculture. He compared stocks to dairy cattle and fruit orchards, arguing that the value of any productive asset derives from what it consistently yields to its owner, not from what someone else might later pay for it. The analogy was deliberately concrete. A farmer does not value a cow by speculating on its resale price next season. The cow’s worth is the milk it produces over its productive life.
From this, Williams drew a distinction that became the conceptual spine of his entire model:
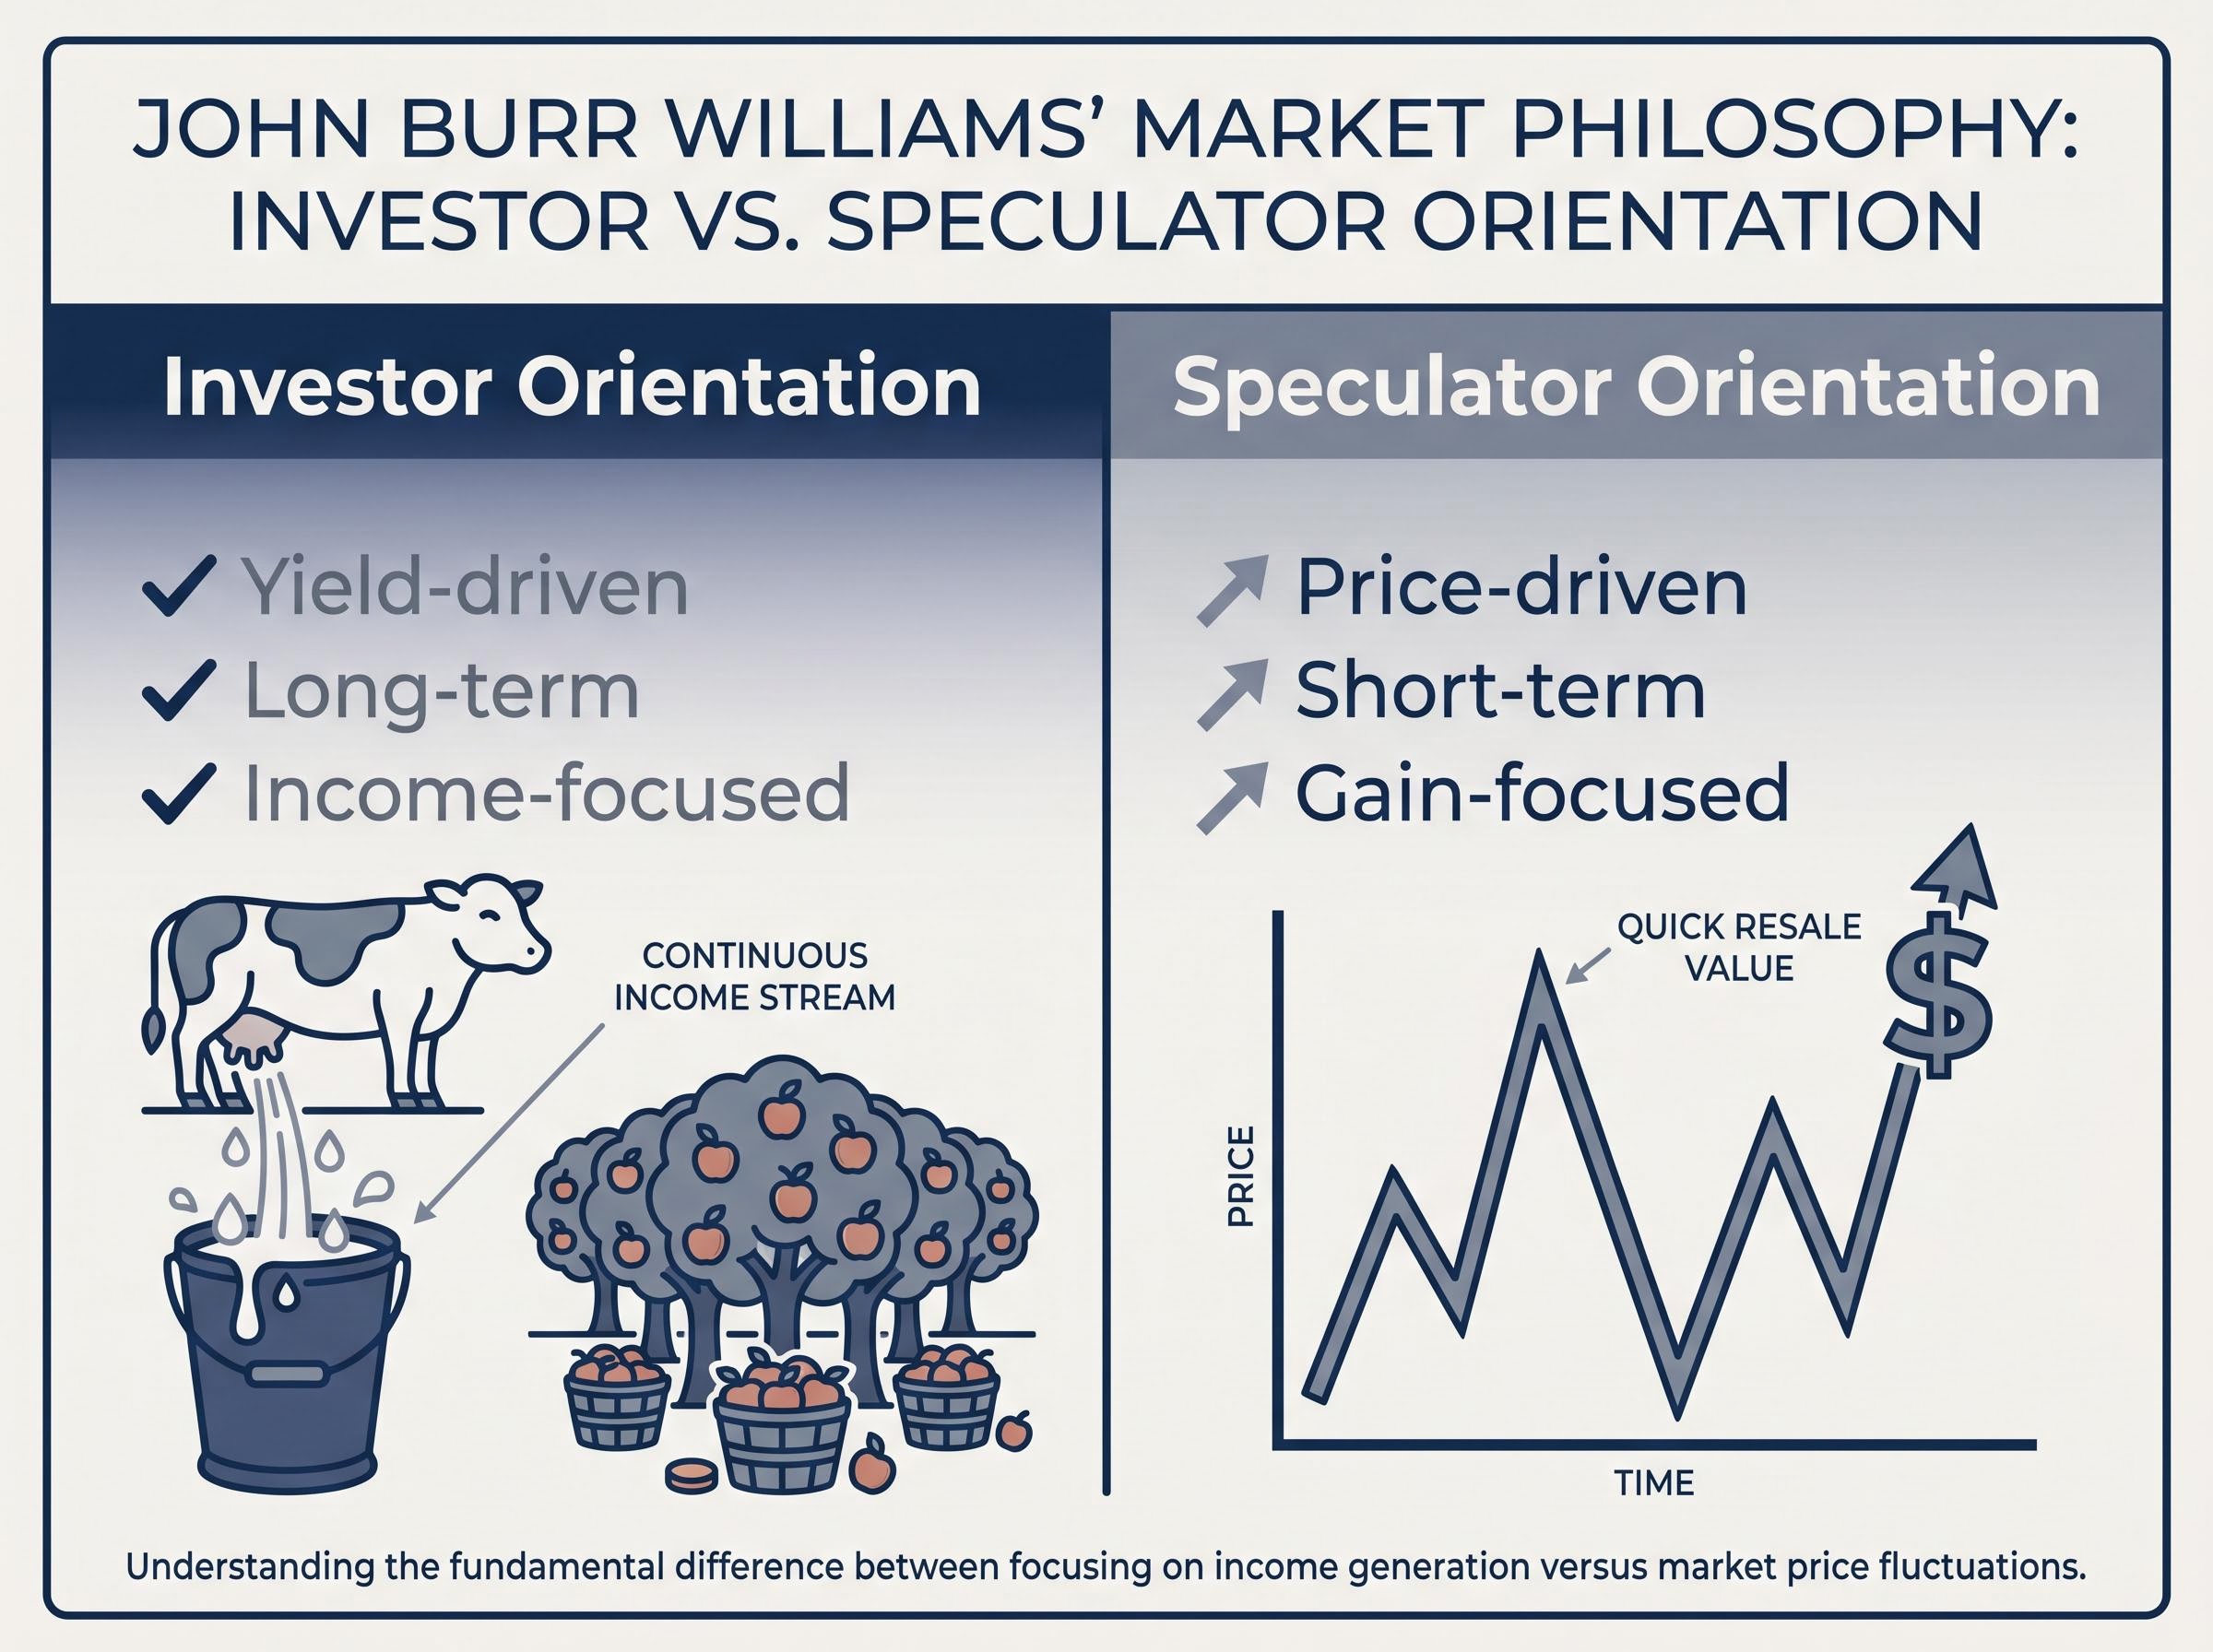
Williams characterised investors as buyers motivated by dividend income, seeking the recurring yield an asset delivers over time. Speculators, by contrast, pursued rapid price gains, buying securities primarily in the hope of selling them at a higher price. The difference, in Williams’ framing, was not merely one of temperament but of analytical method.
The contrast breaks down into two orientations:
- Investor orientation: yield-driven, long-term, income-focused, valuing the stream of cash an asset delivers.
- Speculator orientation: price-driven, short-term, gain-focused, valuing the asset only as a vehicle for resale.
Graham’s review of Williams’ work explicitly noted that the value of reinvested earnings should ultimately be measured by the future dividends they generate. The lineage of ideas runs clearly from Williams’ yield-based philosophy to Graham’s later “margin of safety” thinking.
Writing in Firstlinks in April 2026, the author Mark LaMonica, CFA, drew a parallel to the post-dot-com era, when income-focused investing re-emerged as a reaction to unfounded market hype. Williams’ distinction, forged in 1938, had repeated itself across generations.
How the dividend discount model actually works
The philosophy leads to a specific question: if a stock’s value is the stream of dividends it will deliver, how does an analyst calculate that value in practice?
The core formula translates Williams’ insight into arithmetic. Three components define it:
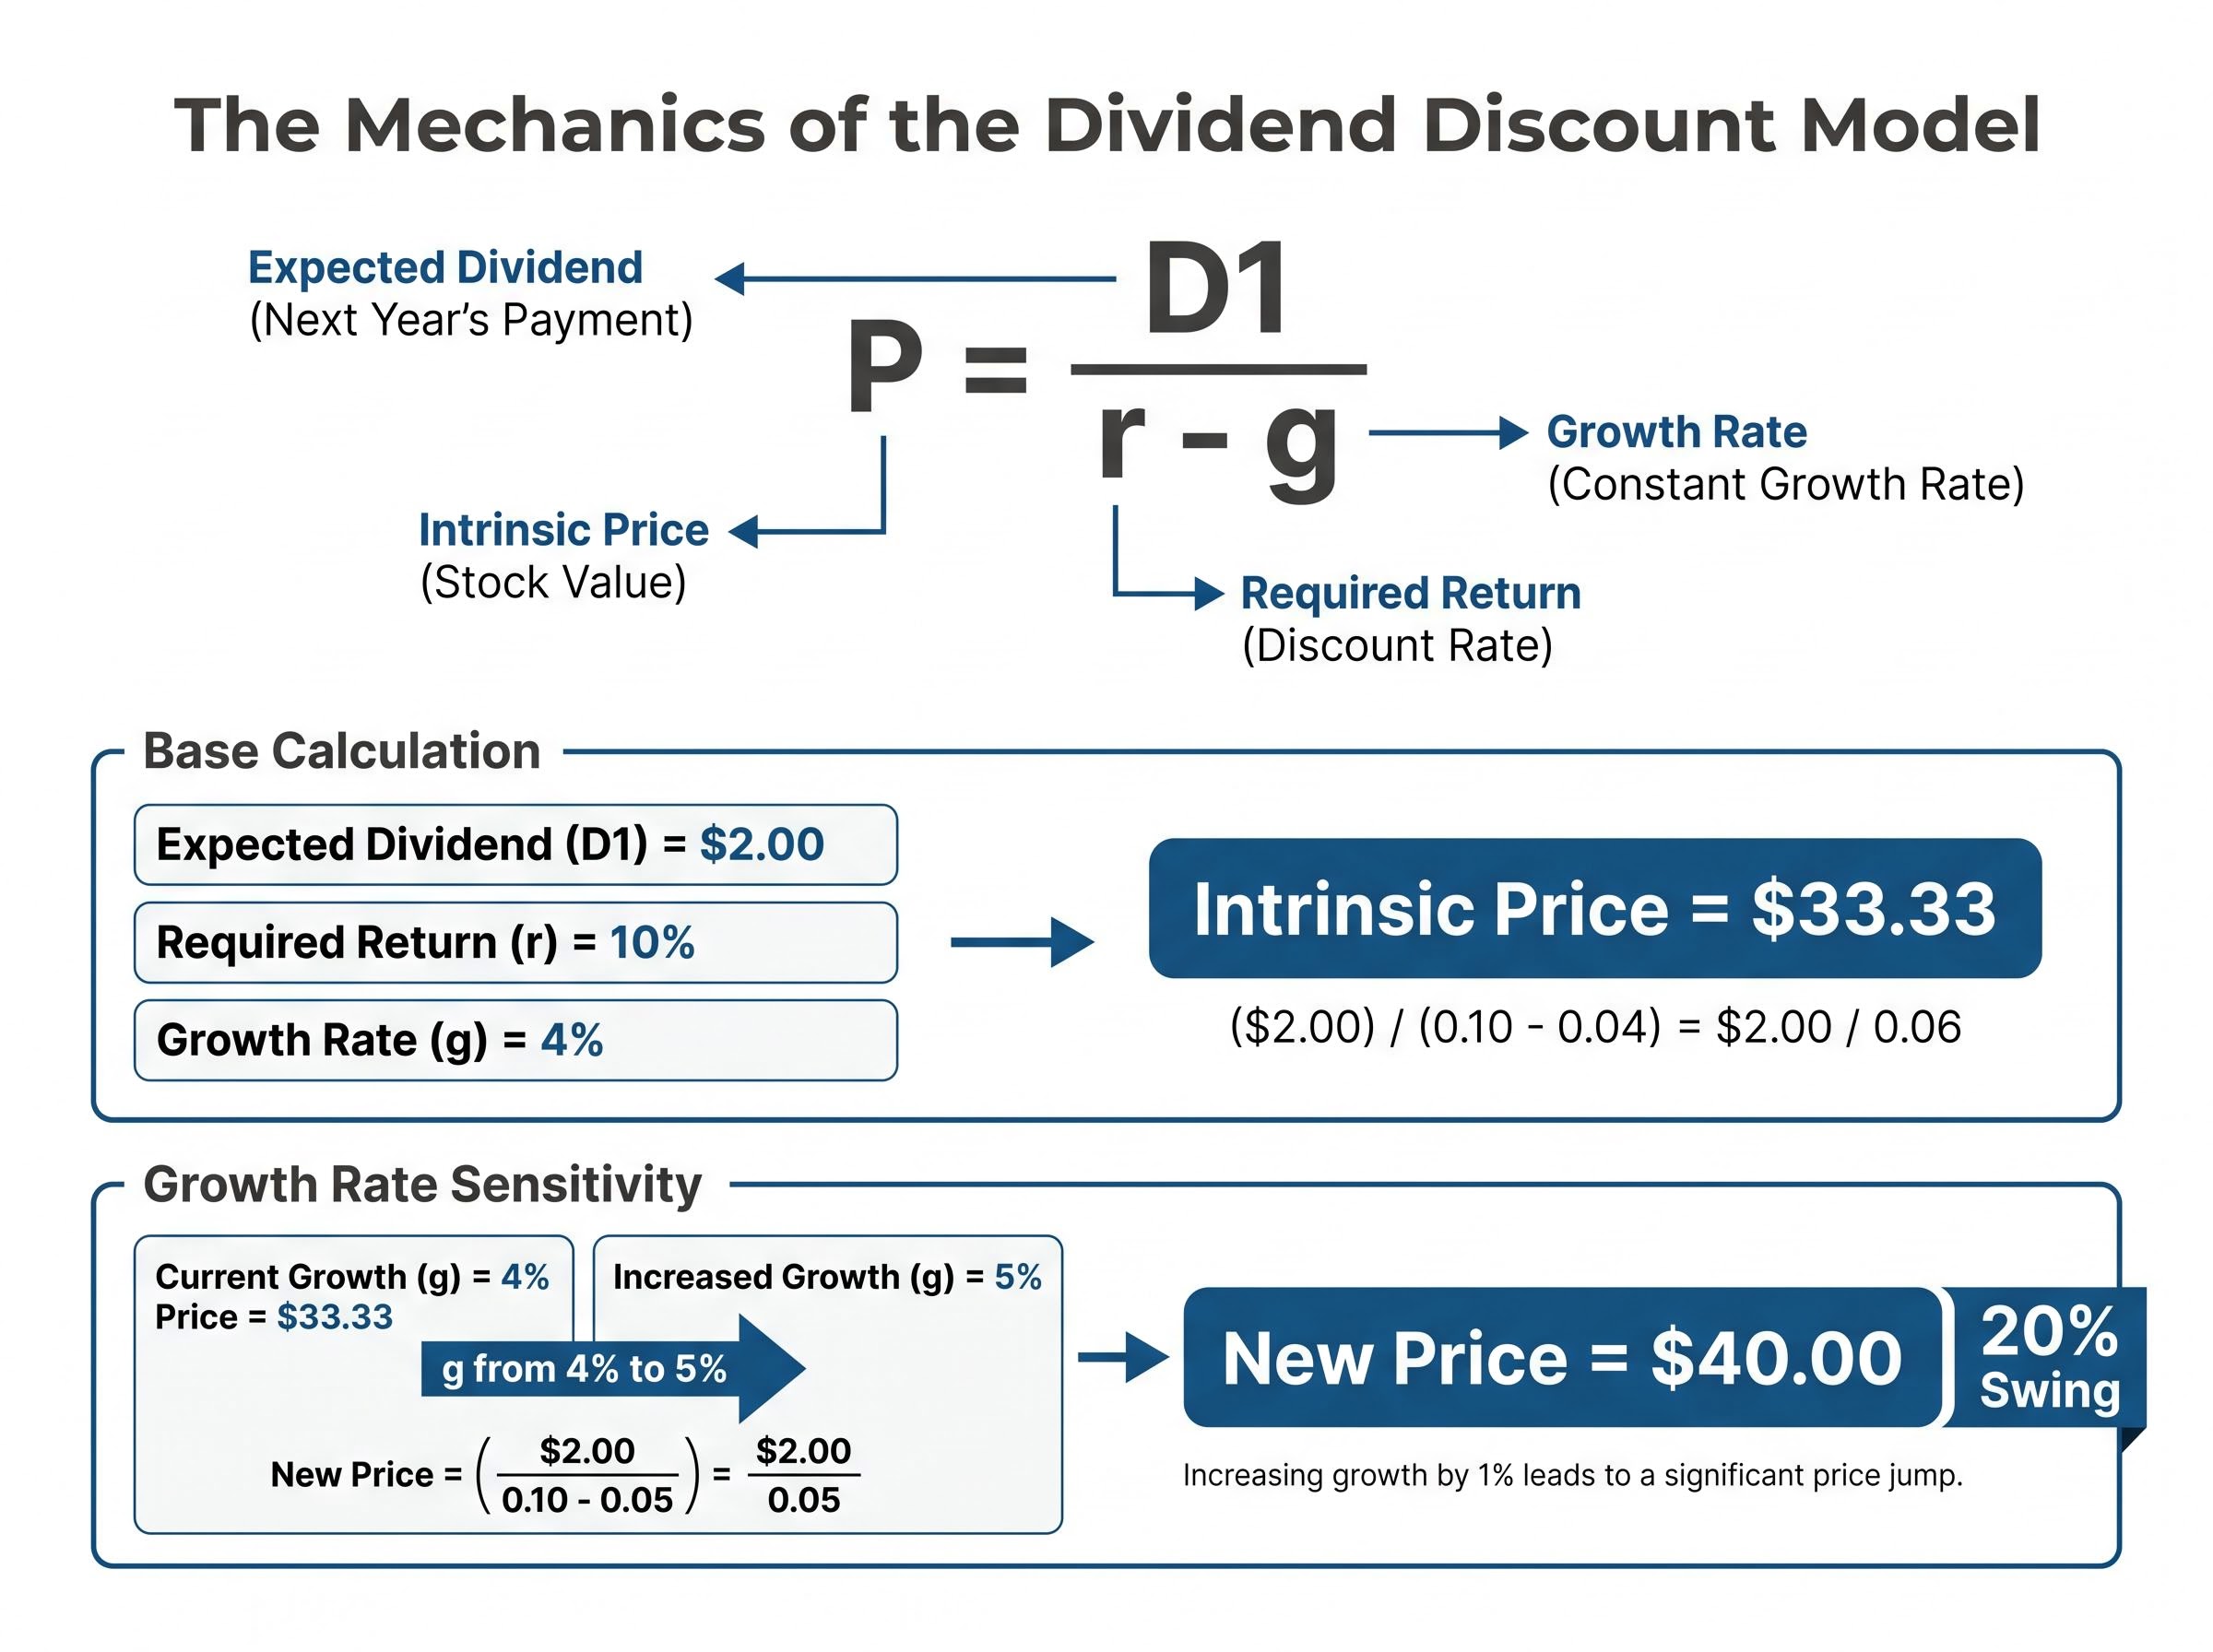
- D1 is the expected dividend in the next period, the first cash payment the investor anticipates receiving.
- r is the required rate of return, the minimum annual yield the investor demands for holding the stock rather than a risk-free alternative.
- g is the constant dividend growth rate, the annual percentage by which the dividend is expected to increase indefinitely.
The formula itself is: P = D1 / (r – g), where P is the intrinsic stock price. If a company is expected to pay a $2.00 dividend next year, the investor requires a 10% return, and dividends are expected to grow at 4% per year, the model values the stock at $33.33.
Gordon and Shapiro formalised this constant-growth variant in the 1956-1959 period, building directly on Williams’ 1938 framework. The CFA Institute includes the dividend discount model as a core component of its 2026 professional learning curriculum, placing it alongside more recent valuation approaches as a foundational skill.
The CFA Institute’s discounted dividend valuation framework explicitly traces the model’s origins to Williams’ 1938 work, positioning his discounted cash flow logic as the intellectual foundation from which all subsequent DDM variants were built.
| DDM Variant | Best Used When | Key Assumption |
|---|---|---|
| Gordon Growth Model | Company has stable, perpetual dividend growth | Constant growth rate continues indefinitely |
| Multi-Stage DDM | Company will shift growth rates over time | Distinct high-growth phase followed by stable-growth phase |
Which sectors suit the model best
The model’s reliability improves substantially when applied to mature, non-cyclical businesses where dividend trajectories are predictable. Four sectors stand out as natural fits: utilities (regulated revenues and consistent dividend policies), REITs (legally required to distribute a substantial portion of income), banks and insurers (consistent dividend histories tied to capital allocation frameworks), and consumer staples (stable, long-term payout records).
High-growth technology firms that reinvest earnings rather than distribute them, and cyclical businesses with irregular payouts, are poor fits. Their dividend trajectories are either non-existent or too volatile to forecast with the stability the model demands. In Williams’ original framing, these are speculator territory, not investor territory.
Navigating the constraints of dividend-based valuation
The model’s strengths come with honest constraints, and understanding them is what separates intelligent application from mechanical formula use.
Three primary criticisms recur in both academic and practitioner literature:
- Non-dividend applicability: The model cannot value companies that do not pay dividends, which excludes most high-growth technology firms and many younger businesses.
- Growth rate sensitivity: Small changes in the assumed growth rate (g) produce dramatically different valuations. Shifting g from 4% to 5% in the earlier example would move the intrinsic price from $33.33 to $40.00, a 20% swing from a single percentage point change.
- Discount rate estimation: Determining the appropriate required rate of return (r) is non-trivial and introduces additional estimation error, particularly across different market environments.
The second and third criticisms, however, apply equally to any discounted cash flow methodology. Growth rate sensitivity and discount rate uncertainty are general challenges of forecasting under uncertainty, not weaknesses unique to the dividend discount model. Recognising this reframes the critique: the issue is not that DDM is flawed in ways other models avoid, but that all present-value models share this fundamental dependence on assumption quality.
A 2026 asset management presentation specifically examined DDM estimation errors and the ongoing methodological debates these constraints generate. S&P Global reported 8.5% dividend growth in U.S. markets in 2024, illustrating that DDM-relevant conditions, stable and growing payouts, remain broadly present even as the model’s critics question its assumptions.
The model’s limitations do not prevent its continued institutional use. Intesa Sanpaolo’s Equity Strategy Report (December 2024/2025) applies DDM directly in institutional equity analysis, treating the constraints as calibration parameters rather than disqualifying flaws.
This article is for informational purposes only and should not be considered financial advice. Investors should conduct their own research and consult with financial professionals before making investment decisions.
Why Williams still matters 88 years after the crash
Nearly nine decades after Williams returned to Harvard to make sense of a market collapse, his framework remains institutionally active rather than merely historically interesting.
The evidence of ongoing use spans academic, professional, and regulatory contexts:
- The CFA Institute’s 2026 curriculum includes DDM in its refresher reading on “Analysis of Dividends and Share Repurchases.”
- A Morgan Stanley investment report in April 2026 cited Williams’ The Theory of Investment Value directly.
- Intesa Sanpaolo’s Equity Strategy Report (December 2024/2025) applies DDM in institutional equity analysis.
- A 2025 academic paper published in an MDPI journal cites Williams’ framework as foundational to its analysis.
- A 2025 article in Finance and Society (Cambridge) discusses Williams’ model in the context of uncertainty valuation.
Current global dividend trends reinforce the model’s relevance. Wall Street Horizon reported in September 2025 that 71.9% of tracked companies recorded positive dividend changes, confirming accelerating global dividend growth. Morningstar reported positive fund flows into dividend-focused strategies in Q4 2025 amid macroeconomic uncertainty. The conditions Williams’ model was built to analyse, consistent and growing shareholder distributions, are more widespread today than in many prior decades.
The S&P Global dividend outlook for 2025 projected global aggregate dividends reaching $2.3 trillion, with regional and sector-level growth trends confirming that the stable, growing payout conditions Williams’ model was designed to analyse remain structurally present across major markets.
DDM in hybrid valuation practice today
In contemporary institutional investing, DDM is frequently combined with discounted cash flow (DCF) models in hybrid valuation approaches. This allows analysts to cross-check dividend behaviour against total cash flow generation, capturing a more complete picture of a company’s value.
The hybrid approach is a natural extension of Williams’ original logic. If all other cash flows ultimately serve the purpose of growing future dividends, then integrating both models captures the full picture Williams’ formula implied but did not formalise. The combination is evolution, not departure.
The one question Williams wanted investors to ask first
Williams embedded a single question at the heart of his model, and it remains the most useful thing he left behind: what will this asset actually pay me, and over what time horizon?
The question sounds simple. Its discipline is not. It forces the analyst to look past the price on a screen and focus on what a business actually delivers to its owners. Contemporary income-focused investors who build passive income streams designed to outpace inflation over time are, whether they know it or not, answering the same question Williams posed in 1938.
The dividend discount model is ultimately less a formula than a discipline. It reorients the valuation process away from what the market says a stock is worth today and toward what the business will return to the person who holds it. For readers looking to apply this thinking, the investor-versus-speculator distinction Williams made nearly nine decades ago remains a practical first filter: before running the numbers, determine which side of that line the investment sits on.
Past performance does not guarantee future results. Financial projections are subject to market conditions and various risk factors.