
Australia’s headline inflation rate surged to 4.6% in March 2026, its sharpest annual reading in recent memory, propelled by a fuel price spike that has not been seen since 2017. The quarterly Consumer Price Index (CPI) data from the Australian Bureau of Statistics (ABS) arrives at a moment when the Reserve Bank of Australia (RBA) is preparing for its May 2026 meeting, underlying inflation is already tracking above the target band midpoint, and two of the most visible household cost pressures, energy and fuel, are pulling in different directions depending on where in the data one looks.
What follows is an analysis of what the March 2026 headline figure actually reflects versus what is happening beneath it in the trimmed mean, the specific cost drivers hitting Australian households right now, and what the data signals about where interest rates may be headed.
The headline jumped to 4.6%, but the underlying story is more complicated
The 4.6% annual CPI reading for March 2026, up from 3.7% in February, carries a jolt of alarm. It arrived slightly below the 4.7-4.8% range that NAB and market consensus had forecast, but it still represents the kind of headline number that draws attention and political response.
The key figures at a glance:
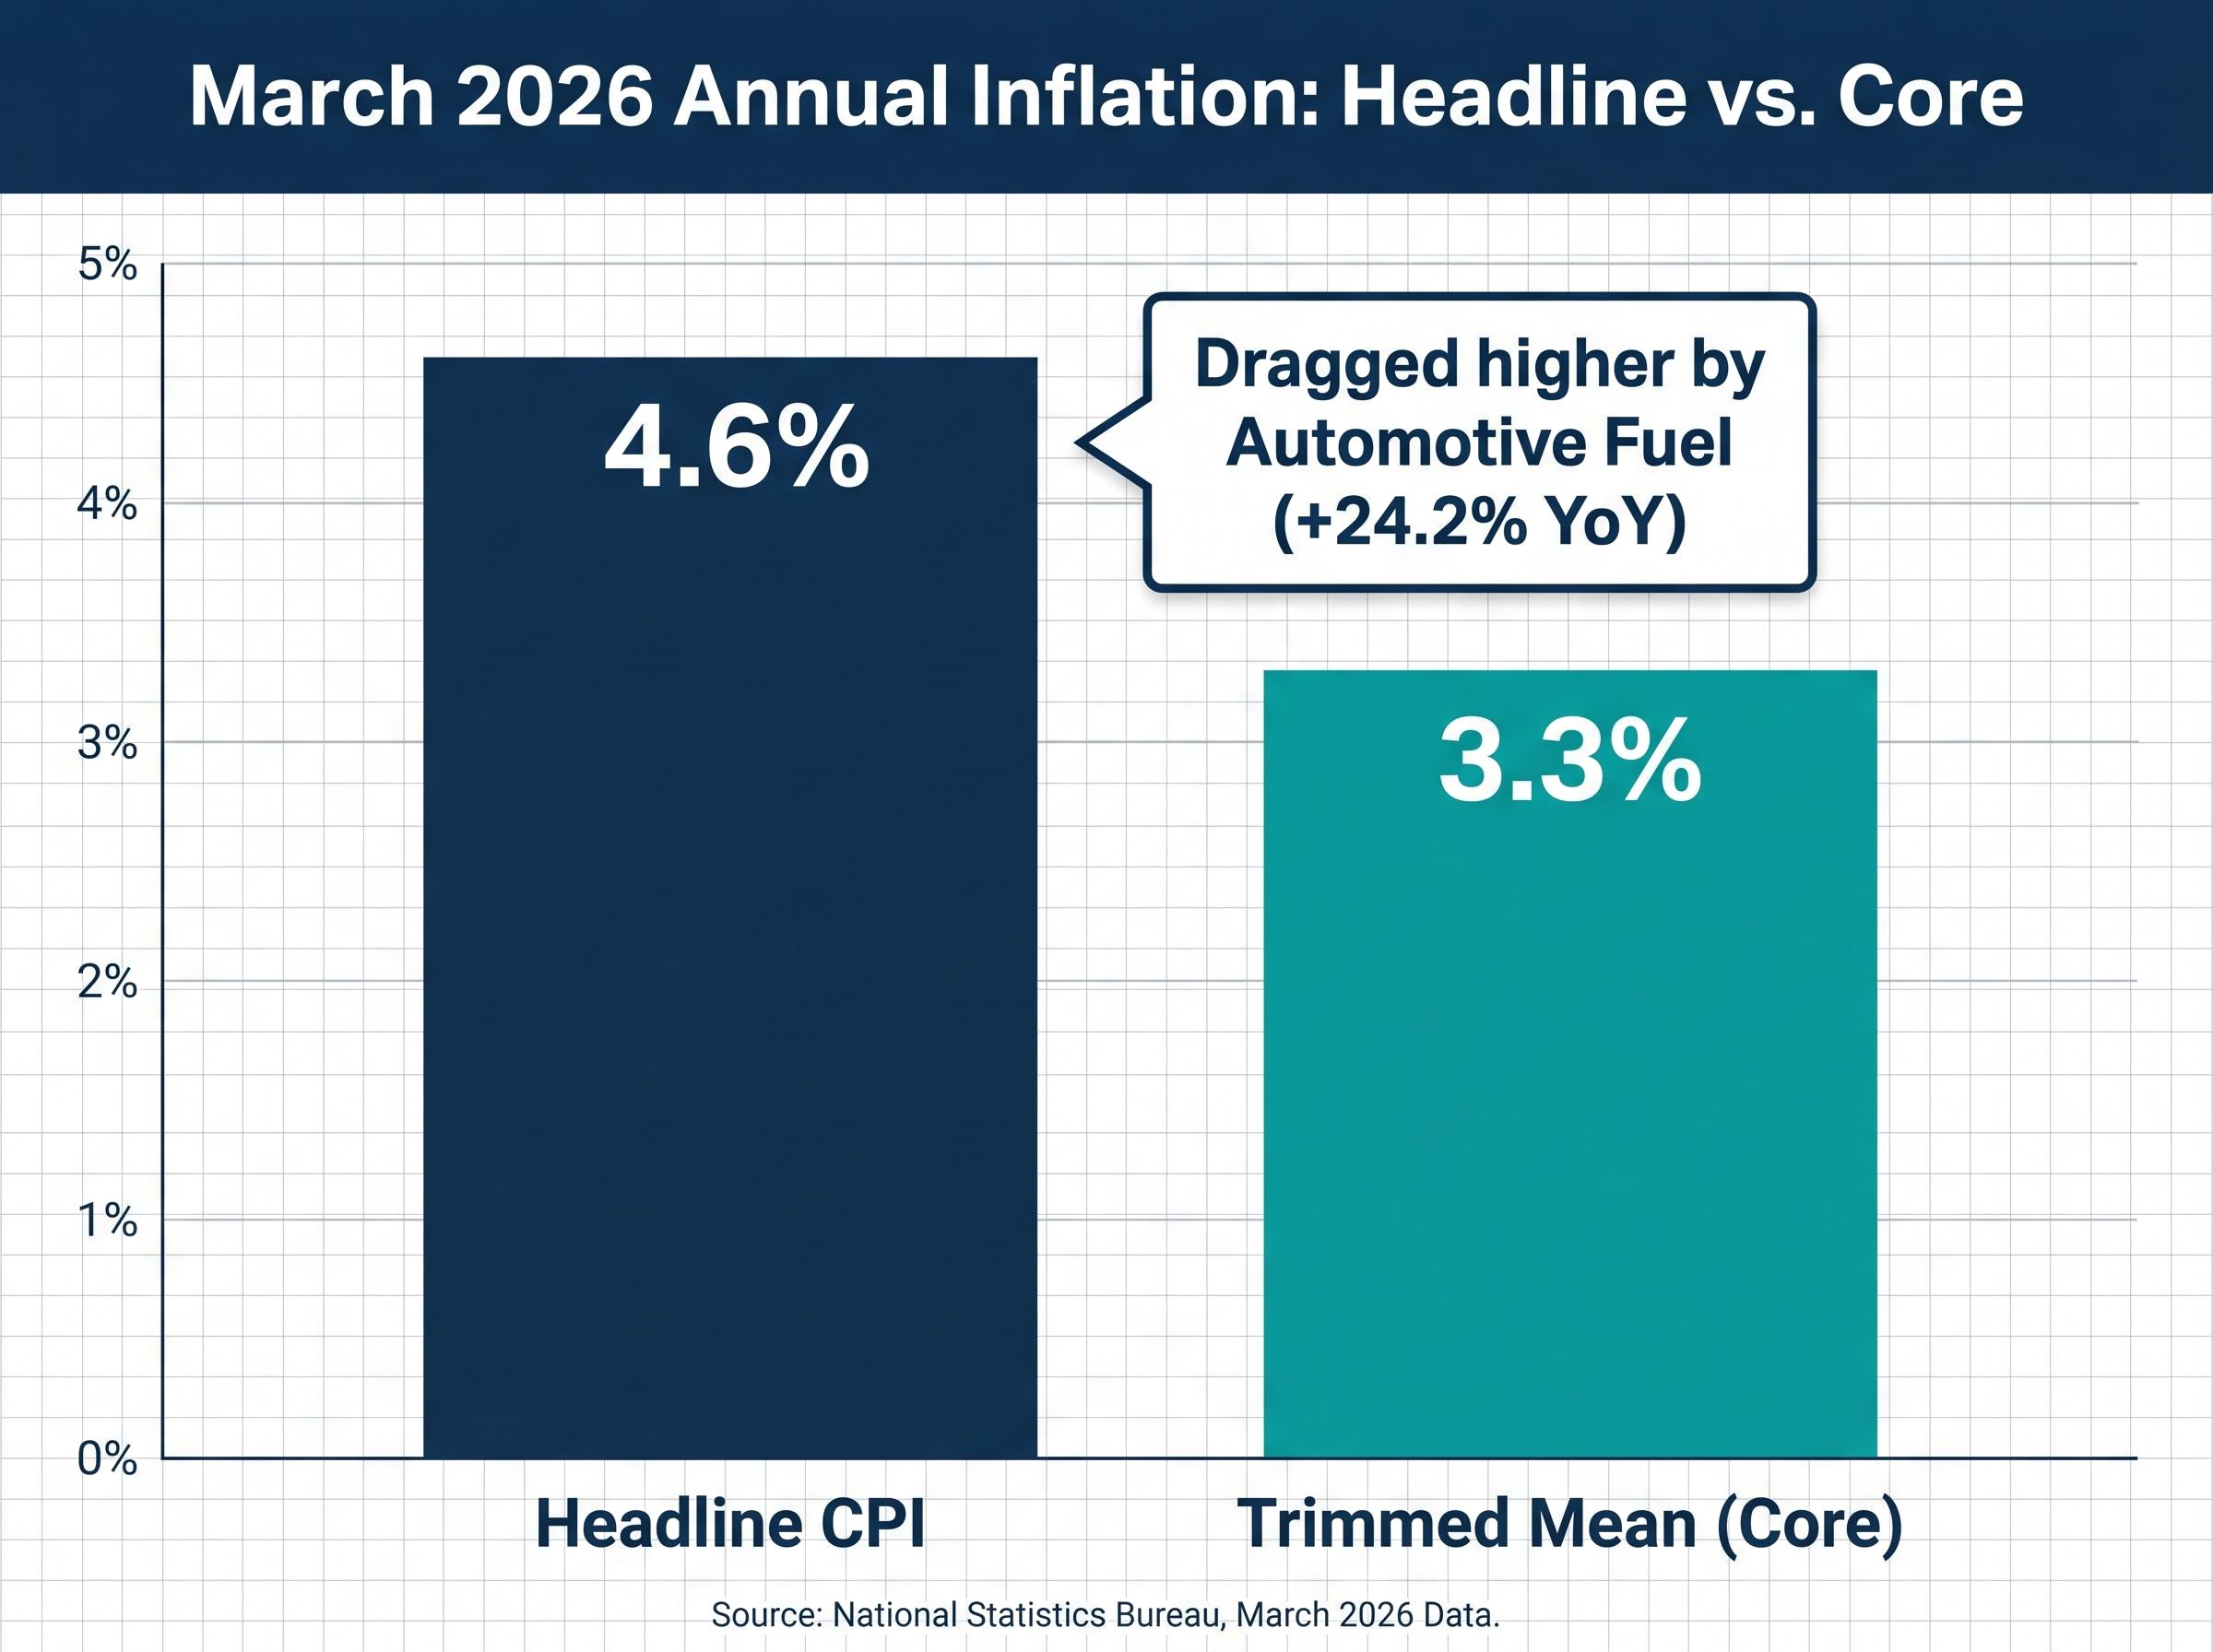
- Headline CPI: 4.6% year-on-year
- Trimmed mean (annual): 3.3% year-on-year, unchanged from the prior period
- Trimmed mean (monthly): 0.3% month-on-month in March, up from 0.2% the prior month
- Quarterly trimmed mean (Q1 2026): 0.8% quarter-on-quarter, 3.5% year-on-year
The gap between 4.6% on the headline and 3.3% on the trimmed mean tells a specific story: a single volatile component, automotive fuel, dragged the headline higher while the broader basket moved more modestly. The quarterly trimmed mean of 0.8% landed 0.1 percentage points below both NAB’s forecast and the RBA’s February Statement on Monetary Policy projection. That small undershoot offers mild comfort, but it is not a signal that price pressures are fading.
Roughly two-thirds of tracked CPI items are rising at an annualised pace exceeding 3%, indicating that inflation breadth, not just the headline, remains a concern.
Why the trimmed mean is the number the RBA watches most
The trimmed mean strips out the most extreme price movements in either direction each quarter, removing both the sharpest spikes and the steepest falls. What remains is a cleaner read on persistent inflation, the kind of price pressure that does not reverse when a single commodity corrects.
The RBA inflation measurement framework formally defines the trimmed mean as the central bank’s preferred gauge of underlying inflation, stripping the most volatile price movements from the quarterly CPI basket to isolate persistent cost pressures that monetary policy is best positioned to address.
According to NAB, core inflation was already tracking at approximately 3.5% before the oil shock hit Australian fuel prices. NAB described this as an unfavourable starting position, one that leaves the RBA with limited room to dismiss the headline surge as purely transitory.
When big ASX news breaks, our subscribers know first
Fuel costs surged at a pace not seen since 2017, and the numbers reflect a conflict playing out overseas
Automotive fuel prices rose 32.8% month-on-month in March 2026, the strongest monthly increase since 2017, and 24.2% year-on-year.
That figure is the single largest contributor to the March headline CPI jump and to goods inflation more broadly. It is not a symptom of domestic overheating. The surge traces directly to Middle East conflict escalation affecting global oil supply, an externally imposed shock that Australian monetary policy cannot control.
An important timing caveat applies: the fuel excise tax reduction had not yet taken effect when March CPI data was collected. Any moderating impact from that policy will only appear in subsequent quarters.
The downstream effects are already visible and expected to widen:
- Goods inflation overall reached 5.5% annual, driven substantially by fuel
- Transport inflation hit 8.9% annual
- NAB has flagged that the fuel spike renders Q1 CPI data somewhat backward-looking, with more significant pass-through into supply chain and logistics costs expected in Q2 and Q3 2026
For Australian households, the pain at the bowser is immediate. The secondary wave, as energy and logistics costs filter through to the prices of goods and services that depend on transport, is still building.
How to read Australian CPI data: what the ABS actually measures and why it matters
The ABS measures inflation by tracking the prices of a representative basket of goods and services that Australian households commonly purchase. The process follows three steps:
- The ABS defines and weights a basket of items reflecting typical household spending patterns across categories including food, housing, transport, and health
- Prices are collected quarterly (and monthly for a subset of items) from retailers, service providers, and government sources across Australian capital cities
- Price changes are aggregated into an index, with the annual percentage change reported as the CPI inflation rate
The distinction between tradables and non-tradables is one of the most useful frameworks for reading any CPI release. Tradable items are internationally exposed goods whose prices are influenced by global markets; non-tradable items are domestically driven services and costs that reflect local supply and demand conditions.
| CPI Category | Type | March 2026 Annual Change | Key Driver |
|---|---|---|---|
| Automotive Fuel | Tradable | +24.2% | Global oil supply disruption |
| Electricity | Non-tradable | +25.4% | Lapse of government rebate |
| Rents | Non-tradable | +3.7% | Domestic housing supply |
| Housing (overall) | Non-tradable | +6.5% | Construction costs, shelter demand |
| Market Services (ex. rents) | Non-tradable | Above 3% | Domestic labour and input costs |
Market services inflation excluding rents ran at 0.27% month-on-month in March, remaining above 3% on a year-ended basis. This framework explains why the headline CPI and trimmed mean can diverge so sharply: when a volatile tradable component like fuel spikes, the headline absorbs the full impact, while the trimmed mean strips it out to reveal what persistent domestic cost pressures are actually doing.
For readers wanting a deeper grounding in how the RBA uses monetary policy to respond to both demand-pull and cost-push inflation, our dedicated guide to CPI and rate hikes in Australia walks through why rate hikes are more effective against domestic demand pressures than against supply-driven oil shocks, and what that distinction means for mortgage holders and fixed-income earners facing a prolonged above-target inflation period.
Electricity and housing costs reveal the domestic inflation problem that predates the fuel shock
Even without the global fuel disruption, Australian households were already facing structurally elevated costs in categories they cannot easily reduce. Electricity and housing tell this story clearly.
Electricity prices rose 25.4% annually in March 2026. The month-on-month figure was flat in March, but that followed a substantial spike in January 2026 when annual electricity inflation hit 32.2%.
The January 2026 electricity spike of +32.2% annual was directly linked to the lapse of the Energy Bill Relief Fund extension payments, a policy-driven price change rather than an underlying cost surge.
Without new government intervention, that year-on-year comparison is unlikely to moderate through 2026. The rebate removal effectively reset the base from which electricity costs are measured.
Rents are easing slightly, but new dwelling costs are moving the other way
The housing picture sends mixed signals:
- Rent deceleration: Monthly rent growth slowed to 0.2% month-on-month in March, down from a gradual upward trend in prior months. The annual rate remains +3.7%, but the direction is modestly encouraging for renters.
- New dwelling cost acceleration: New dwelling purchase costs rose 0.48% month-on-month in March, a sharp acceleration from 0.15% in February. This is an upside risk for future inflation readings.
Housing overall remains at +6.5% annual. NAB has assessed that oil-derived materials, energy, and logistics costs are likely to feed into construction costs in Q2 and Q3 2026, meaning the new dwelling cost acceleration may worsen before it improves. For prospective home buyers and existing mortgage holders, shelter costs look set to remain a significant budget pressure through the year.
What Q1 2026 inflation data signals for the RBA’s May 2026 rate decision
NAB has forecast a 25 basis point rate hike at the May 2026 RBA meeting. The analytical case rests on the data covered above: core inflation was already tracking at approximately 3.5% before the oil shock, underlying inflation remains above the RBA’s 2-3% target band midpoint, and the most acute price pressures from the fuel and energy shock had barely begun filtering through supply chains when Q1 data was collected.
NAB described core inflation at approximately 3.5% before the oil shock as an “unfavourable starting position” for the RBA, one that limits the central bank’s ability to look through the headline surge.
The specific concern NAB has flagged is second-round price effects: energy and fuel costs working through supply chains into the prices of goods and services in Q2 and Q3 2026. These effects were not yet visible in the Q1 data.
A critical timing constraint shapes the May decision. The RBA will be meeting before the next CPI data point arrives.
| Event | Date | Significance |
|---|---|---|
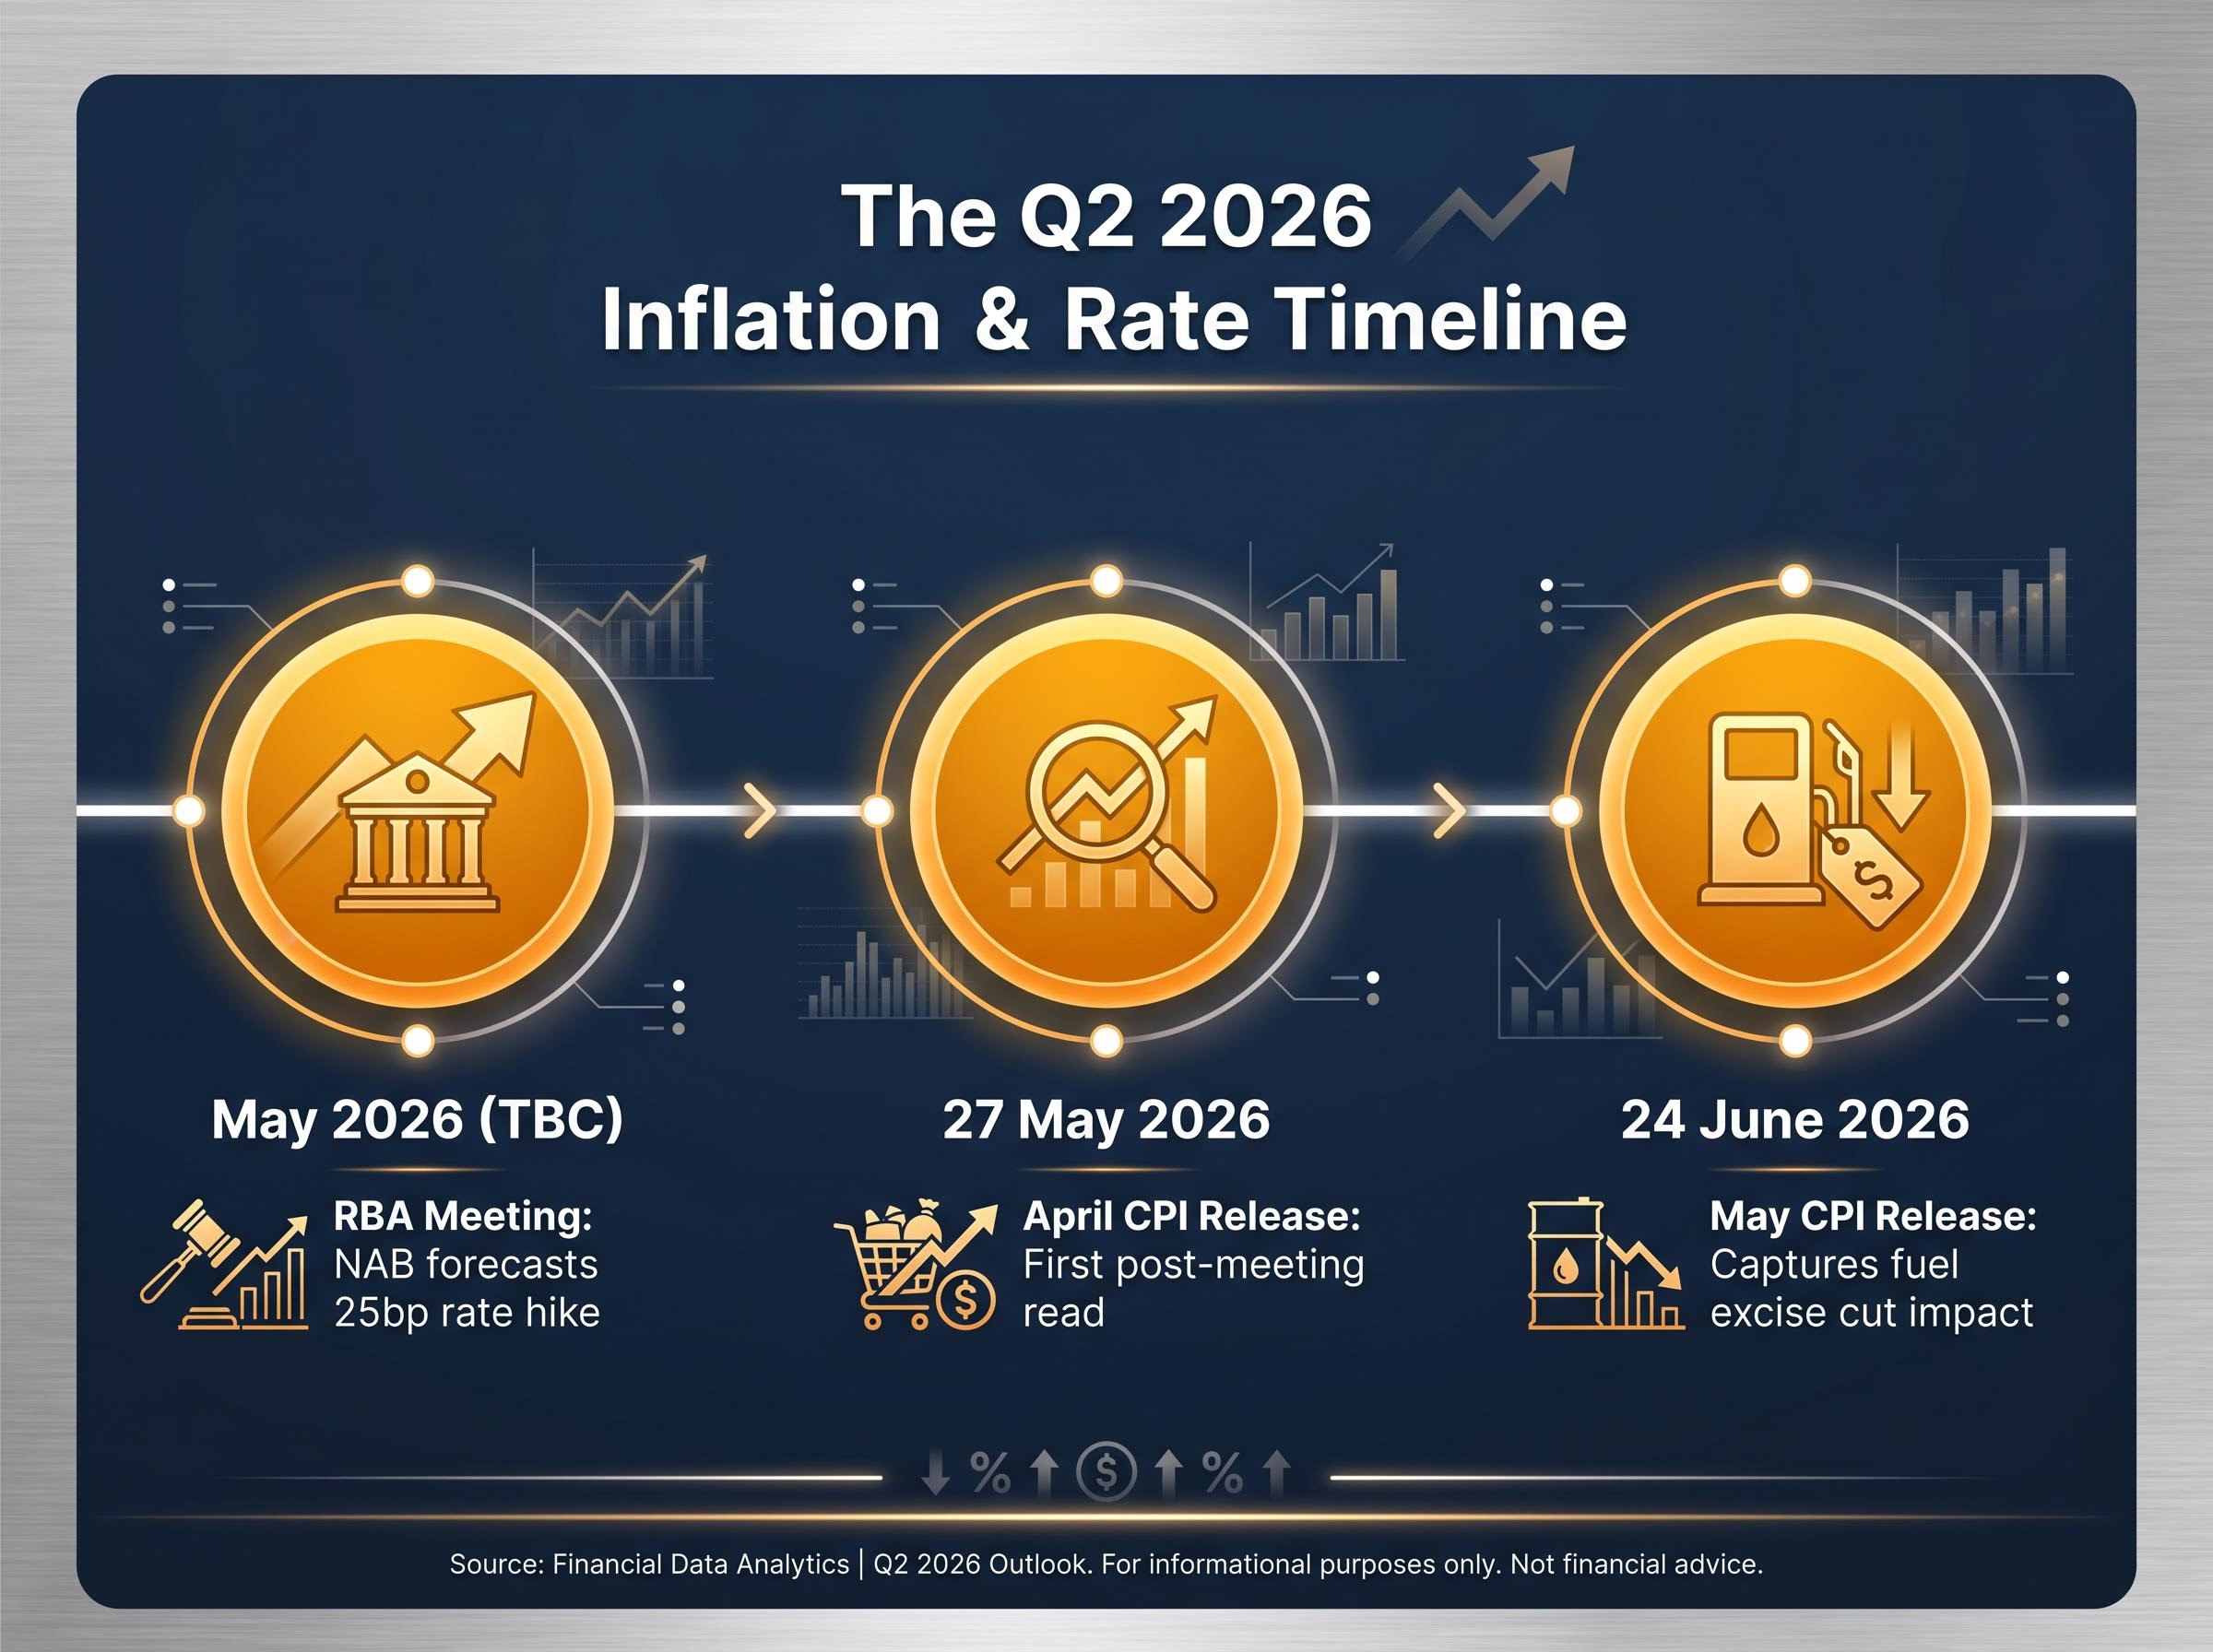
| RBA May 2026 meeting | May 2026 (date to be confirmed) | Rate decision based on Q1 CPI data |
| April 2026 CPI release | 27 May 2026 | First post-meeting inflation read |
| May 2026 CPI release | 24 June 2026 | First data capturing fuel excise cut impact |
NAB has also flagged upside risk that the cash rate may need to go higher than its central forecast if second-round effects materialise as expected. For anyone with a variable-rate mortgage, a business managing input costs, or a household budgeting for the year ahead, the May meeting is a near-term inflection point that could add directly to monthly repayment costs.
Oil futures backwardation, where forward contracts price crude materially below spot, signals that institutional capital views the current Hormuz-driven supply disruption as temporary rather than structural; this market expectation is one reason the trimmed mean has remained relatively anchored even as the headline surged, and it shapes how the RBA is likely to weigh the transitory versus persistent distinction when setting policy in May.
Three things the Q1 2026 data tells Australians about their cost-of-living outlook right now
The analytical threads from the Q1 data converge on three specific takeaways:
- The fuel shock is acute now but carries a longer tail. The 32.8% monthly surge will moderate once the fuel excise cut takes effect, but the second-round pass-through into grocery prices, freight costs, and services bills is expected to build through Q2 and Q3 2026. Relief at the bowser will not mean relief everywhere.
- Electricity costs are structurally higher without new policy intervention. The +25.4% annual figure reflects the lapse of the Energy Bill Relief Fund, and no replacement mechanism has been identified. Year-on-year electricity comparisons are likely to remain elevated through 2026.
- Rent growth is easing marginally, but housing costs are not. The 0.2% month-on-month rent deceleration is real, but housing overall sits at +6.5% annually, and new dwelling purchase costs are accelerating. The oil-derived cost pressures flowing into construction materials mean the shelter category faces further upside risk.
Roughly two-thirds of CPI items are annualising above 3%, a breadth-of-inflation measure that confirms cost-of-living pressure is not concentrated in one area but spread across the spending profiles of most Australian households.
Investors wanting to translate the Q1 2026 inflation data into portfolio positioning will find our full explainer on ASX sector rotation during oil shocks covers the specific winners and losers in detail, including why energy producers like Woodside and Santos have gained approximately 40% year-to-date while airline margins, mining cost structures, REIT valuations, and high-growth technology names each face distinct headwinds through separate cost and discount-rate channels.
This article is for informational purposes only and should not be considered financial advice. Investors should conduct their own research and consult with financial professionals before making investment decisions.
Australia’s inflation data is still writing itself, and Q2 2026 will be the real test
The Q1 trimmed mean came in marginally below expectations. That is the good news. The less comfortable reality is that the energy shock dominating the headlines had barely registered in supply chain costs when this data was collected.
Three pressure points warrant close attention through mid-2026: fuel prices and whether the excise cut delivers meaningful pass-through at the bowser; electricity costs without new government relief; and the acceleration in new dwelling costs feeding into broader shelter inflation.
The next two CPI releases, 27 May and 24 June 2026, will determine whether the inflation outlook stabilises or the RBA faces pressure to act beyond May. The data is still writing itself.
The RBA rate hike cycle peak and the timing of any subsequent pivot matter as much as the May decision itself: Oxford Economics modelling points to potential back-to-back quarterly GDP contractions in Australia for June and September 2026, a growth deterioration that historically forces central banks to shift from inflation-fighting mode to recession-prevention within a 6-12 month window of a supply shock’s peak.
Past performance does not guarantee future results. Financial projections are subject to market conditions and various risk factors.