A 3-Layer Portfolio Strategy for Volatile ASX Markets
3 mins ago

Oil futures are pricing Brent crude at roughly $66.50 for March 2027, even as the spot price sits at $116.62 today. That gap is not a market anomaly. It is the market’s clearest signal that the current inflation shock may be far shorter than the RBA’s rate hike path implies.
The Q1 2026 CPI print of 4.6% and two consecutive RBA hikes to 4.10% have rattled Australian investors. With market pricing implying a potential terminal rate of 4.60% by year-end, many investors are doing one of two things: holding cash and waiting, or repositioning defensively in ways that may actually harm their long-term returns. Both responses may be premature.
This guide explains why the current rate hike cycle may be shorter than markets expect, what historical supply shocks reveal about central bank pivots, and how Australian investors can position across ASX-listed ETFs in diversified equities, investment-grade bonds, and cash equivalents to benefit from the environment both now and when the cycle turns.
The Q1 2026 headline CPI figure of 4.6% is uncomfortable. But the nature of the inflation matters more than the number itself.
This episode is supply-driven, not demand-driven. The Iran war oil shock has pushed energy costs sharply higher, and those costs have flowed through to transport, food logistics, and manufacturing input prices. Pitcher Partners noted in April 2026 that oil-driven inflation is supply-side in nature and cannot be directly addressed by monetary policy. The RBA’s rate hikes address demand. They do not fix a supply constraint in the Strait of Hormuz.
That distinction matters because supply-driven inflation episodes historically resolve faster than demand-driven ones. The RBA projects underlying inflation (trimmed mean) peaking at 3.7% around mid-2026, then easing. The policy dilemma is real: the RBA must act to prevent inflation expectations from becoming unanchored, yet the tool it wields does not directly address the underlying cause. Each additional percentage point of inflation above 3% in a developed economy reduces real GDP growth by approximately 0.1-0.2 percentage points, according to IMF research, which means over-tightening carries its own costs.
The 1970s comparison collapses when the structural backdrop is examined. In 2026, four disinflationary forces are active simultaneously, none of which existed during the stagflation era:
These forces were absent during the 1970s episode, making direct historical comparison misleading. The current shock is an energy price spike imposed on a structurally disinflationary global economy, not a repeat of the demand-wage spiral that defined the earlier era.
The numbers come first. They tell the story clearly enough.
Brent crude spot price: $116.62 per barrel (29 April 2026). March 2027 Brent futures: approximately $66.50 per barrel. Implied decline: nearly $50 per barrel over 11 months.
That is a 43% implied decline priced into one of the most liquid commodity markets in the world.
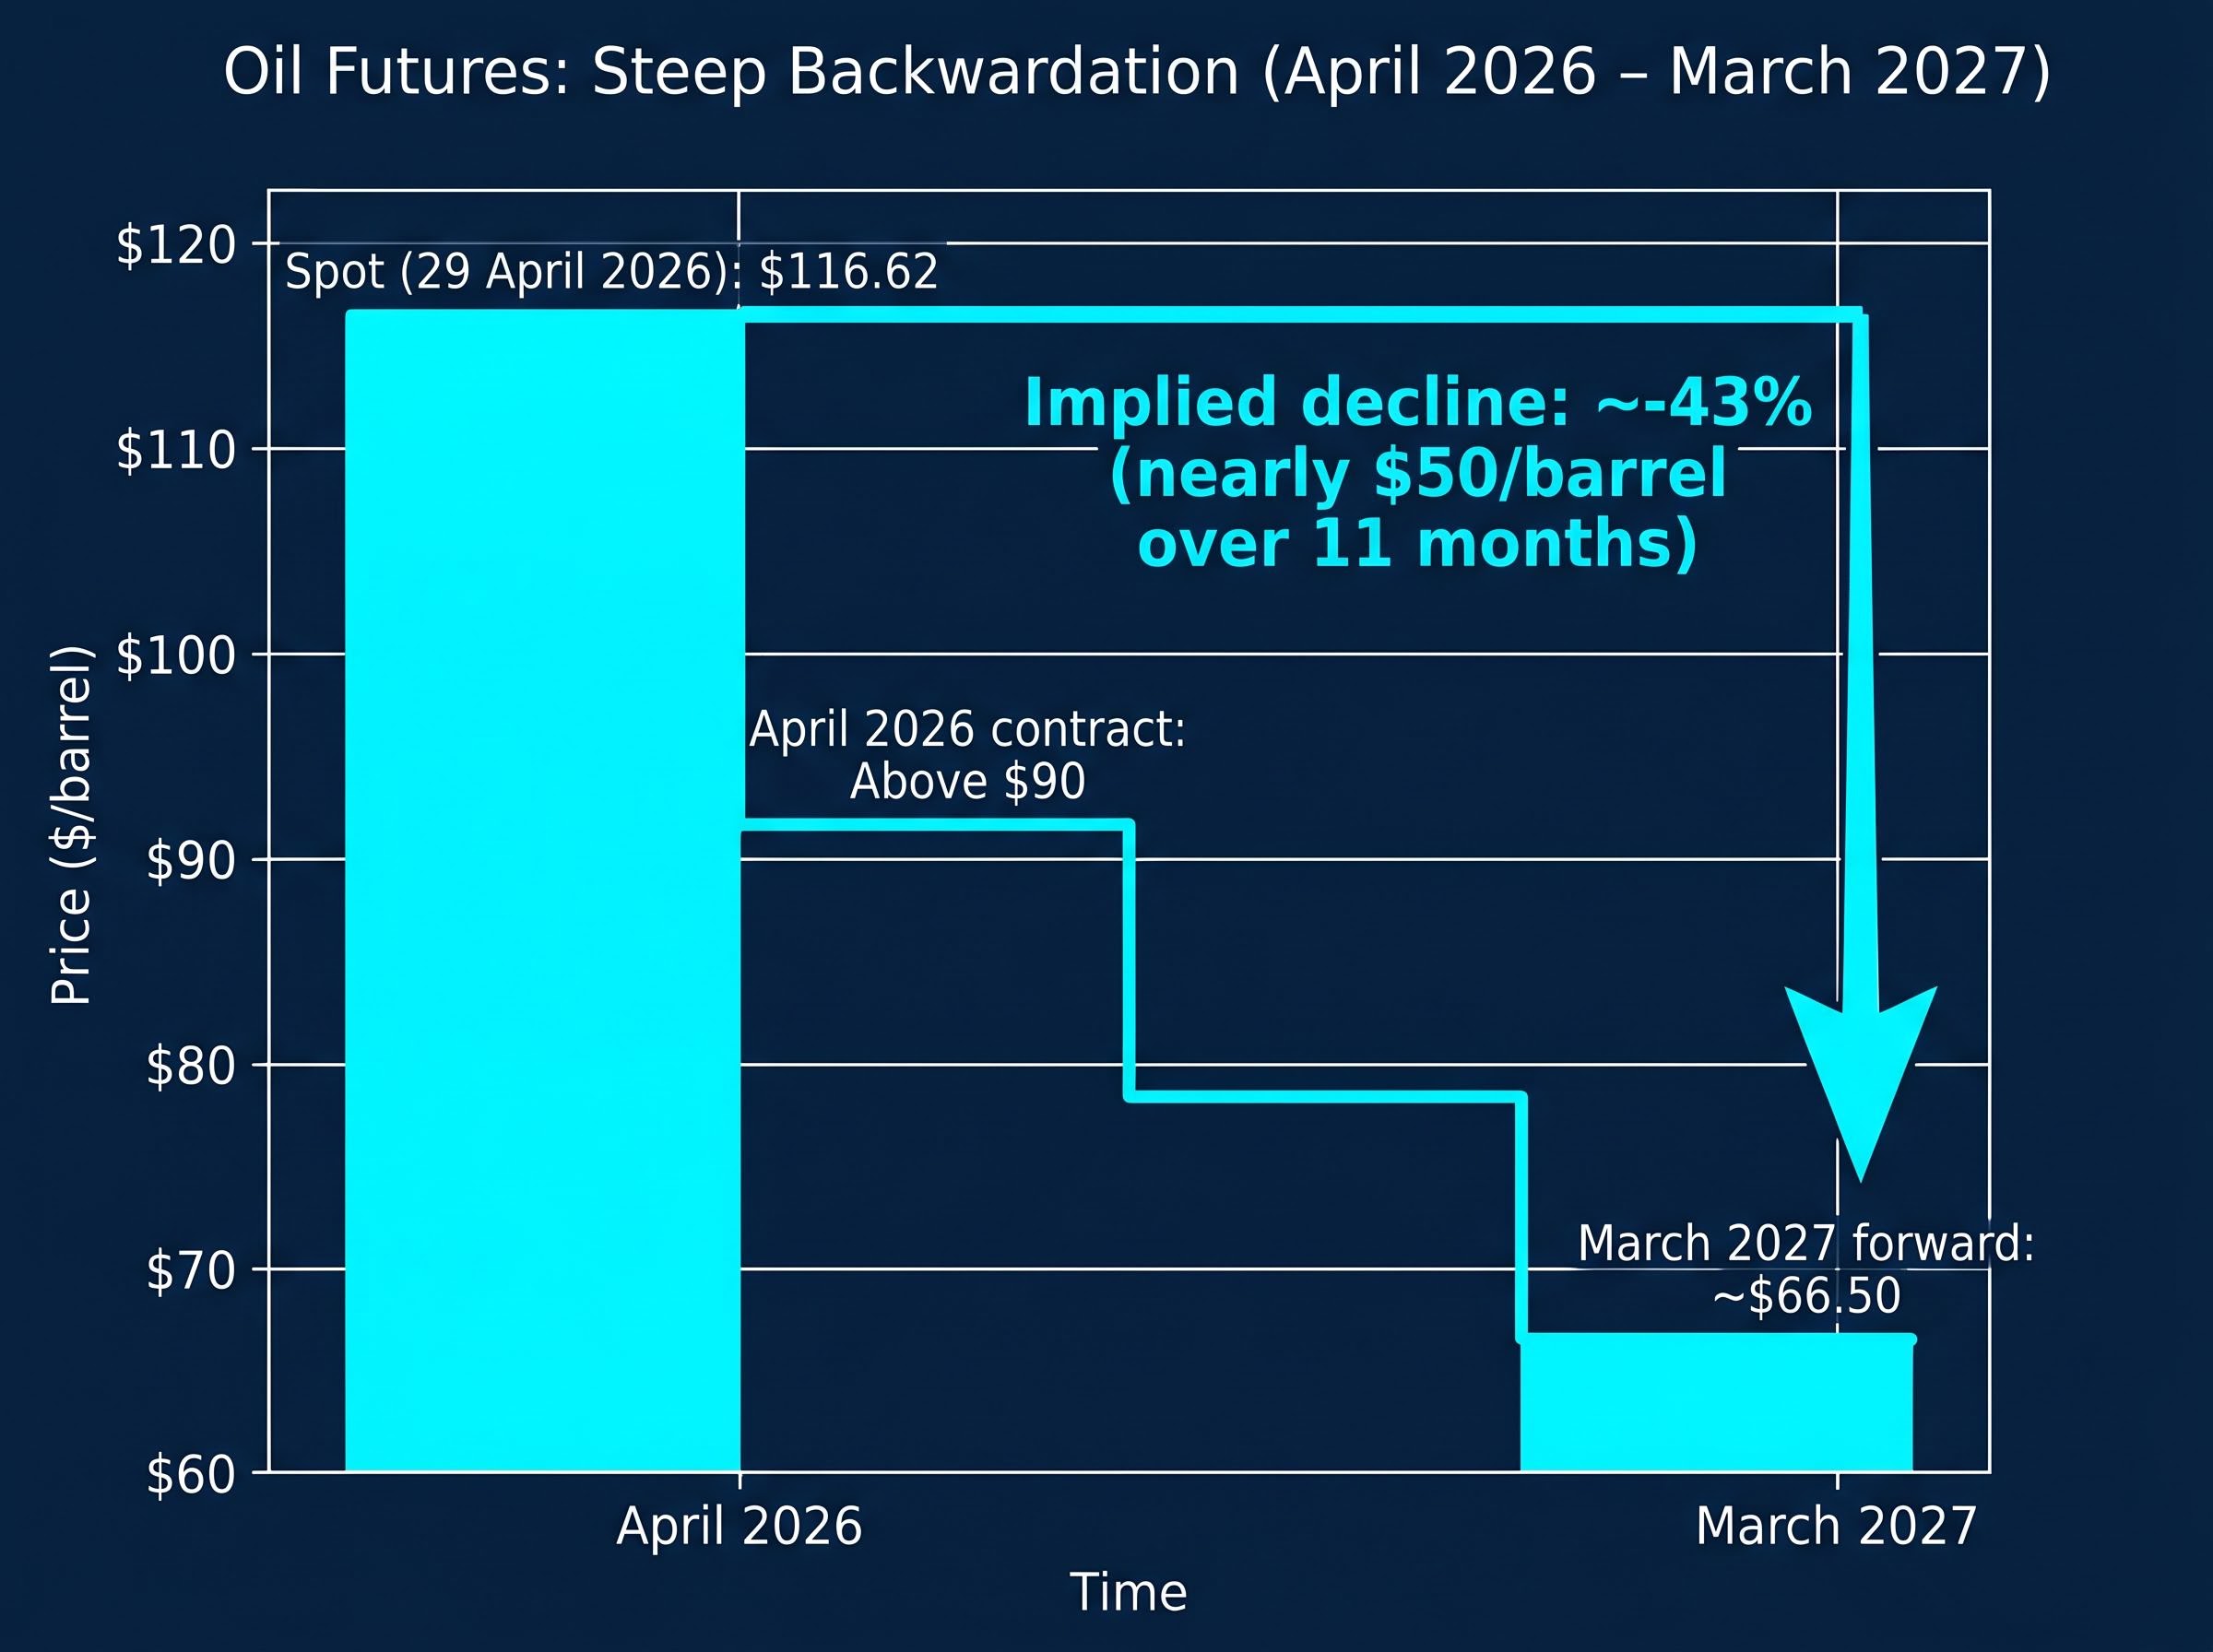
Oil futures are in steep backwardation, a market structure where near-term contracts trade at significant premiums to longer-dated ones. In plain terms, buyers are willing to pay far more for oil delivered now than for oil delivered next year. This signals that the market collectively expects the current supply tightness to ease, whether through conflict resolution, alternative supply sources, or demand destruction.
| Contract Period | Approximate Price | Implied Change from Spot |
|---|---|---|
| Spot (29 April 2026) | $116.62 | — |
| April 2026 contract | Above $90 | ~-23% |
| March 2027 forward | ~$66.50 | ~-43% |
The IEA has warned that the Iran war has effectively erased global oil demand growth forecasts for 2026, with supply disruptions expected to persist into mid-year. Yet forward pricing suggests the market sees the acute phase as finite. Historically, supply-driven oil price shocks have reversed rate hikes within six to twelve months as growth concerns overtake inflation concerns. Rate markets, which currently price a terminal rate near 4.35-4.60%, may be extrapolating from the spot price rather than the forward curve.
For investors, the implication is direct: positioning solely for the current price spike risks being badly offside when the curve resolves.
Supply-shock inflation episodes resolve through one of two pathways, and understanding which is unfolding determines whether duration assets are a trap or an opportunity.
The Taylor Rule, a framework central banks use to calibrate rate decisions, offers a useful lens. It suggests central banks need to raise rates by approximately 1.5 percentage points for every 1 percentage point of excess inflation to genuinely tighten financial conditions. Below that threshold, conditions may remain accommodative despite headline rate increases. The practical takeaway: not all rate hikes are equally restrictive, and the RBA’s current path may be less aggressive in real terms than the headline rate suggests.
One additional consideration. The ultra-low inflation environment of the 2010s is unlikely to return. A 2% floor may be more realistic than a 2% ceiling going forward, which means investors should calibrate expectations for a “normal” that is slightly higher than the pre-pandemic decade.
The current data places Australia somewhere between these two pathways. The RBA cash rate at 4.10%, with market pricing implying a terminal rate around 4.35-4.60%, suggests the hiking cycle is advanced but not necessarily complete. The divergence between CommBank’s 5.4% headline CPI projection and Vanguard’s 2.6% core inflation estimate by year-end reveals genuine uncertainty about duration.
That divergence is itself a signal. When credible institutions disagree this widely, the appropriate portfolio response is diversification across asset classes rather than concentration in any single macro view.
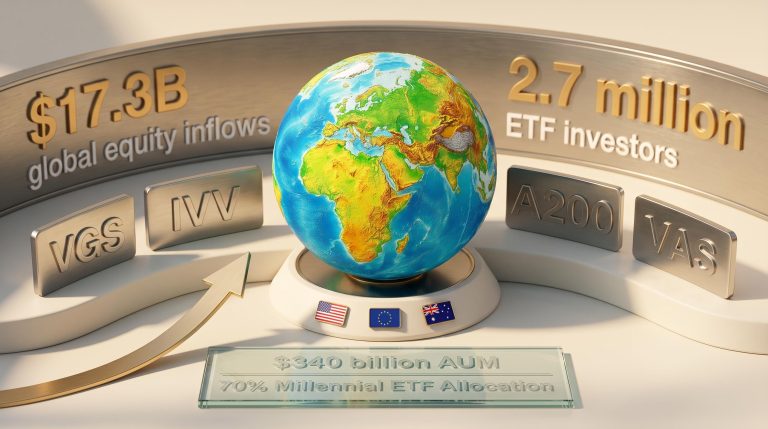
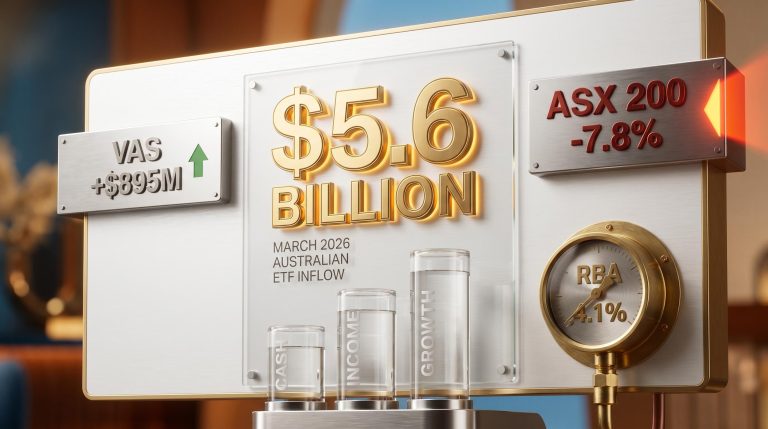
Real-money flows tell a clearer story than commentary. In April 2026, three themes dominated ASX ETF positioning:
A$92.3 million into a single crude oil ETF in one week. That figure captures the intensity of retail sentiment around energy prices in late April 2026.
Each of these moves contains a logic. The rotation to domestic equities reflects currency and geopolitical risk management. The bond flows reflect rate-peak positioning. But the OOO surge warrants closer scrutiny.
Buying an oil ETF at $116 per barrel Brent while futures price $66.50 for March 2027 is a timing bet. If the backwardation signal proves correct, investors who entered OOO in late April may find themselves holding a declining asset. Flow data does not tell investors what to do; it illuminates the emotional environment in which portfolio decisions are being made. That context matters when building a strategy designed to outlast the current sentiment cycle.
The analysis above points toward a two-layer framework, organised by time horizon, that serves investors across both the remaining hiking period and the eventual pivot to easing.
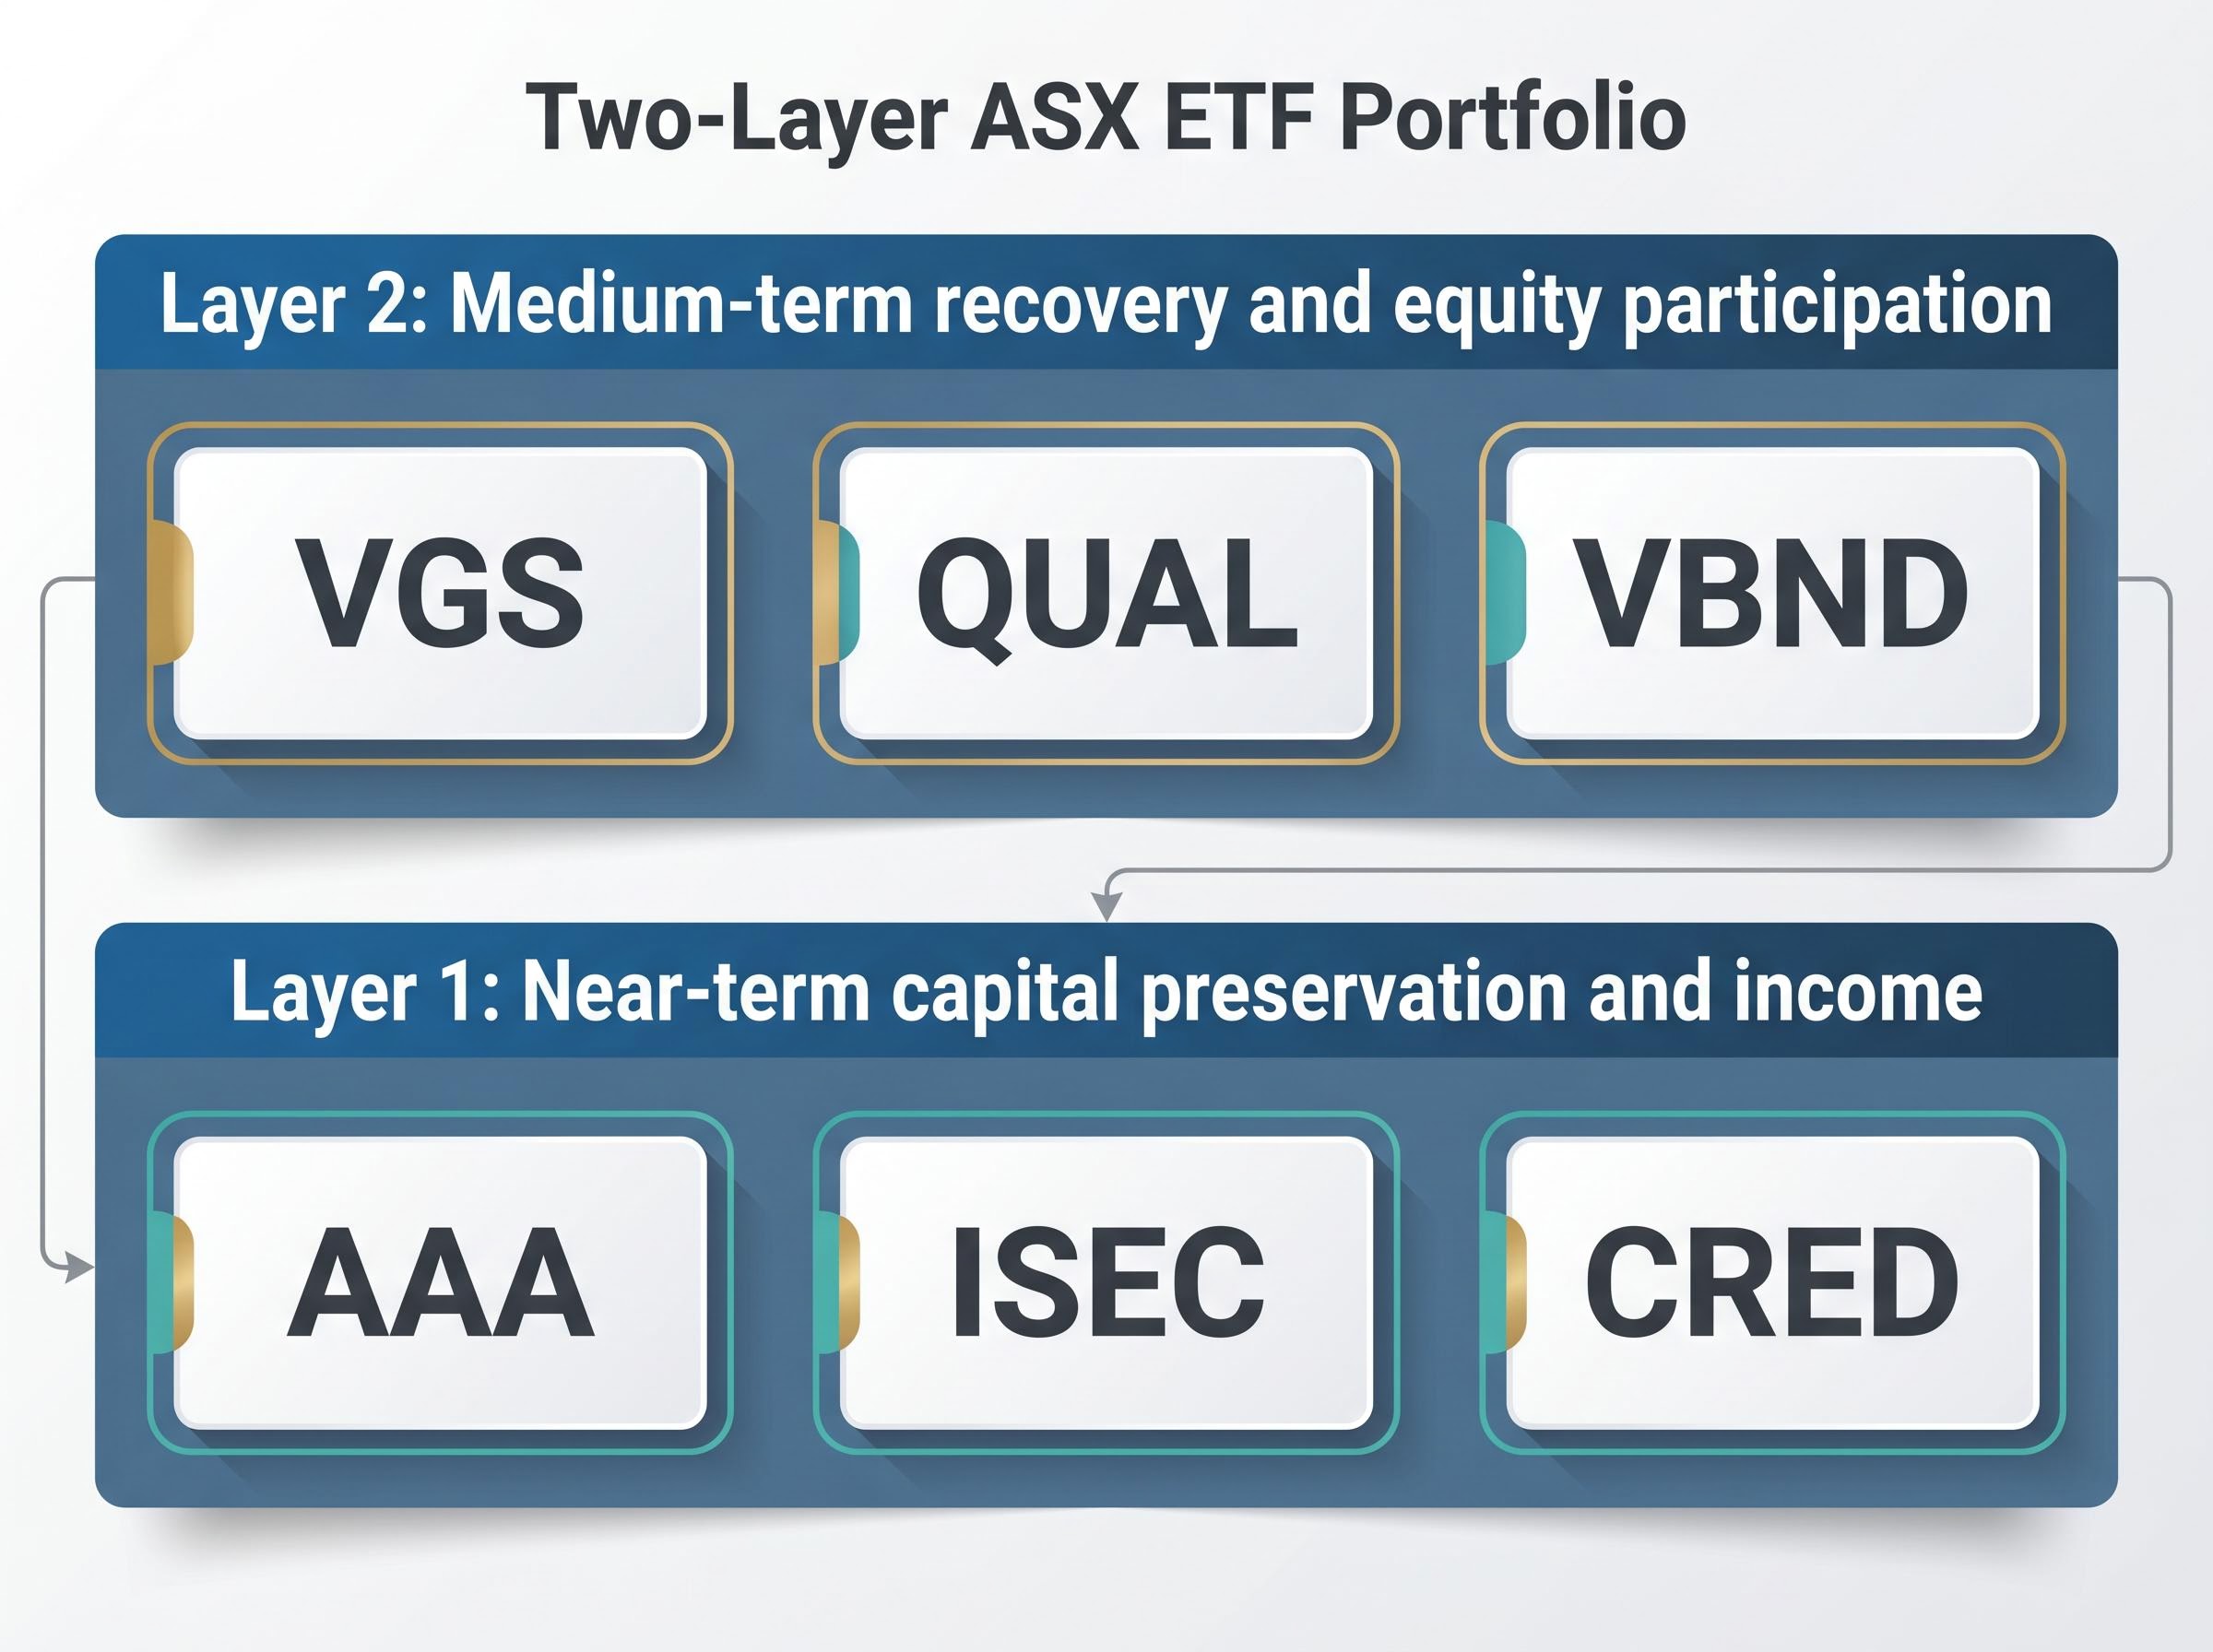
This layer prioritises liquidity and income while the rate outlook remains uncertain.
AAA (BetaShares Australian High Interest Cash ETF) provides the foundation. It holds AUD-denominated bank deposit accounts, delivers regular income at rates linked to the elevated cash rate, and preserves capital with high liquidity. For investors who need to deploy quickly when markets overreact to an individual CPI print or RBA announcement, AAA keeps capital accessible.
ISEC (iShares Enhanced Cash ETF) steps up modestly in yield by holding short-term money market instruments and short-duration corporate bonds. The additional yield comes with minimal duration risk, making it suitable for investors comfortable with a small step beyond pure cash.
CRED (BetaShares Australian Investment Grade Corporate Bond ETF) is the bridge instrument. It holds senior fixed-rate bonds from high-quality Australian issuers, capturing income now while positioning for price appreciation as rates approach and eventually pass their peak. If the short-cycle thesis proves correct, CRED benefits on both the income and capital return fronts.
Maintaining liquidity within this layer allows investors to deploy into dislocated assets when sentiment-driven selloffs create opportunities, rather than locking capital into positions that cannot be adjusted.
This layer captures recovery positioning regardless of where growth resumes.
VGS (Vanguard MSCI Index International Shares ETF) provides broad exposure to more than 1,000 of the largest developed market companies outside Australia. The geographic diversification means recovery participation is not dependent on a single region’s trajectory. If Australian growth stalls while US or European economies accelerate through the supply shock, VGS captures that divergence.
QUAL (VanEck MSCI World ex Australia Quality ETF) applies a quality-factor screen that selects for strong profitability, low leverage, and stable earnings. The specific attribute that matters in an input-cost inflation environment is pricing power. Companies with high margins and low debt can absorb cost increases without margin collapse, making QUAL a defensive equity position that still participates in a recovery.
VBND (Vanguard Global Aggregate Bond Index (Hedged) ETF) holds diversified global investment-grade bonds with AUD hedging. The hedging removes currency volatility as a variable, which matters when holding global bonds during a period of AUD uncertainty. As rates approach their peak and eventually decline, VBND is positioned for capital appreciation alongside its income component.
| ETF Ticker | Asset Class | Role (Rate Peak Period) | Role (Post-Pivot) | Key Risk |
|---|---|---|---|---|
| AAA | Cash equivalent | Capital preservation, liquidity | Yield declines as rates fall | Returns lag inflation if rates peak early |
| ISEC | Short-duration bonds | Modest yield above cash | Stable but limited upside | Minimal duration benefit in a rate-cut cycle |
| CRED | Investment-grade corporate bonds | Income at elevated yields | Capital appreciation as rates fall | Credit spread widening in a recession |
| VGS | Global equities (ex-AU) | Recovery positioning | Growth capture across regions | Further equity drawdown if recession deepens |
| QUAL | Quality-factor global equities | Margin protection via pricing power | Outperformance in recovery | Underperformance if low-quality cyclicals lead |
| VBND | Global investment-grade bonds (AUD-hedged) | Income and diversification | Capital appreciation as yields fall | Further rate hikes beyond expectations |
A dollar cost averaging approach across these instruments captures more upside during volatility than waiting for certainty. Consistent investment through uncertain months means buying more units when prices dip on negative sentiment and fewer when prices rise on positive data, a mechanical advantage that does not require predicting the exact turning point.
The supply-side nature of the oil shock, the steep backwardation in oil futures, and the historical pattern of supply-driven rate cycles collectively point toward a hiking cycle that may be shorter than current market pricing implies. That does not mean rates will fall tomorrow. It means the window for positioning is now, not after the RBA announces its first cut.
The two-layer framework outlined above serves investors across both scenarios: if rates rise further, the near-term layer preserves capital and earns income at elevated yields. If the cycle turns sooner than expected, the medium-term layer captures the recovery in both equities and bonds.
The practical next step is straightforward. Review current portfolio allocations against this two-layer logic. Consider beginning dollar cost averaging into the named instruments now rather than waiting for a consensus that the cycle has peaked. Read the relevant product disclosure statements before acting.
This article is for informational purposes only and should not be considered financial advice. Investors should conduct their own research and consult with financial professionals before making investment decisions. Past performance does not guarantee future results. Financial projections are subject to market conditions and various risk factors.
Supply-driven inflation is caused by disruptions to the availability of goods or energy rather than excess consumer demand. It matters for Australian investors because central bank rate hikes, like those from the RBA, cannot directly fix supply constraints such as an oil shock, meaning the inflation episode may resolve faster than rate markets currently imply.
Brent crude spot prices sat at approximately $116.62 per barrel on 29 April 2026, while March 2027 futures were priced at around $66.50, implying a roughly 43% decline over 11 months. This steep backwardation suggests the market expects the current supply tightness to ease well before rate markets have fully priced in, pointing to a potentially shorter hiking cycle.
The article outlines a two-layer framework: a near-term preservation layer using AAA, ISEC, and CRED for capital protection and income at elevated yields, and a medium-term recovery layer using VGS, QUAL, and VBND to capture equity and bond upside when the rate cycle turns.
The article cautions that buying the BetaShares Crude Oil ETF (OOO) at current Brent prices near $116 per barrel is effectively a timing bet against forward markets pricing oil at around $66.50 by March 2027. Investors who entered OOO in late April 2026 risk holding a declining asset if the backwardation signal proves correct.
The article recommends beginning dollar cost averaging into a diversified ETF portfolio now rather than waiting for confirmation that the RBA has peaked, because consistent investment through uncertain months means buying more units when prices dip on negative sentiment, creating a mechanical advantage that does not require predicting the exact turning point.