Australia Sheds 19,000 Jobs as Unemployment Climbs to 4.5%
33 mins ago


Dutch Bros reported a dramatic surge in bottom-line profits throughout 2025, capturing immediate attention from institutional equity markets. Conducting a thorough Dutch Bros stock analysis requires looking beyond this initial financial momentum to understand the underlying mechanics of the coffee chain’s national expansion. As of April 2026, the beverage retailer commands a $9.12 billion market capitalisation, with individual shares trading near $55.
The core proposition for prospective shareholders rests on a highly aggressive physical growth trajectory. Management intends to operate exactly 2,029 locations by 2029, aiming to capture national market share at an unprecedented pace for the brand. Evaluating whether this physical roadmap justifies the current premium valuation multiple remains the central question for market participants today. Investors must weigh the proven success of current operating models against the execution risks inherent in scaling a retail footprint so rapidly.
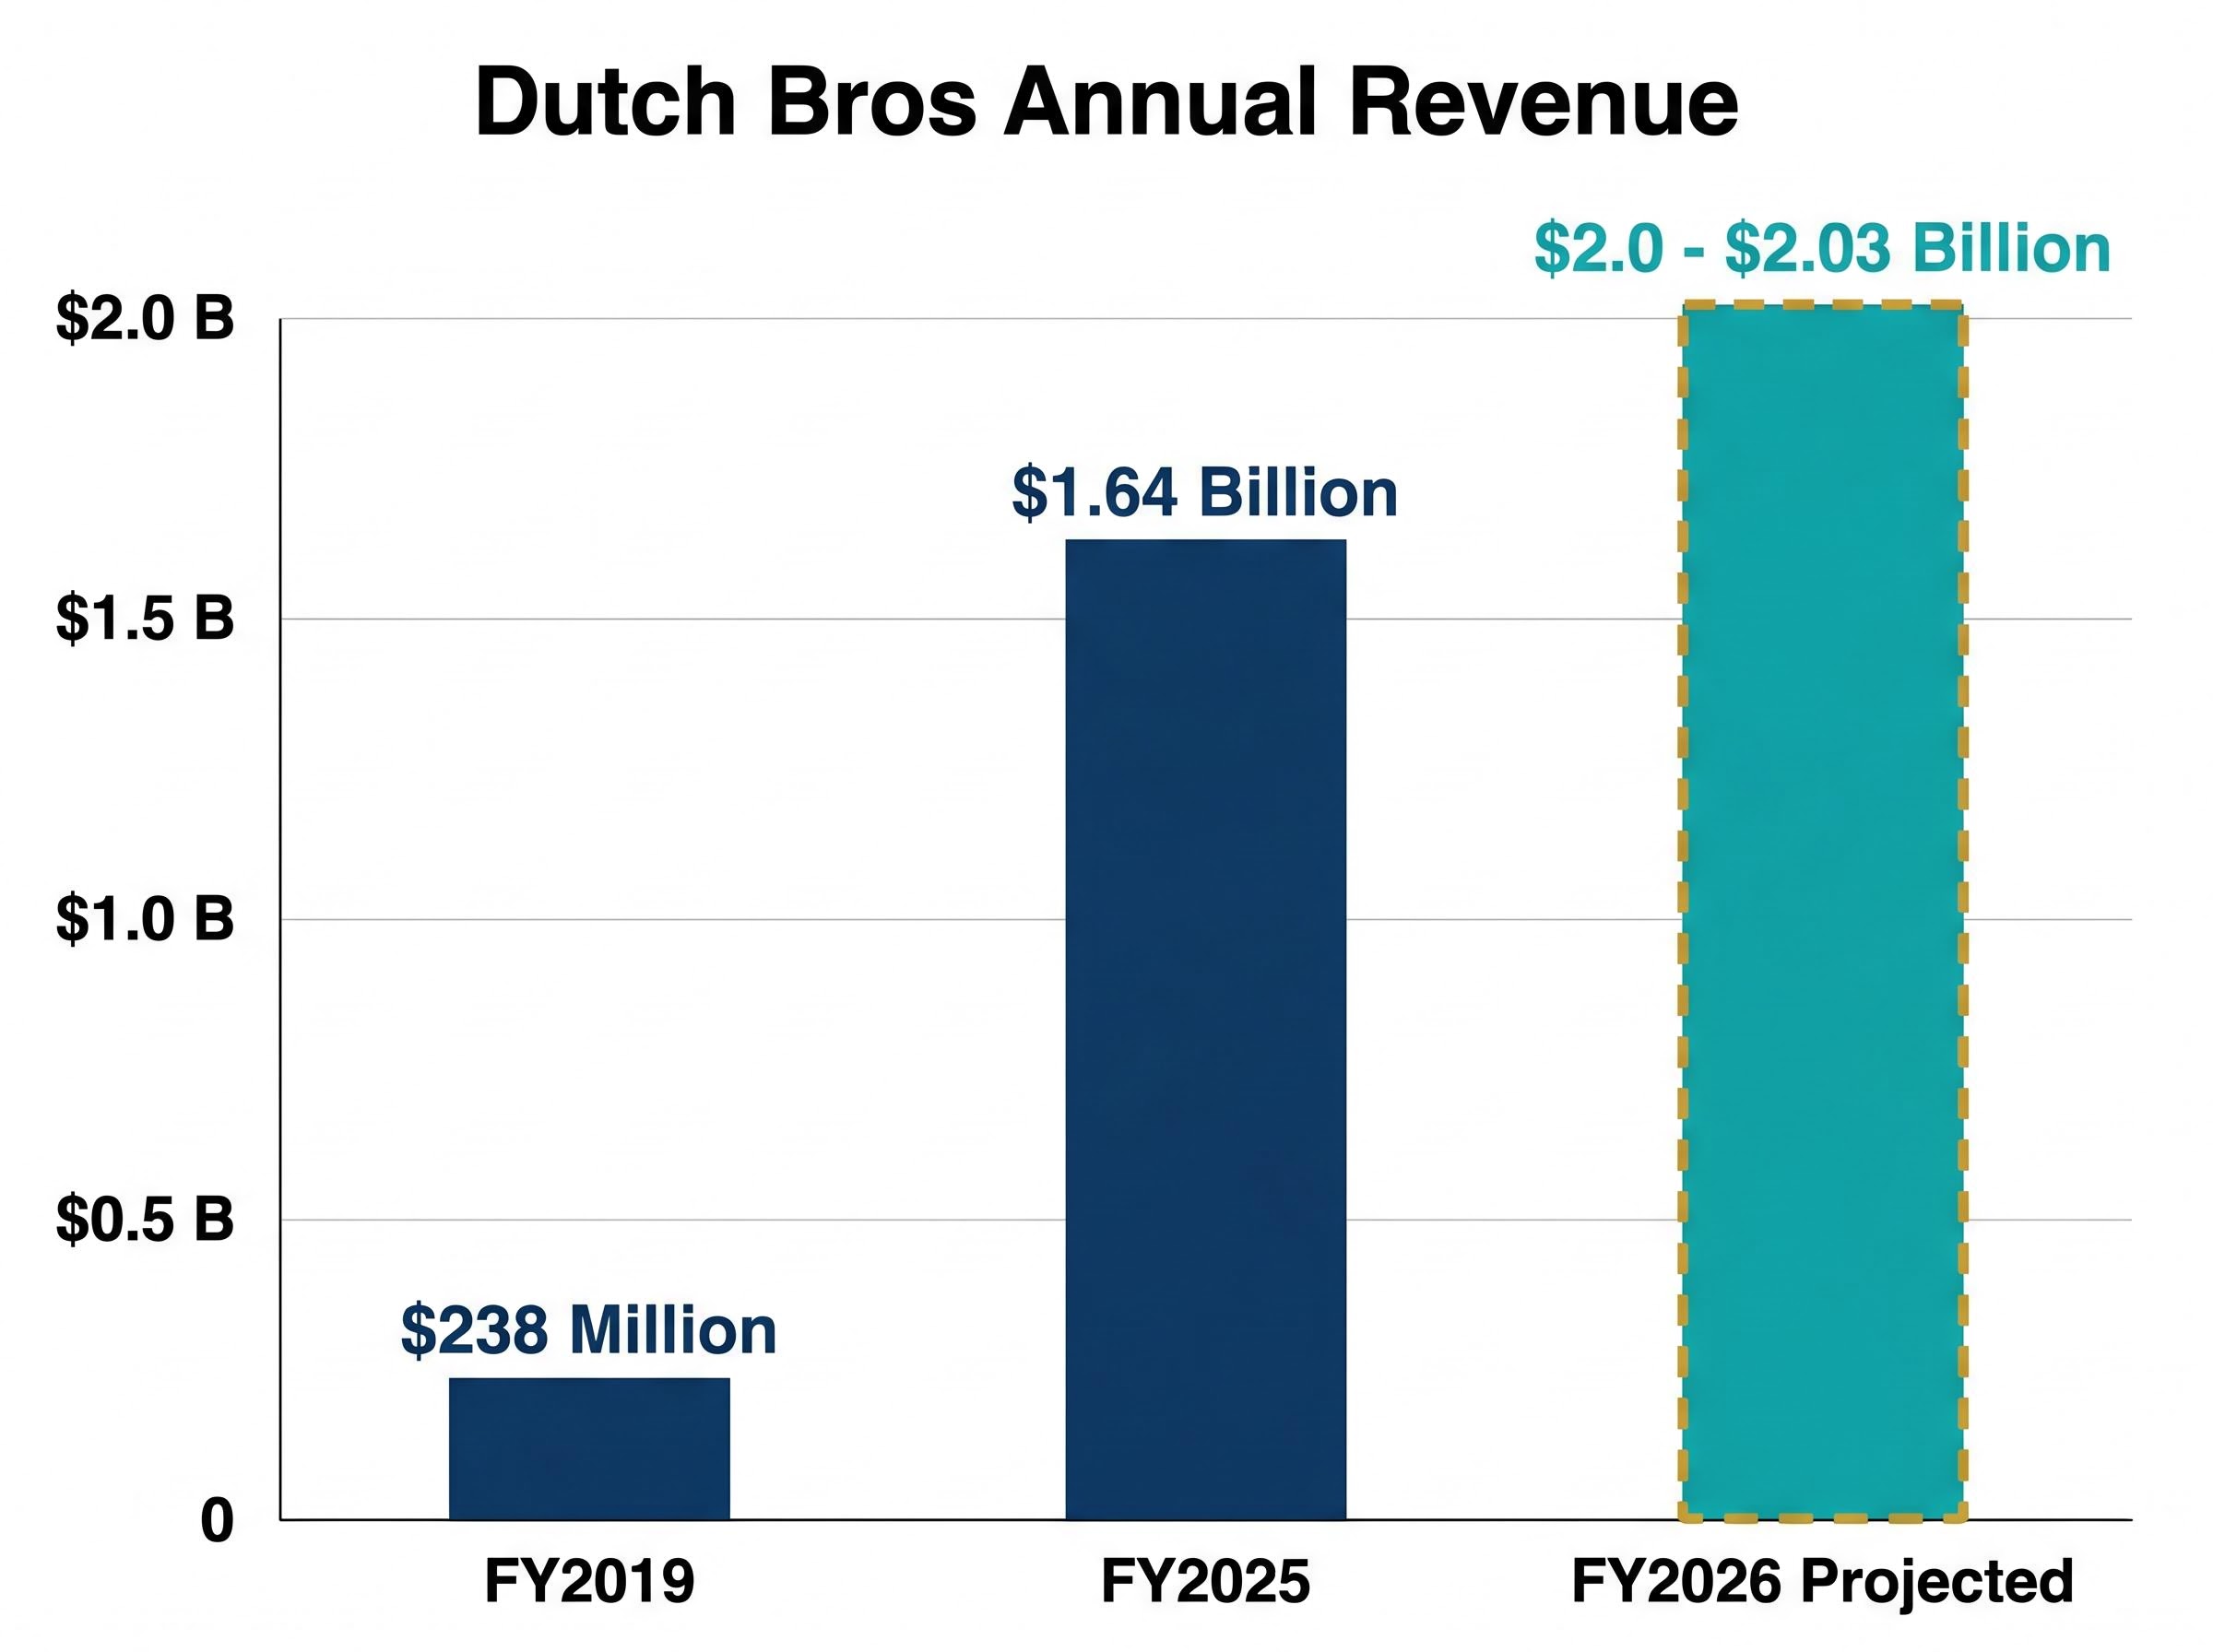
The sheer velocity of recent financial growth provides the quantitative foundation for current market sentiment. The transition from $238 million in FY2019 revenues to the $1.64 billion achieved in FY2025 highlights a rapid national scale-up that continues to outpace sector averages. This annual revenue figure represents an approximate 28% year-on-year growth rate.
The Dutch Bros 2025 annual report confirms this top-line trajectory alongside explicit management projections for continued physical scaling over the current decade.
Fourth-quarter results for 2025 acted as a material catalyst for equity analysts covering the consumer discretionary sector. The company reported Q4 2025 revenue of $444 million, beating broader analyst consensus estimates by 4.43%. This top-line performance arrived alongside an earnings per share (EPS) of $0.17, which outperformed market expectations by a significant 82.21%. Systemwide same-shop sales increased by 7.7% during this reporting period.
Importantly, this growth relies heavily on actual customer traffic rather than artificial revenue inflation. Company-operated shops saw a 9.7% revenue increase, driven primarily by a 7.6% rise in transaction volume rather than just menu price hikes. This transaction-led expansion indicates genuine, recurring consumer demand at the retail level. For investors, volume-driven sales serve as a critical indicator of long-term commercial viability in a highly competitive market.
Forward guidance suggests this operational momentum will persist through the current calendar year. Management projects FY2026 revenues will land between $2.0 billion and $2.03 billion, targeting 22% to 24% annual growth. Adjusted EBITDA also surged 49% year-on-year, alongside a healthy margin expansion from 14.2% to 16.4%.
| Financial Metric | Q4 2025 Result | FY2025 Result | Year-on-Year Growth |
|---|---|---|---|
| Total Revenue | $444 million | $1.64 billion | +28% (Annual) |
| Same-Shop Sales | +7.7% | – | Driven by transaction volume |
| Adjusted EBITDA | Surge | – | +49% (Q4 YoY) |
| Operating Margin | 16.4% | – | Expanded from 14.2% |
Understanding the corporate financial trajectory requires breaking down the exact mechanics of a single retail location. The company operates with a distinct cultural moat built on high-speed drive-thru service and heavy beverage customisation. Popular product lines, such as the highly customisable Rebel energy drinks, drive recurring daily traffic that frequently outpaces traditional sit-down coffee shop models.
This operational efficiency translates directly into superior unit economics that distinguish the brand from legacy competitors. Real estate footprints are notably smaller than traditional cafes, requiring substantially lower initial capital expenditure. These compact designs also operate with fewer staff members per shift, maximising labour efficiency during peak trading hours.
Legacy competitors are actively deploying strategic turnaround initiatives focused on store innovation and digital engagement to counter the rapid market share gains achieved by smaller, highly agile drive-thru networks.
Unit Output Comparison “Dutch Bros generates an Average Unit Volume (AUV) of $2.1 million from its drive-thru model, compared to Starbucks’ $1.8 million average.”
A defining component of this margin retention strategy is the corporate ownership structure. Currently, 71% of locations are directly company-operated, and these specific sites generate 92% of total system revenue. This high concentration allows corporate management to maintain strict quality control while capturing the full margin benefit of scaled operations.
The three core pillars of this economic moat include:
Speed of Service (optimised drive-thru lanes handling high vehicle throughput with minimal wait times) Customisation (highly tailored beverage menus driving brand loyalty and repeat visits) * Real Estate Efficiency (small physical footprints reducing fixed overhead costs and land requirements)
These structural advantages explain precisely how a smaller-footprint brand can generate superior site-level cash flow compared to global industry leaders.
Physical footprint growth serves as the primary engine for future revenue generation and shareholder returns. As of March 2026, the company operates 1,181 locations distributed across 25 states. The geographic concentration remains heaviest on the West Coast and in the Southern United States.
California currently leads the domestic footprint with 286 retail locations, followed closely by strong, mature market penetration in Texas and Oregon. Moving into new domestic territories requires highly disciplined execution to maintain the high Average Unit Volumes consistently seen in these legacy markets.
Management has provided clear, measurable operational targets for the current fiscal year. The company aims to open at least 180 new shops throughout FY2026. Hitting this target would bring the total network to approximately 1,317 sites by year-end, maintaining the aggressive expansion cadence promised to public markets.
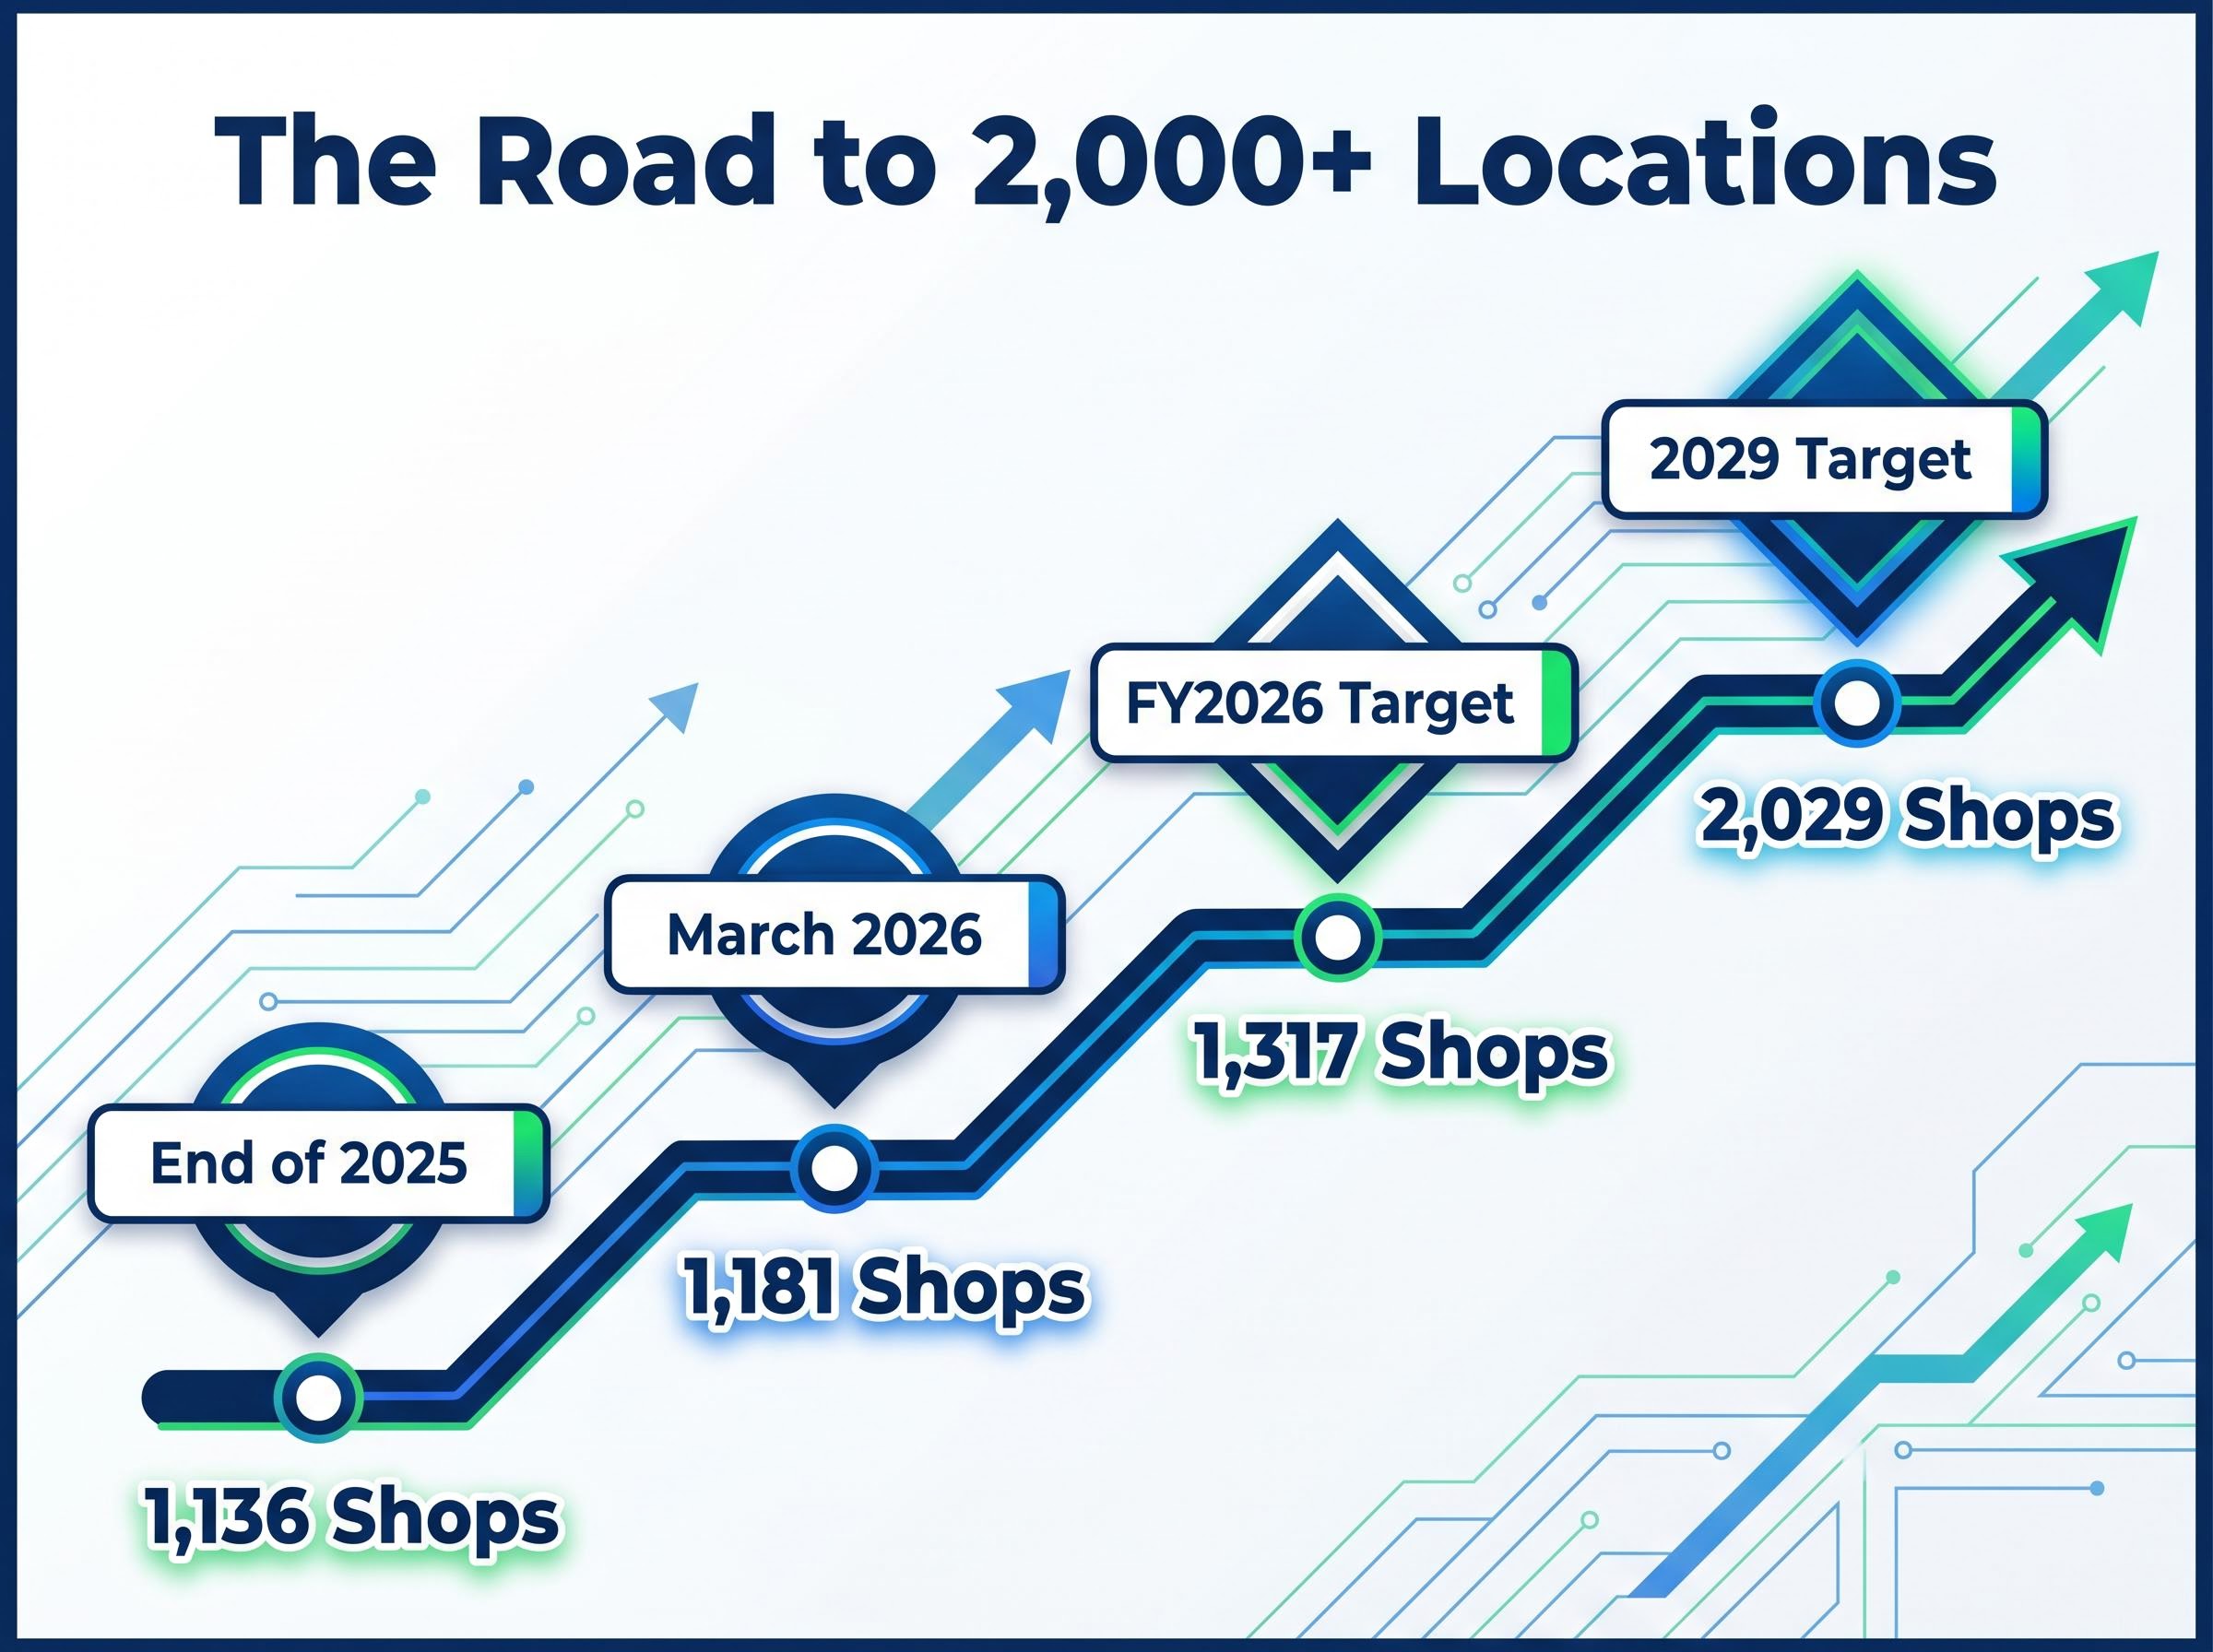
The definitive milestone for long-term shareholders is the stated target of 2,029 stores by 2029. Beyond this medium-term goal, executive leadership projects a theoretical domestic capacity limit of retail sites across the United States market. Mapping this exact trajectory helps institutional and retail investors model potential future returns against the execution risks inherent in rapid national expansion.
For investors exploring the ultimate limits of this expansion strategy, our detailed coverage of Dutch Bros valuation metrics examines the feasibility of a theoretical 7,000-location empire and its direct impact on the forward price-to-earnings ratio.
| Development Phase | Timeframe | Target Location Count |
|---|---|---|
| Historical Benchmark | End of 2025 | 1,136 Shops |
| Current Footprint | March 2026 | 1,181 Shops |
| Definitive Milestone | By 2029 | 2,029 Shops |
While physical site expansion commands immediate headline attention, management is simultaneously activating multiple operational levers this year to optimise existing profitability. The internal strategy focuses heavily on improving order throughput speeds and expanding the average customer ticket value per visit.
Consumer-facing innovations form a major part of the 2026 operational strategy. The company introduced new spring seasonal menu items early in the year to drive immediate foot traffic. Furthermore, a systemwide rollout of an expanded food menu is targeted for the end of 2026, aiming to capture additional supplementary spend from existing drive-thru customers.
Backend structural efficiencies are also evolving to protect profit margins against rising inflationary pressures. The company is strategically shifting its real estate development toward build-to-suit leases, targeting a portfolio mix higher than the 45% achieved during 2025.
The top three operational priorities for 2026 include:
The mobile application strategy specifically addresses physical capacity constraints during peak trading hours. By shifting more consumers to order-ahead digital workflows, individual sites can process higher transaction volumes without requiring costly additional drive-thru lanes.
Prospective equity buyers must rigorously weigh the high-growth narrative against a materially elevated price tag. The stock currently trades at a forward P/E ratio of 69.93, representing a significant valuation premium over broader market indices and sector peers.
Wall Street analysts generally maintain a broadly optimistic outlook despite this demanding valuation multiple. The consensus analyst price target currently sits at $75.96, implying an approximate 37% upside from recent trading levels. Furthermore, Telsey Advisory Group officially reiterated an “Outperform” rating in April 2026, setting a specific price target of $66.
This bullish institutional consensus contrasts directly with the structural vulnerabilities of a growing company facing global supply chain volatility. Dutch Bros holds measurably higher exposure to commodity inflation compared to larger, more entrenched rivals equipped with highly advanced hedging programmes.
Elevated global coffee costs represent a specific and immediate threat to site-level operating profitability. In Q4 2025, the baseline cost of goods sold rose by 160 basis points year-on-year, ultimately consuming 27% of total corporate revenues.
Current International Coffee Organization supply data reflects how geopolitical conflicts and shipping route disruptions are compounding these raw material expenses, severely impacting the cost structure for heavily exposed beverage retailers.
Management explicitly projects these supply chain pressures will create an 80 basis point margin headwind across FY2026. The financial impact is expected to be heavily front-loaded this year. A 200 basis point margin compression is specifically forecast for the first quarter of 2026 alone, driven entirely by raw coffee pricing. Understanding this downside supply exposure provides a necessary commercial counterbalance for investors evaluating this high-multiple growth asset.
The investment thesis for this rapidly expanding coffee chain balances superior unit economics against a highly demanding valuation multiple. The ability to consistently generate higher average revenue volumes from distinctly smaller retail footprints provides a legitimate, sustainable competitive advantage in the highly saturated quick-service restaurant sector.
Market attention now turns to the upcoming Q1 2026 earnings report scheduled for release on 6 May 2026. This disclosure will serve as a significant near-term catalyst, revealing whether the company can successfully maintain transaction volume growth while absorbing the heavily projected 200 basis point commodity cost headwind.
For long-term commercial investors, the premium price tag ultimately demands flawless execution of the expansion strategy. The aggressive roadmap to over two thousand locations provides a clear pathway to scale, provided management can successfully navigate supply chain volatility.
This article is for informational purposes only and should not be considered financial advice. Investors should conduct their own research and consult with financial professionals before making investment decisions. Past performance does not guarantee future results. Financial projections are subject to market conditions and various risk factors.
Dutch Bros' rapid revenue growth is primarily driven by aggressive national expansion and strong same-shop sales, which increased 7.7% in Q4 2025, largely due to transaction volume.
Dutch Bros aims to operate 2,029 locations across the United States by 2029, with a target to open at least 180 new shops in FY2026 alone.
Dutch Bros maintains its economic moat through high-speed drive-thru service, extensive beverage customisation, efficient real estate footprints, and a high percentage of company-operated locations.
Investors face risks from Dutch Bros' premium valuation, significant exposure to commodity inflation, particularly rising coffee costs, and the inherent execution challenges of rapid national expansion.
Dutch Bros is scheduled to release its Q1 2026 earnings report on May 6, 2026, which will be a key near-term catalyst for the stock.