Generational Investing Trends: the Pivot From ASX to Global ETFs
just now

Parsons reported a surface-level revenue contraction on April 29, 2026, yet delivered record profitability metrics that complicate the initial market read. Evaluating Parsons stock requires looking past the headline figures to understand the contractual mechanics driving these divergent results. Prior to the earnings release, Wall Street analysts had expressed concerns regarding growth sustainability across the broader federal contracting space.
The first-quarter results provide a definitive, albeit complex, answer to those operational concerns. This analysis dissects the specific classified projects masking the company’s core growth. It reveals the underlying trajectory of the national security and infrastructure portfolios, equipping readers to accurately assess the firm’s true market position.
Start with the top-line illusion that initially captured market attention. The company posted $1.5 billion in total reported revenue for the first quarter, representing a 4% decline compared to the previous year. This contraction stems entirely from lower volume on a single fixed-price classified contract within the Federal Solutions segment.
Consequently, this specific division recorded a 10% revenue drop in its unadjusted reporting figures. The scheduled volume reduction on this classified work was anticipated by management, though it temporarily skews the consolidated growth trajectory.
When analysts strip away this singular contractual headwind, the underlying operational momentum tells a decidedly different story. Overall company growth sits at 8% year-over-year excluding the classified project. The Federal Solutions segment demonstrates even stronger underlying health, posting 12% growth once adjusted for the anomaly.
| Performance Metric | Reported Q1 2026 Figure | Adjusted Growth (Excluding Classified Contract) |
|---|---|---|
| Total Enterprise Revenue | $1.5 billion (-4% YoY) | +8% YoY |
| Federal Solutions Revenue | 10% contraction | +12% YoY |
| Earnings Per Share | $0.49 (GAAP) | (Adjusted) |
The disparity extends directly to bottom-line reporting metrics. The company reported a GAAP earnings per share of $0.49, compared to an adjusted per-share earnings figure.
Understanding this specific contractual driver prevents investors from misinterpreting a concentrated project taper as broad systemic weakness. By isolating the fixed-price contract, the true organic momentum of the broader enterprise becomes visible.
For investors wanting a rapid breakdown of the core numbers driving the stock’s recent market jump, our full explainer on the Parsons earnings report details the key adjusted metrics and operational improvements that offset the headline revenue contraction.
Assessing government contractors requires evaluating future obligations rather than past performance alone. The book-to-bill ratio serves as a primary leading indicator of corporate health in the infrastructure and defence sectors. This metric compares the value of newly awarded contracts against the value of completed work billed during the same period.
A ratio above 1.0 indicates that a company is securing work faster than it completes it, signalling forward expansion. Government allocations for infrastructure and intelligence operations frequently span several years, requiring contractors to maintain deep pipelines of approved work.
Parsons achieved a robust 1.4x enterprise-wide book-to-bill ratio during the first quarter. The company secured $2.1 billion in net bookings, pushing its total uncompleted project value to a record $9.3 billion. This represents an increase of $235 million compared to the same period last year and stands as the highest backlog since the company’s 2019 initial public offering.
Not all uncompleted project value carries the same immediate financial weight. Total backlog encompasses the entire potential value of awarded contracts over their full multi-year duration. However, financially backed commitments refer exclusively to the portion of that work explicitly funded by current government appropriations.
The company currently holds financially backed commitments. This foundational metric provides investors with clear visibility into the firm’s multi-year revenue armour. It demonstrates how substantial contractual obligations can insulate the stock against short-term economic volatility or federal budget delays.
This defensive insulation becomes particularly valuable when assessing the fragile US economic outlook, as aggregate consumer spending data masks underlying stress caused by unsustainable savings drawdowns.
Leadership successfully extracted better margins from a smaller revenue base through disciplined operational execution. The company delivered a record first-quarter adjusted EBITDA of $151 million, representing a 1% increase year-over-year despite the top-line contraction. This efficiency drove a margin expansion, pushing the adjusted EBITDA margin to a notable 10.1%.
The official Parsons Q1 2026 10-Q filing details how this operational leverage successfully offset the top-line revenue decline to achieve these record margins.
Overall net income settled at $53 million for the quarter, reflecting the impact of the lower top-line volume. Meanwhile, operational cash flow metrics demonstrated significant improvement compared to the previous year. Operating cash outflow shrank, a marked improvement from the outflow recorded in the prior year.
Strategic acquisitions have played a vital role in building this resilient, high-margin profile. The integration of Altamira Technologies successfully bolstered the company’s classified intelligence capabilities, particularly with agencies like the National Security Agency. These specialised space intelligence services carry higher margins and strengthen competitive positioning across federal intelligence communities.
Leadership Commentary “Our record first-quarter profitability margins demonstrate the underlying durability of our business model and the successful integration of high-value intelligence capabilities into our core national security portfolio,” management stated.
Margin expansion in a contracting revenue environment reveals strong pricing power. This operational efficiency is a defining trait for long-term shareholder value generation.
The multi-billion dollar backlog translates into concrete national security and infrastructure initiatives. During the first quarter, the company secured major awards across domestic space domains, cyber defence, and international markets. These allocations highlight the strategic importance of intelligence sectors within the United States defence apparatus.
The specific contract bookings illustrate the diversified nature of future revenue streams across civil and federal authorities. Key first-quarter awards included:
These allocations increasingly prioritise advanced military cybersecurity solutions, a sector experiencing massive structural demand as Zero Trust architectures become mandatory across allied defence networks.
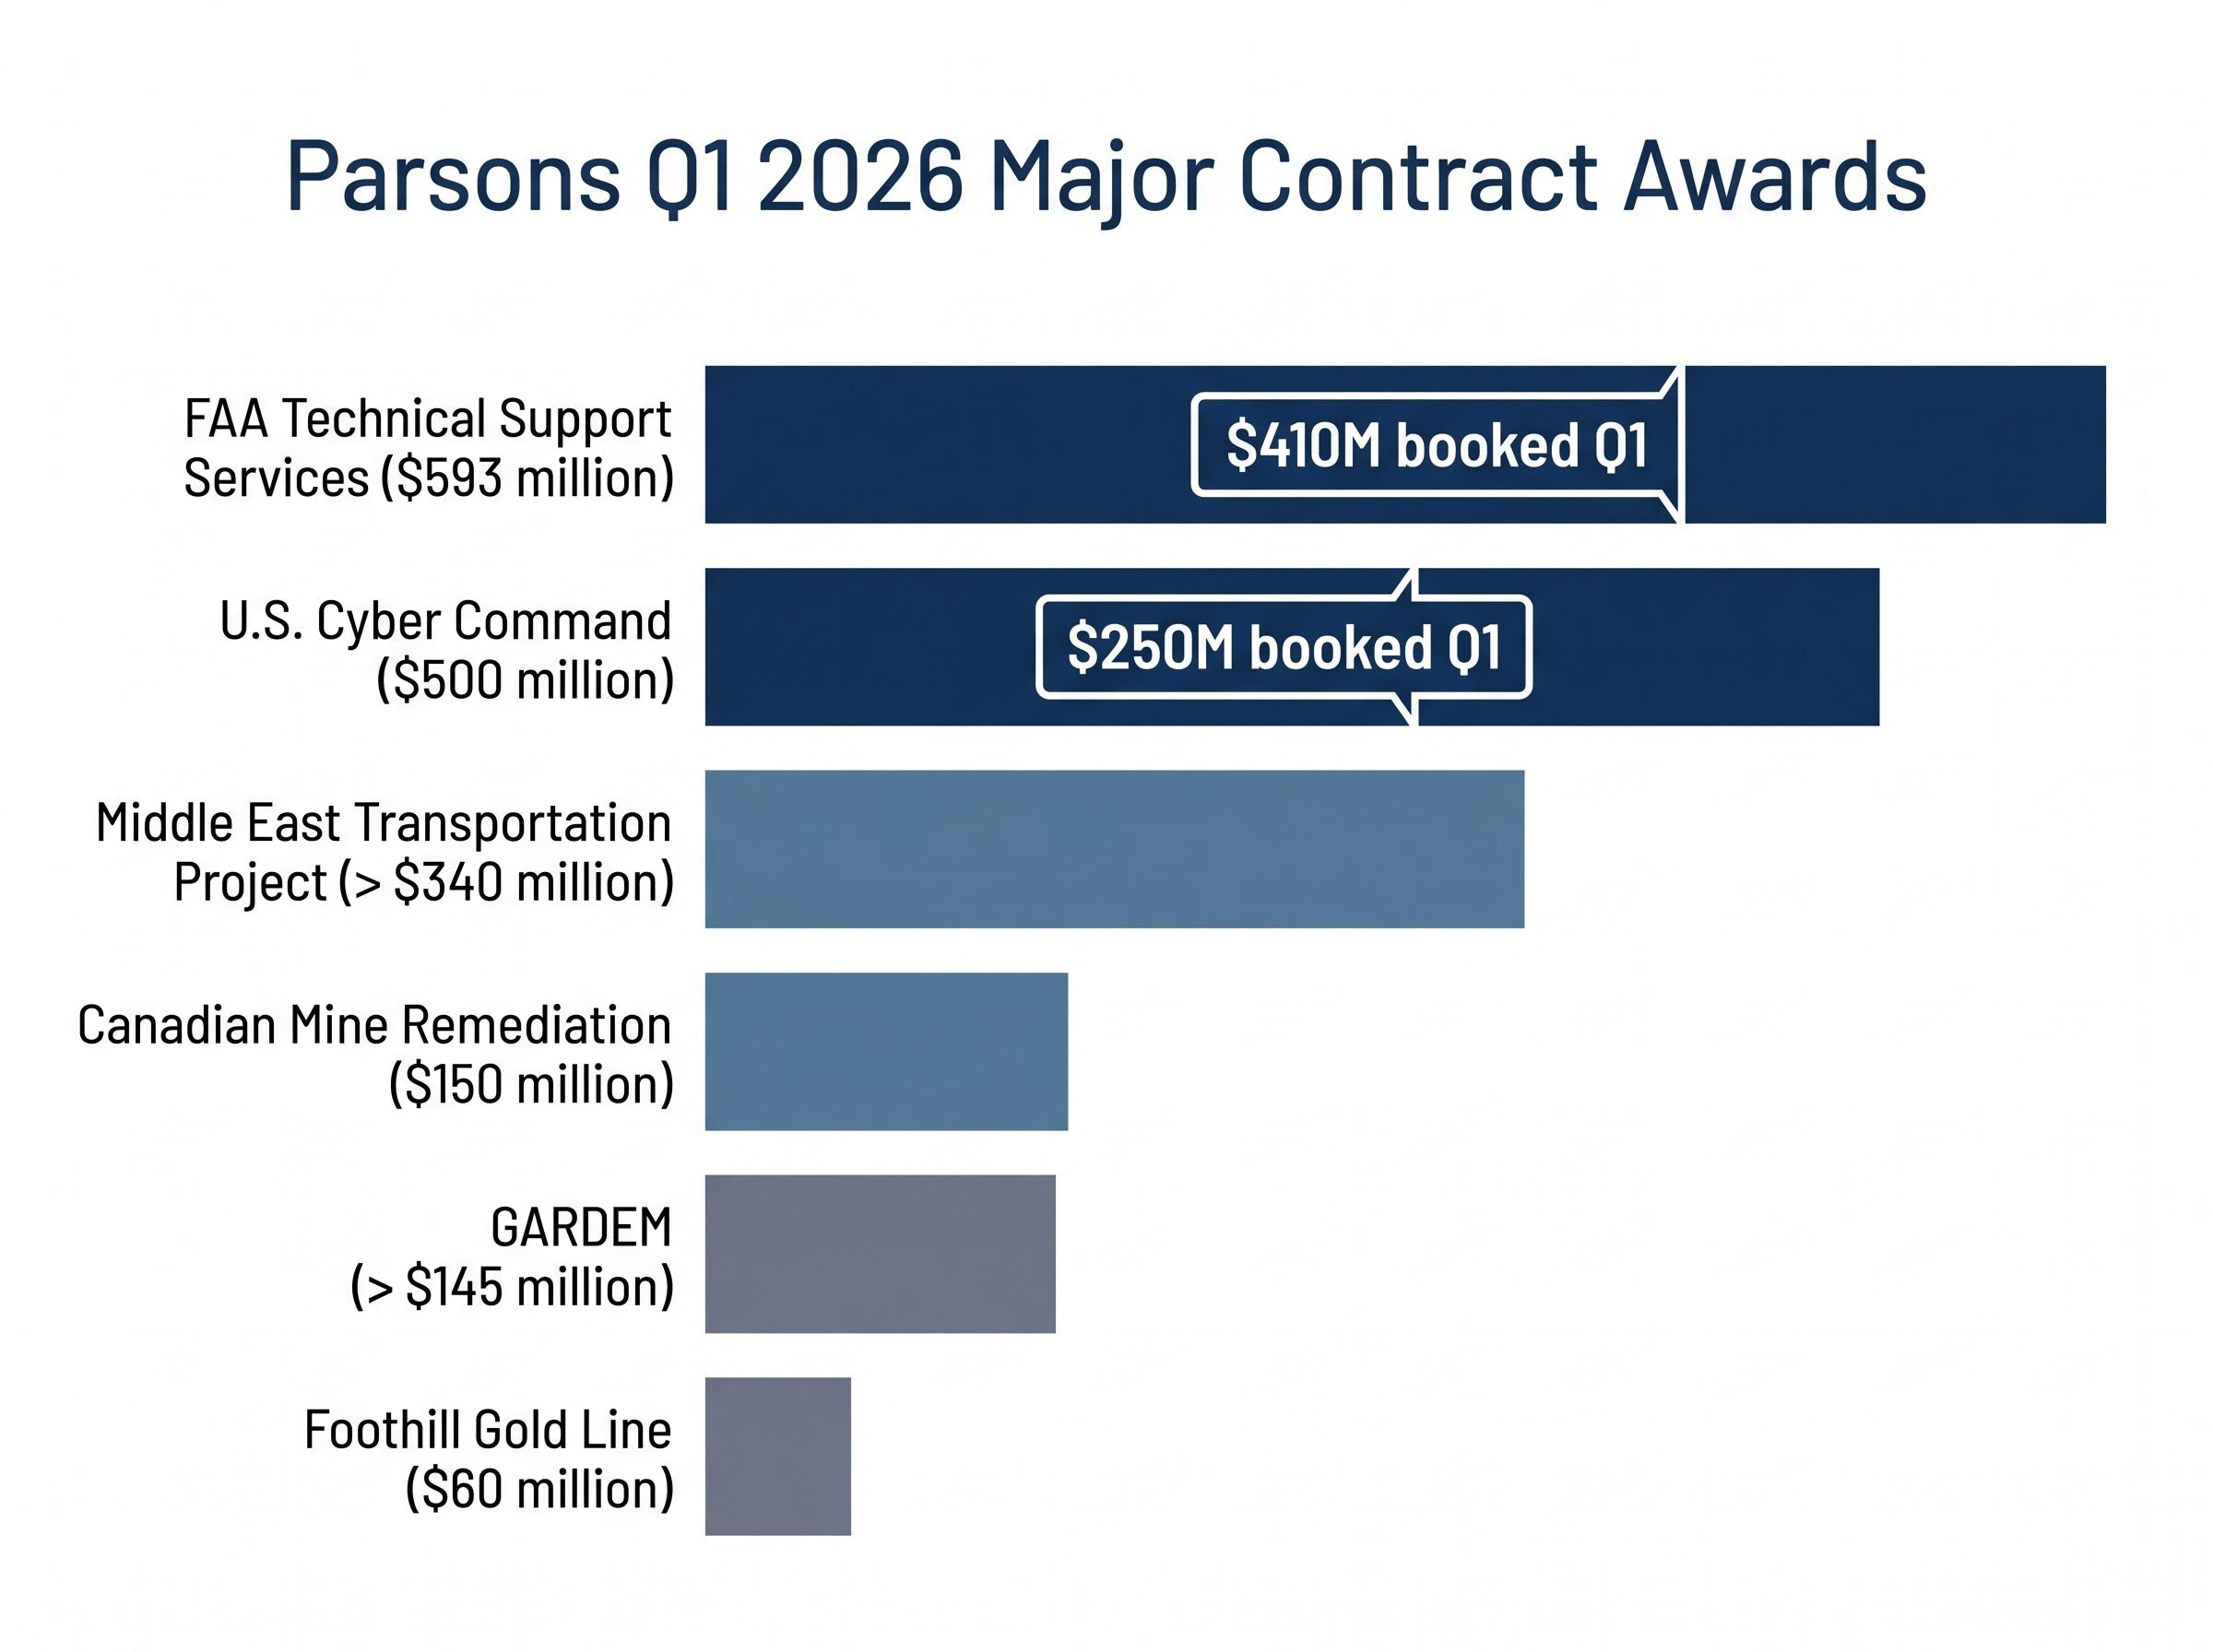
FAA Technical Support Services extension valued at $593 million, with $410 million booked in the first quarter for transportation upgrades. U.S. Cyber Command contract worth up to $500 million, with $250 million recognised in the quarter for advanced defence operations. Middle East Transportation Project valued at over $340 million, supporting massive international infrastructure development. GARDEM contract valued at over $145 million, bolstering missile and space-related technological capabilities. Canadian Mine Remediation project adding $150 million to the infrastructure pipeline. Foothill Gold Line transit project securing an additional $60 million.
Momentum has continued steadily into the second quarter of the fiscal year. Following the close of the reporting period, the company secured an additional $400 million in Other Transaction Agreements. It also added a new $184 million single-award classified IDIQ contract with a seven-year ceiling.
Seeing the specific government agencies awarding these contracts helps investors understand exactly where the company’s revenue will originate over the next decade.
Management reiterated its full-year 2026 financial guidance following the first-quarter results. The company projects revenue between $6.5 billion and $6.8 billion for the year, with the midpoint implying a solid 4.5% annual growth rate. This midpoint of $6.65 billion aligns closely with the Wall Street consensus estimate.
Full-year adjusted EBITDA is forecast to reach between $615 million and $675 million. Operating cash flow projections remain steady at $470 million to $530 million.
Past performance does not guarantee future results. Financial projections are subject to market conditions and various risk factors.
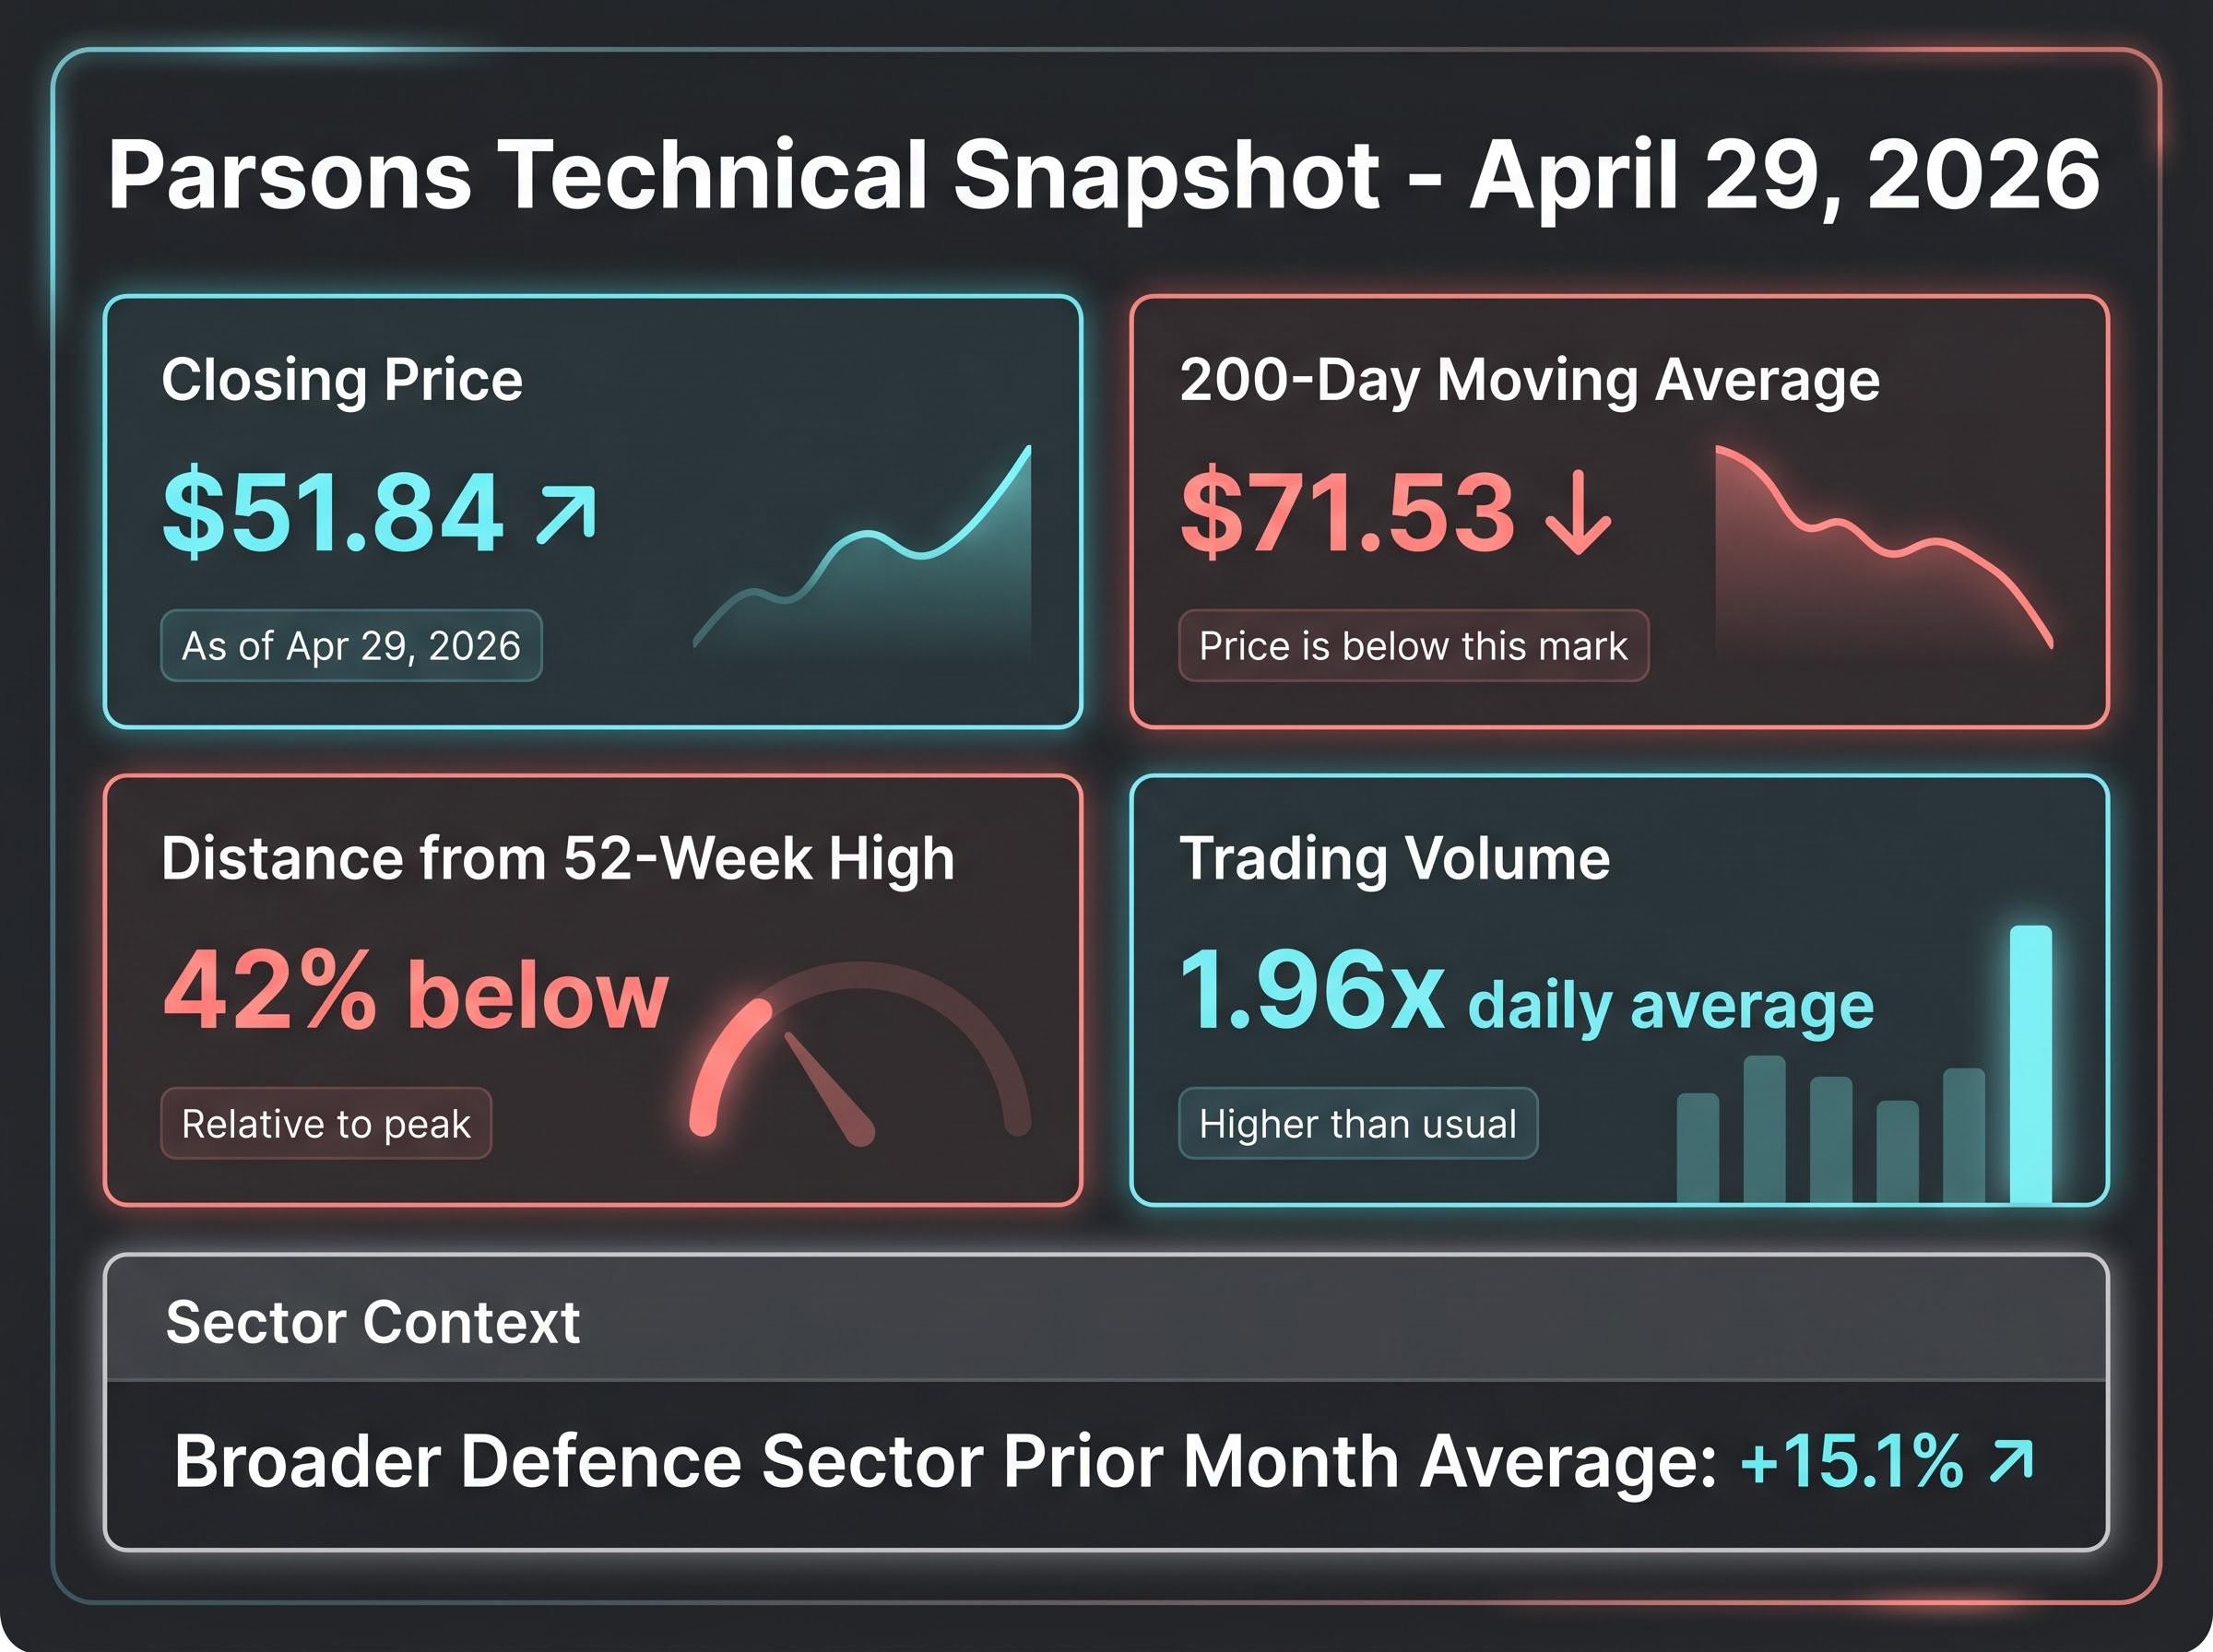
The equity markets processed this fundamental data with relative caution on earnings day. The stock closed at $51.84 on elevated trading volume that reached 1.96 times the daily average. This muted response contrasted sharply with the highly positive sentiment observed across the broader defence contractor sector, which averaged a 15.1% gain over the prior month.
From a technical perspective, the stock continues to trade below its 200-day moving average of $71.53. Traders frequently monitor the 200-day moving average as a barometer for long-term trend direction, and remaining below this threshold suggests ongoing technical consolidation.
Recent technical coverage of Parsons stock highlights this prolonged period below key moving averages as a notable point of divergence from broader sector momentum.
The stock currently sits 42% below its 52-week high. Contextualising this price action against the financial guidance helps investors weigh technical weakness against underlying fundamental strength.
The initial quarter of 2026 presents a clear dichotomy between superficial revenue contraction and structural business expansion. While a single classified contract distorted top-line optics, the company successfully generated record uncompleted project value and expanded its profitability margins.
The robust book-to-bill ratio fundamentally insulates the core business against near-term sector volatility. Management has proven its ability to extract higher earnings from its specialised intelligence and infrastructure portfolios, effectively converting pipeline momentum into tangible margin growth.
Looking ahead, the execution of the record $9.3 billion backlog will dictate the company’s trajectory through the remainder of 2026. If the firm can maintain its recent operational efficiency while converting funded commitments into billed revenue, the current technical discount may narrow against its historical averages.
This article is for informational purposes only and should not be considered financial advice. Investors should conduct their own research and consult with financial professionals before making investment decisions.
Parsons' reported 4% revenue contraction in Q1 2026 was entirely attributed to a scheduled volume reduction on a single fixed-price classified contract within its Federal Solutions segment.
When adjusted for the specific classified contract, Parsons' overall company growth was 8% year-over-year, and its Federal Solutions segment grew by an even stronger 12%.
Parsons achieved a robust 1.4x enterprise-wide book-to-bill ratio, securing $2.1 billion in net bookings, which indicates the company is acquiring new work faster than it completes existing projects, signaling future expansion.
Parsons delivered a record first-quarter adjusted EBITDA of $151 million, a 1% increase year-over-year, which expanded its adjusted EBITDA margin to a notable 10.1% despite the top-line revenue contraction.
Parsons' total uncompleted project value reached a record $9.3 billion, representing the highest backlog since its 2019 IPO, which provides substantial multi-year revenue insulation for the firm.