Lululemon Fundamental Analysis: the Price of Brand Dilution
13 hrs ago
Glanbia shares climbed 8.6% on 29 April 2026, the day the Irish nutrition group released its Q1 Interim Management Statement. The market was not reacting to a headline revenue figure. It was reacting to a quarter that ran well ahead of what analysts had been modelling, with group like-for-like revenue growth of 7.2% against a consensus expectation of 4.6%. Inside that beat sat a Performance Nutrition division growing at 11.5%, an Optimum Nutrition brand growing at 18.8%, and an international arm expanding at 23.4%. At the same time, rising whey input costs forced double-digit price increases in April 2026 and introduced a demand elasticity risk that management openly acknowledged for the remainder of the year. This analysis unpacks the brand-level and geographic forces behind the outperformance, maps the dual role whey pricing plays across the group’s two segments, and assesses what the revised guidance implies for investors watching Glanbia through the rest of 2026.
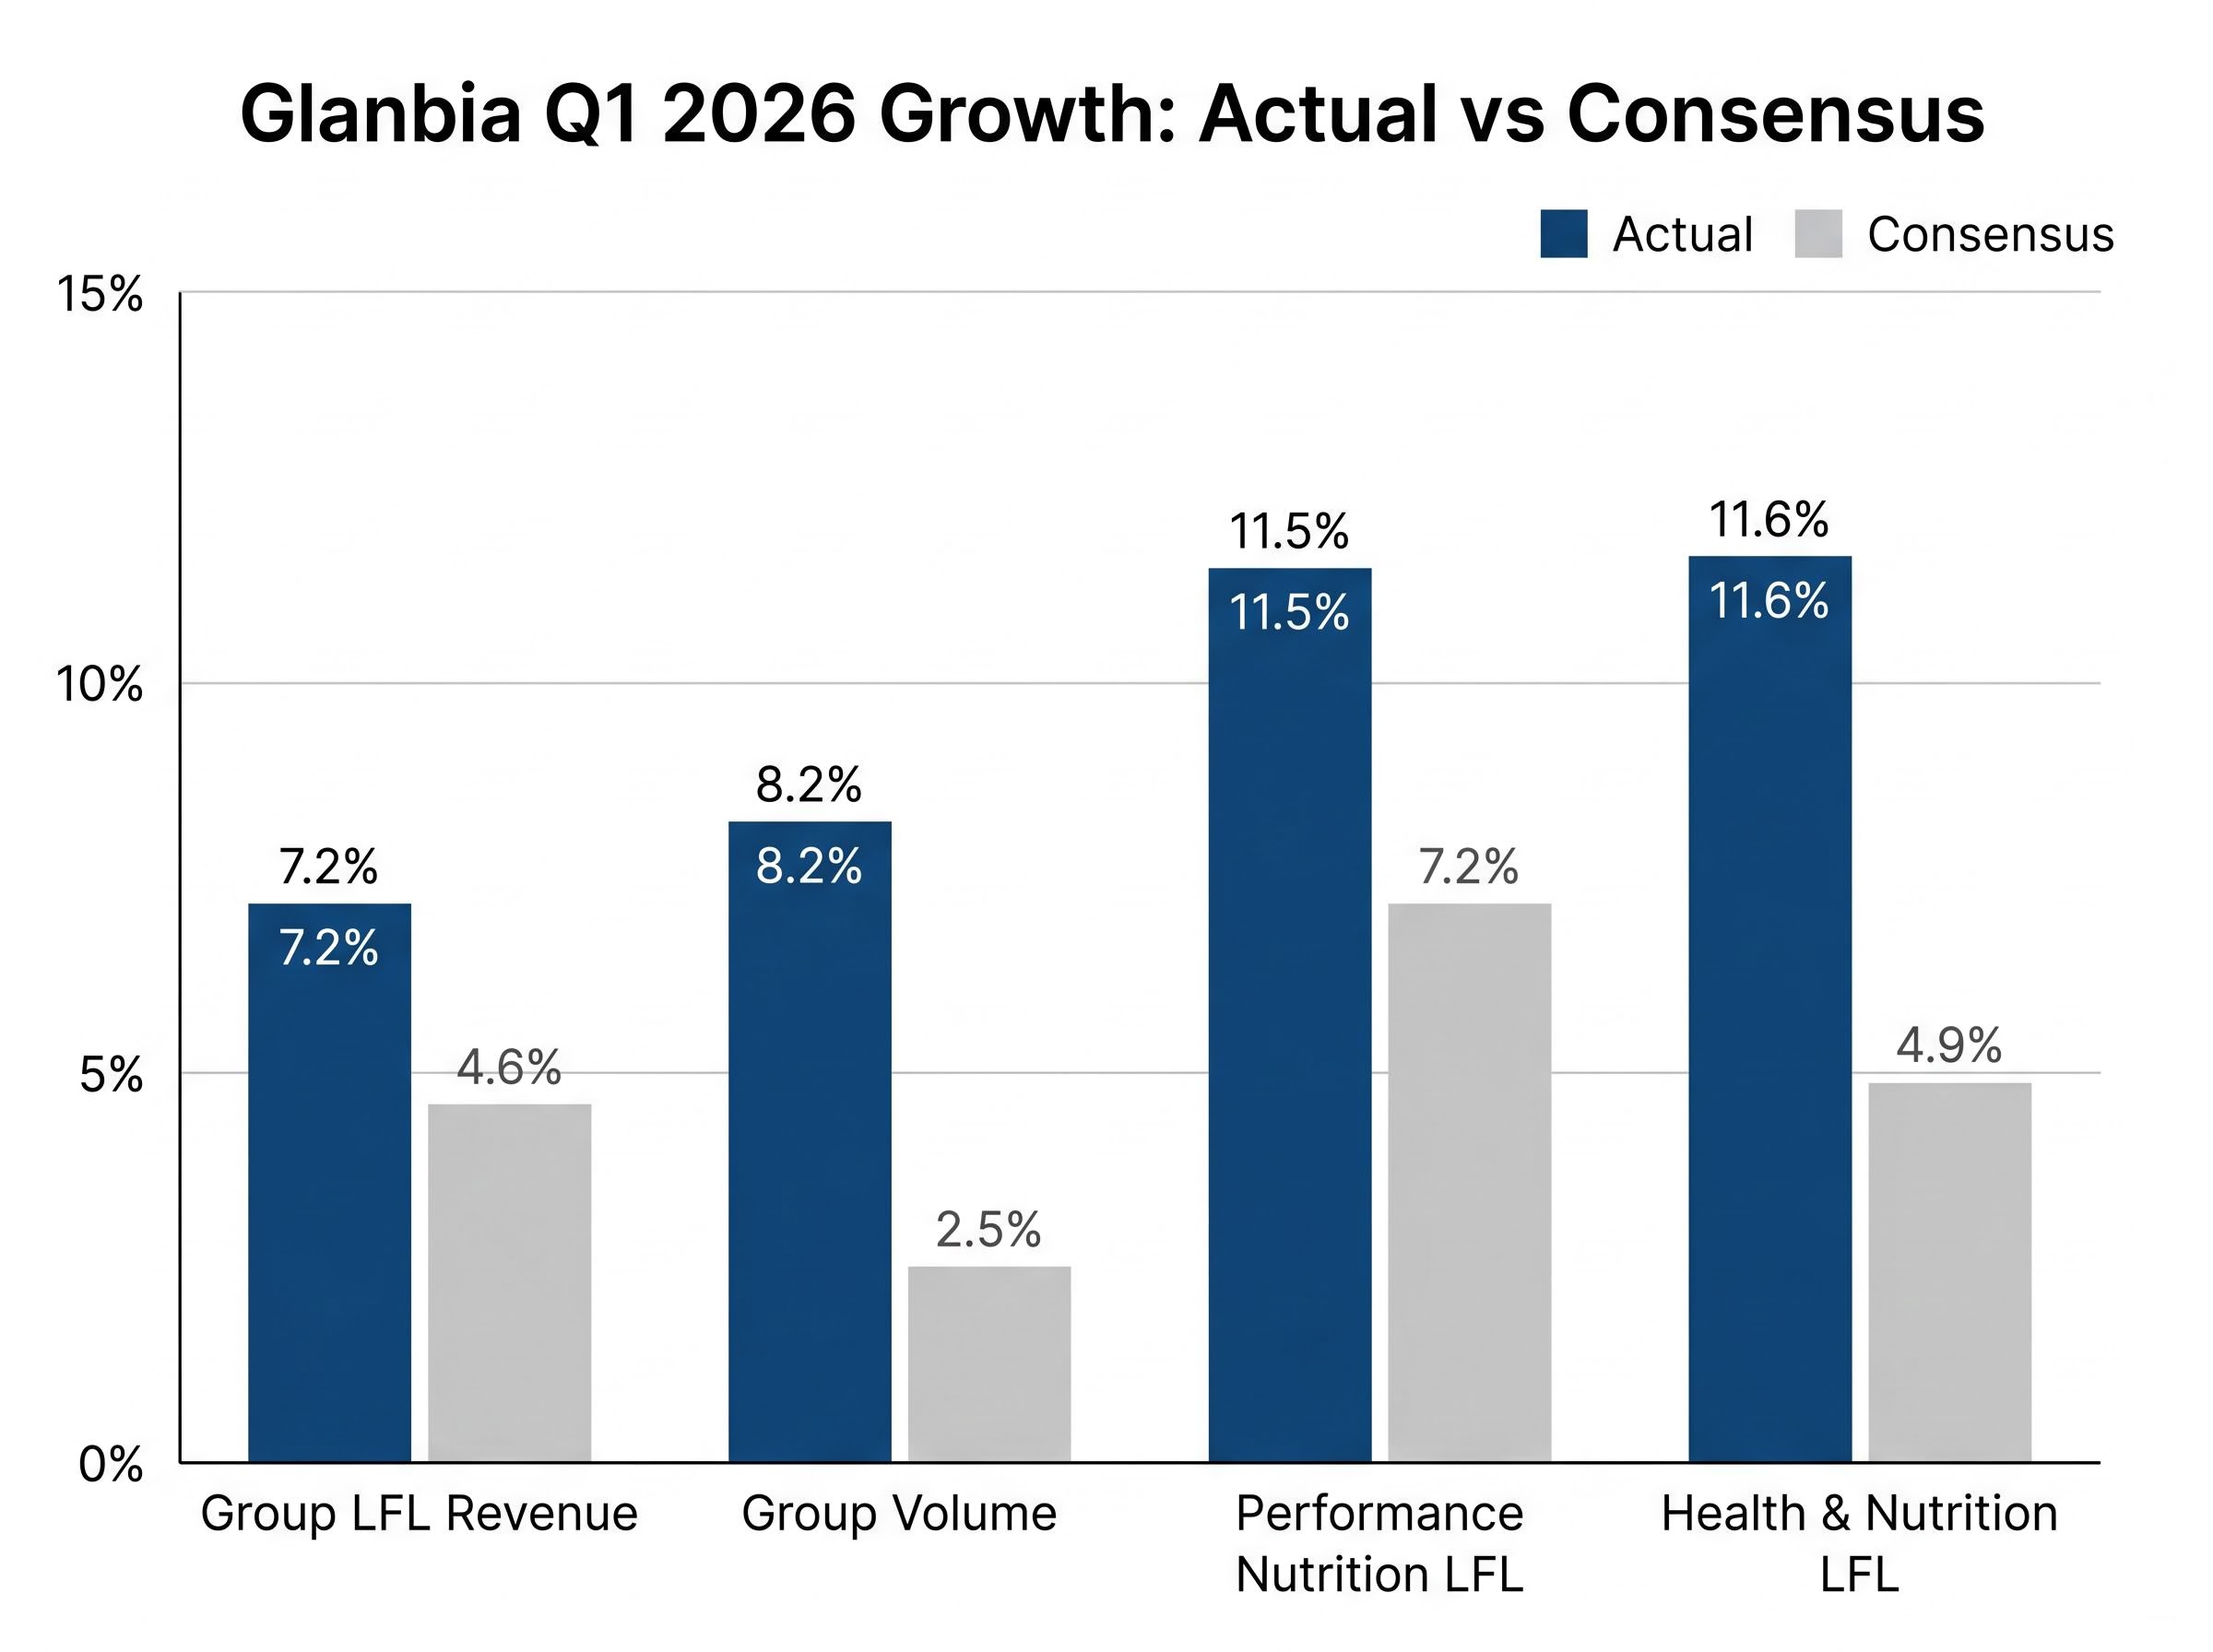
The gap between what Glanbia delivered and what the market expected is wide enough to warrant a closer look at its composition. Group like-for-like revenue growth of 7.2% exceeded the 4.6% consensus estimate, but the more telling figure sits underneath: group volume growth of 8.2%, against a consensus forecast of just 2.5%.
That ratio matters. A revenue beat driven by price increases alone can obscure softening demand. A beat driven by volume growth of more than three times the expected rate signals genuine consumer pull through the product portfolio.
Both divisions contributed. Performance Nutrition posted like-for-like growth of 11.5% versus the 7.2% consensus, while Health and Nutrition came in at 11.6% against an expected 4.9%. This was not a single-division story.
| Metric | Actual (Q1 2026) | Consensus estimate |
|---|---|---|
| Group LFL revenue growth | 7.2% | 4.6% |
| Group volume growth | 8.2% | 2.5% |
| Performance Nutrition LFL growth | 11.5% | 7.2% |
| Health and Nutrition LFL growth | 11.6% | 4.9% |
For investors evaluating the durability of Glanbia’s growth, the volume composition of this quarter carries more analytical weight than the headline revenue number. Volume-led beats signal demand strength; price-led beats can unwind in a single quarter.
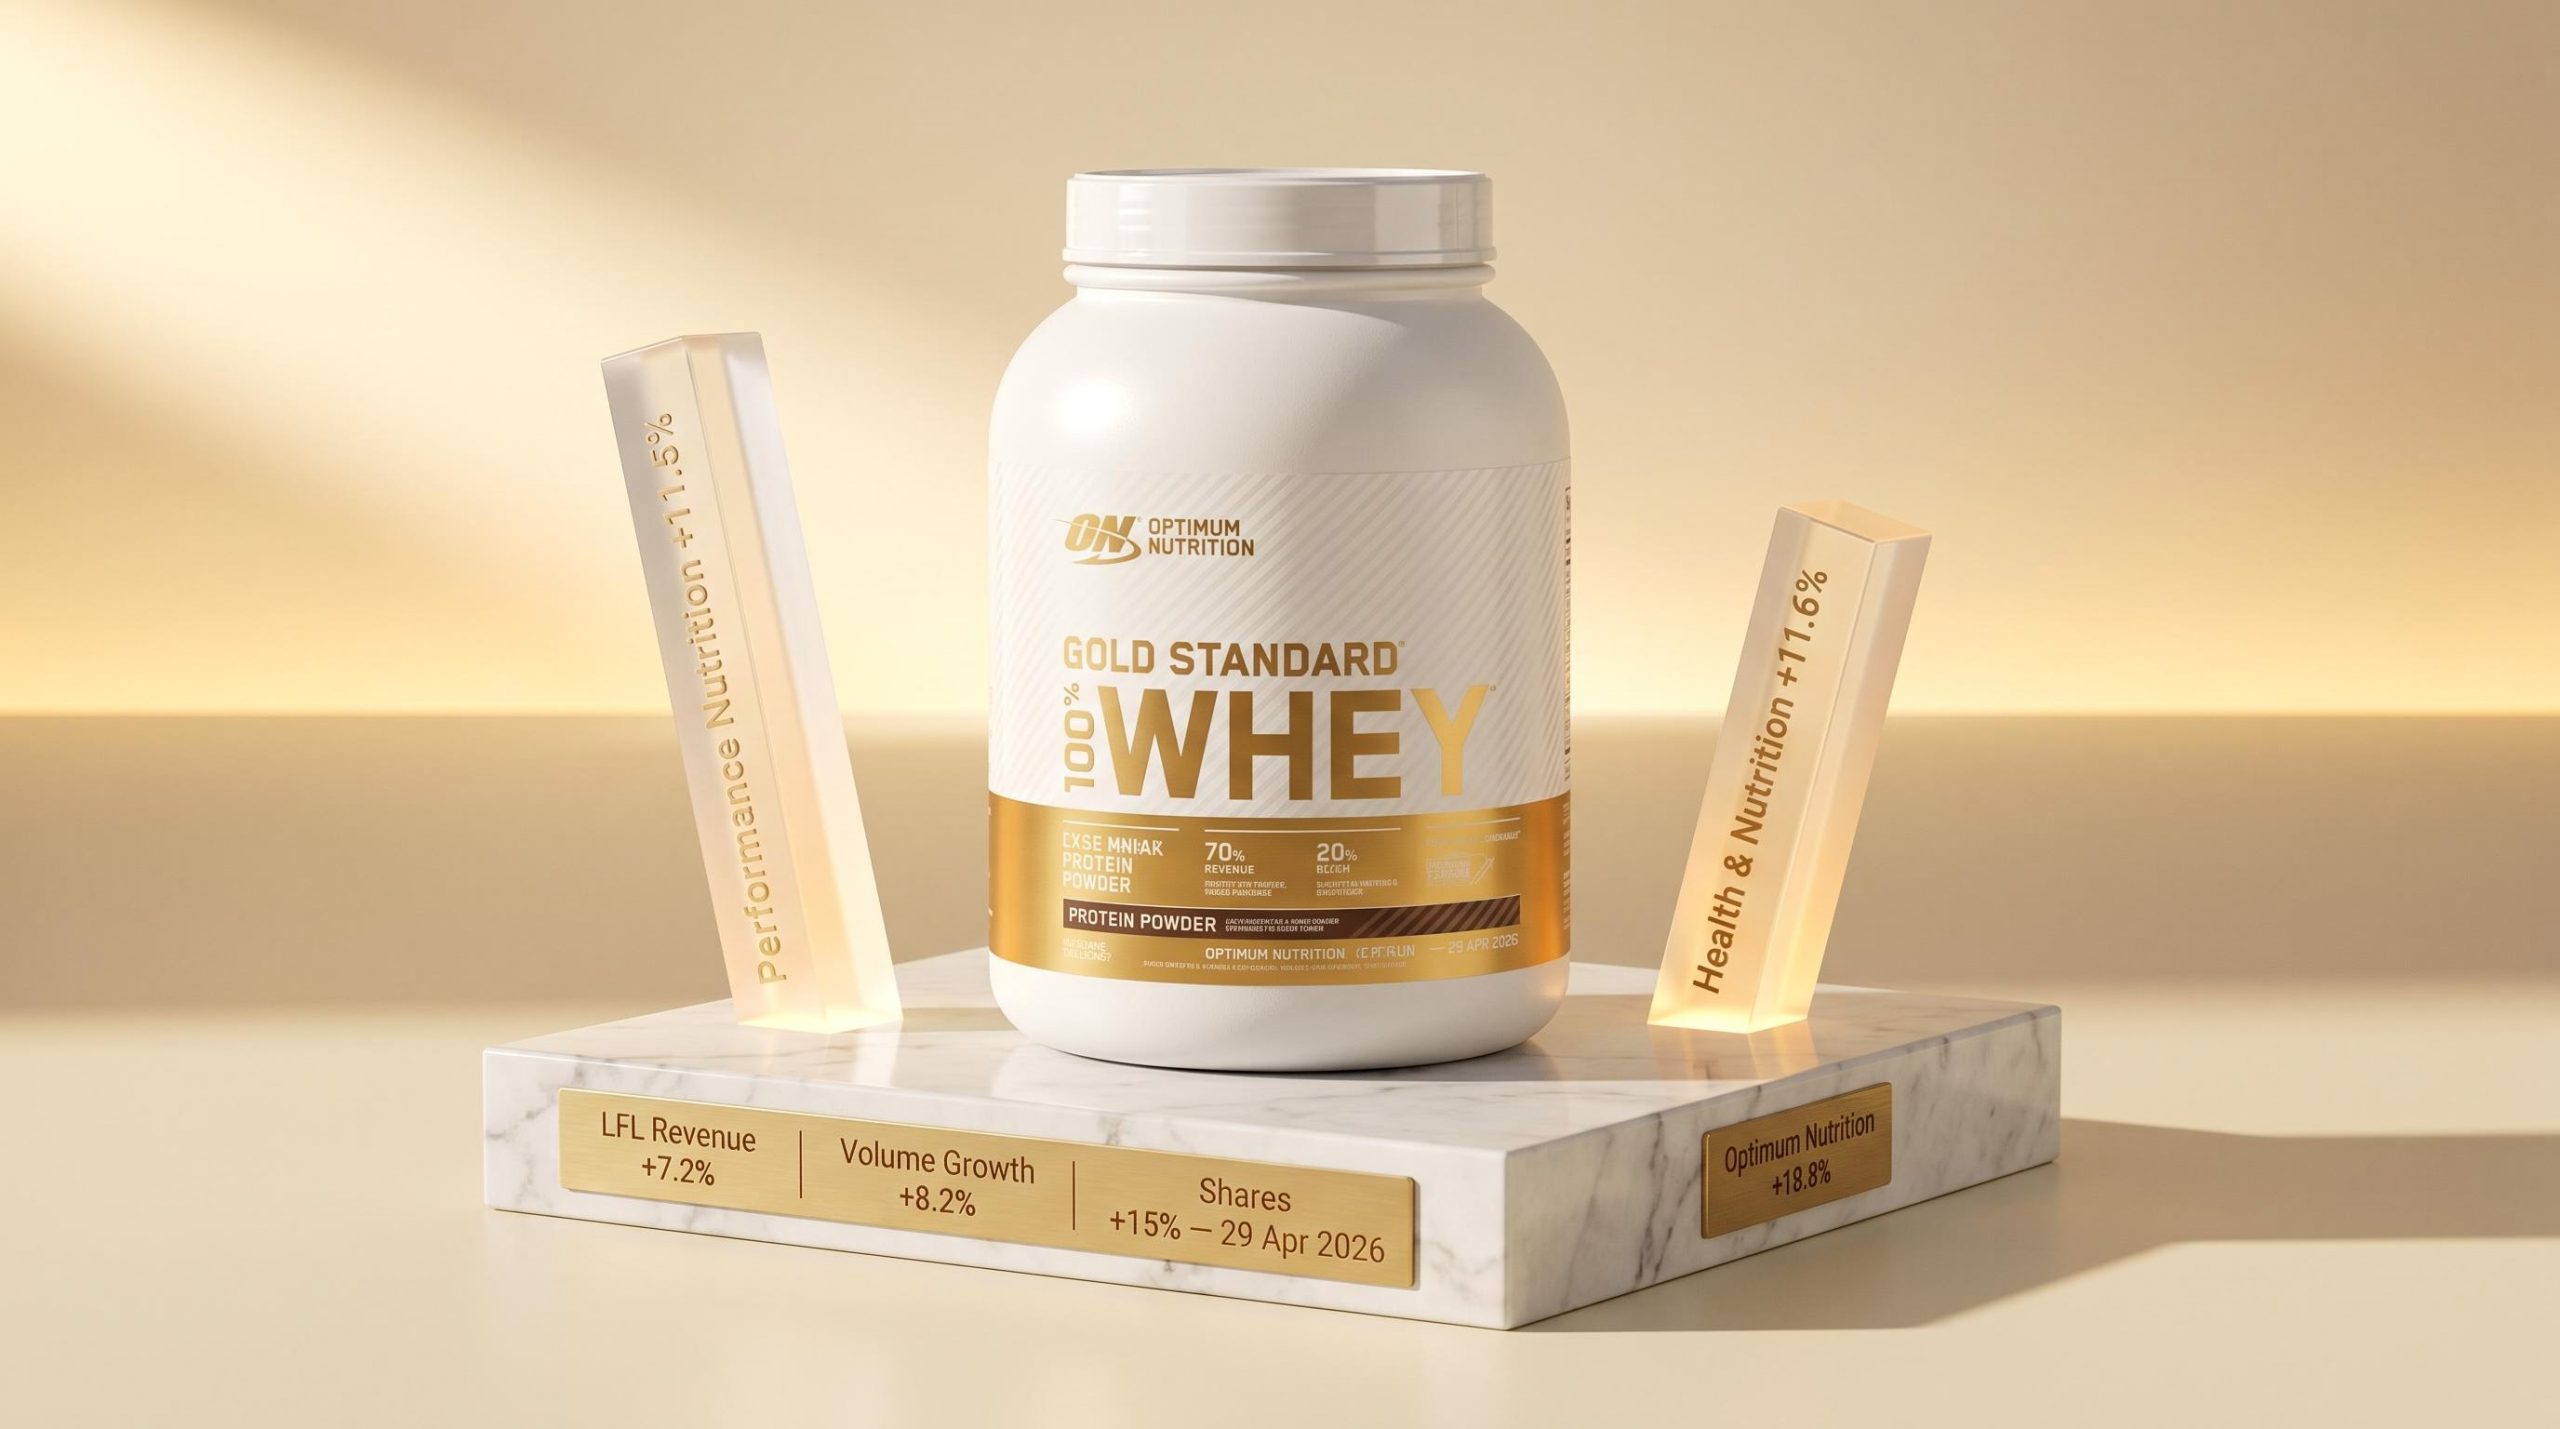
Performance Nutrition grew at 11.5%, but the engine inside that figure ran considerably faster. Optimum Nutrition, the group’s flagship brand, posted growth of 18.8% in Q1 2026, meaning it accounted for a disproportionate share of the divisional result.
Management cited Gold Standard Whey and Creatine as the specific product lines contributing to the brand’s performance. Both sit at the premium end of the sports nutrition market, where consumer loyalty tends to be higher and margin profiles stronger than in value-tier alternatives.
Optimum Nutrition’s 18.8% growth rate materially outpaced the Performance Nutrition divisional average of 11.5%, highlighting the brand’s outsized contribution to the segment’s Q1 result.
The input cost context sits behind this story. WPC 34% (Whey Protein Concentrate) spot prices ranged from approximately $1.60 to $1.70 per pound in the Central and West US as of late April 2026. Despite that elevated cost environment, volume held. The implication is that Glanbia’s premium positioning at the brand level, particularly through Optimum Nutrition, is sustaining consumer demand even as input prices rise.
The Performance Nutrition divisional growth rate of 11.5% is strong. The international component of that growth, at 23.4%, is structurally different and warrants separate analysis.
International Performance Nutrition growth running at roughly double the divisional average suggests it is gaining share of total segment revenue. For a business historically weighted toward North American markets, this rate of geographic diversification carries forward implications for earnings risk. A broader revenue base reduces dependence on any single region’s discretionary spending cycle.
Euromonitor International sports nutrition market data published in February 2026 recorded 9% current value growth in the category between 2024 and 2025, with gym culture adoption and an ageing population identified as the primary structural drivers of international expansion across markets including South Korea, Brazil, and Germany.
Management moved Performance Nutrition organic sales guidance to the upper end of the 5-7% medium-term target range following Q1, and international strength is a material contributor to that revision.
The Q1 IMS did not provide a region-specific breakdown. No granularity on Europe, the Middle East, or Asia-Pacific was disclosed. Currency effects on international revenue also remain undisclosed. The FY2025 Annual Report described a “challenging macroeconomic and operating environment” as the baseline against which this international acceleration stands out, but the specific drivers, whether market share gains, new distribution channels, or favourable local demand conditions, will likely only become visible at the half-year results.
For investors, the 23.4% figure is a signal worth monitoring, not a fully interpretable data point. The half-year disclosure should clarify whether this pace is broad-based across geographies or concentrated in one or two high-growth markets.
Glanbia operates on both sides of the whey protein price equation, a structural feature that makes the current cost environment simultaneously beneficial and threatening depending on which segment is in focus.
The mechanics are straightforward. The Dairy Nutrition segment sells whey protein solutions as outputs. When whey prices rise, Dairy Nutrition’s revenue and EBITDA benefit directly. Higher prices for the product it sells mean a larger top line. The Performance Nutrition segment buys whey protein as an input to manufacture products like Gold Standard Whey. When the same prices rise, Performance Nutrition’s input costs increase, compressing margins unless the business can pass those costs through to consumers.
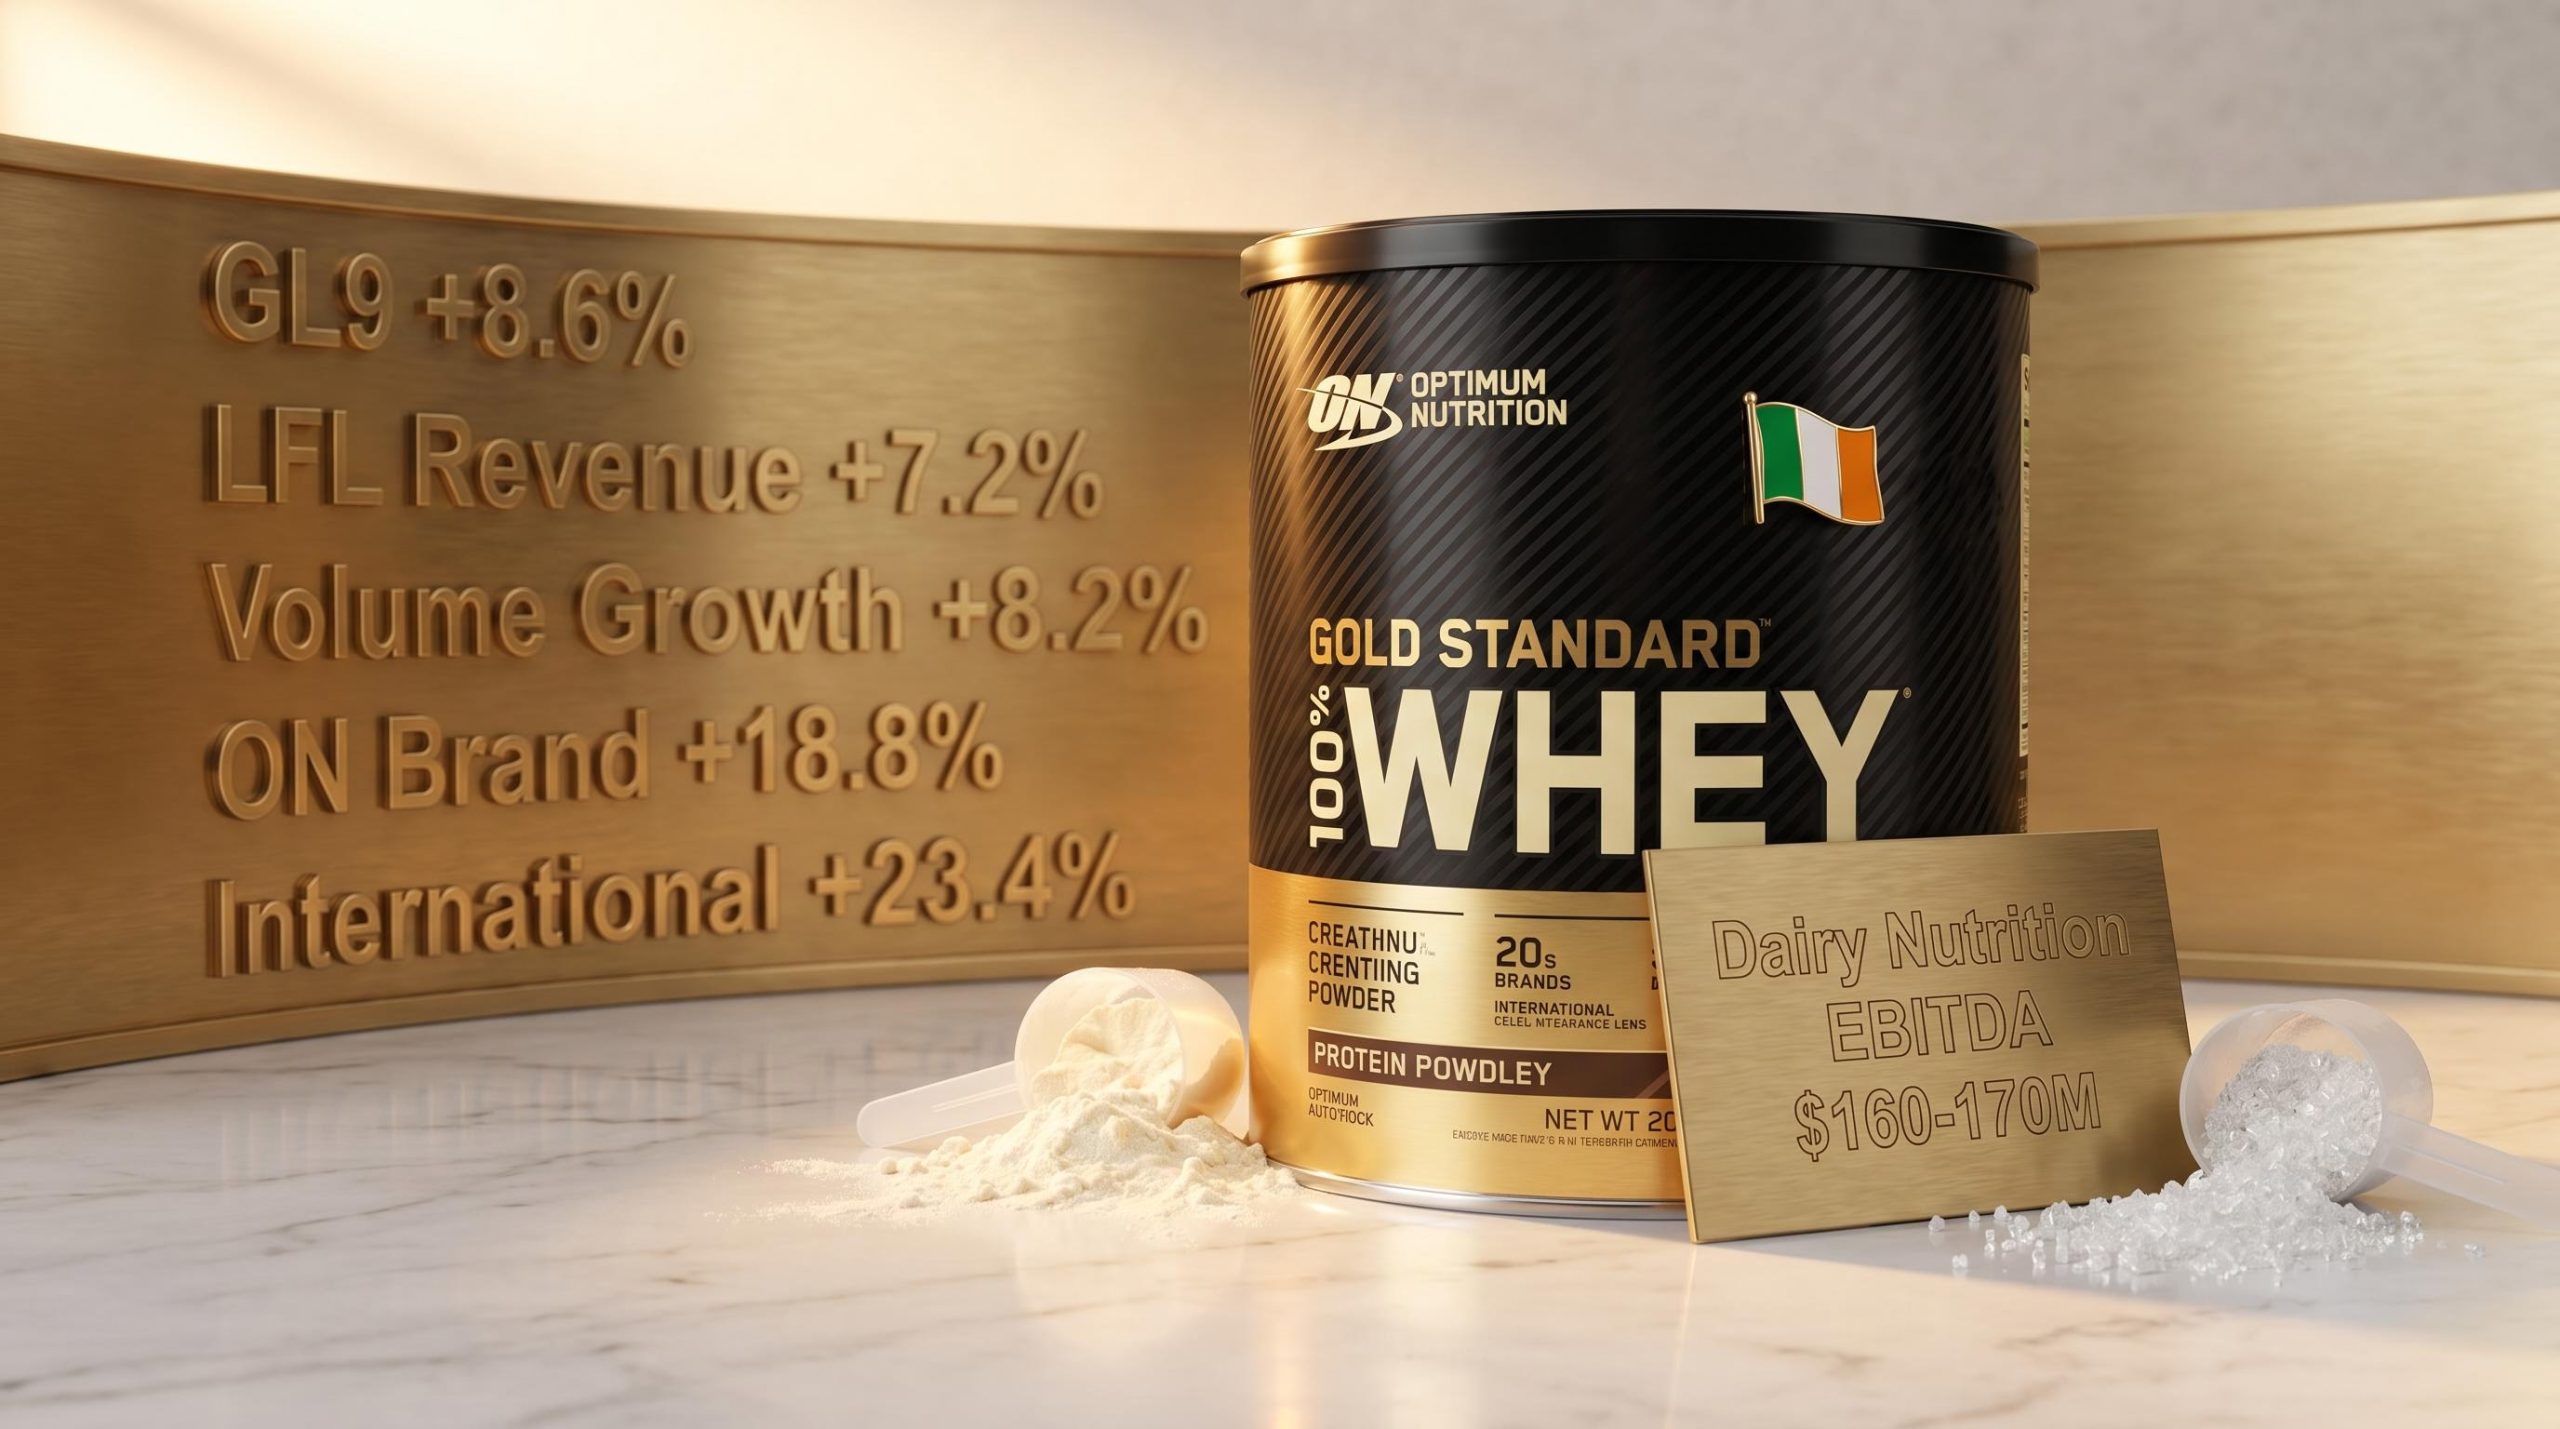
This asymmetry is visible in the Q1 guidance revisions. Dairy Nutrition’s EBITDA guidance for FY2026 was raised from $150-160 million to $160-170 million, a direct reflection of whey price strength lifting the segment’s output pricing. Negative cheese market dynamics partially offset this benefit on the pricing side, but the net effect was still positive enough to warrant the upgrade.
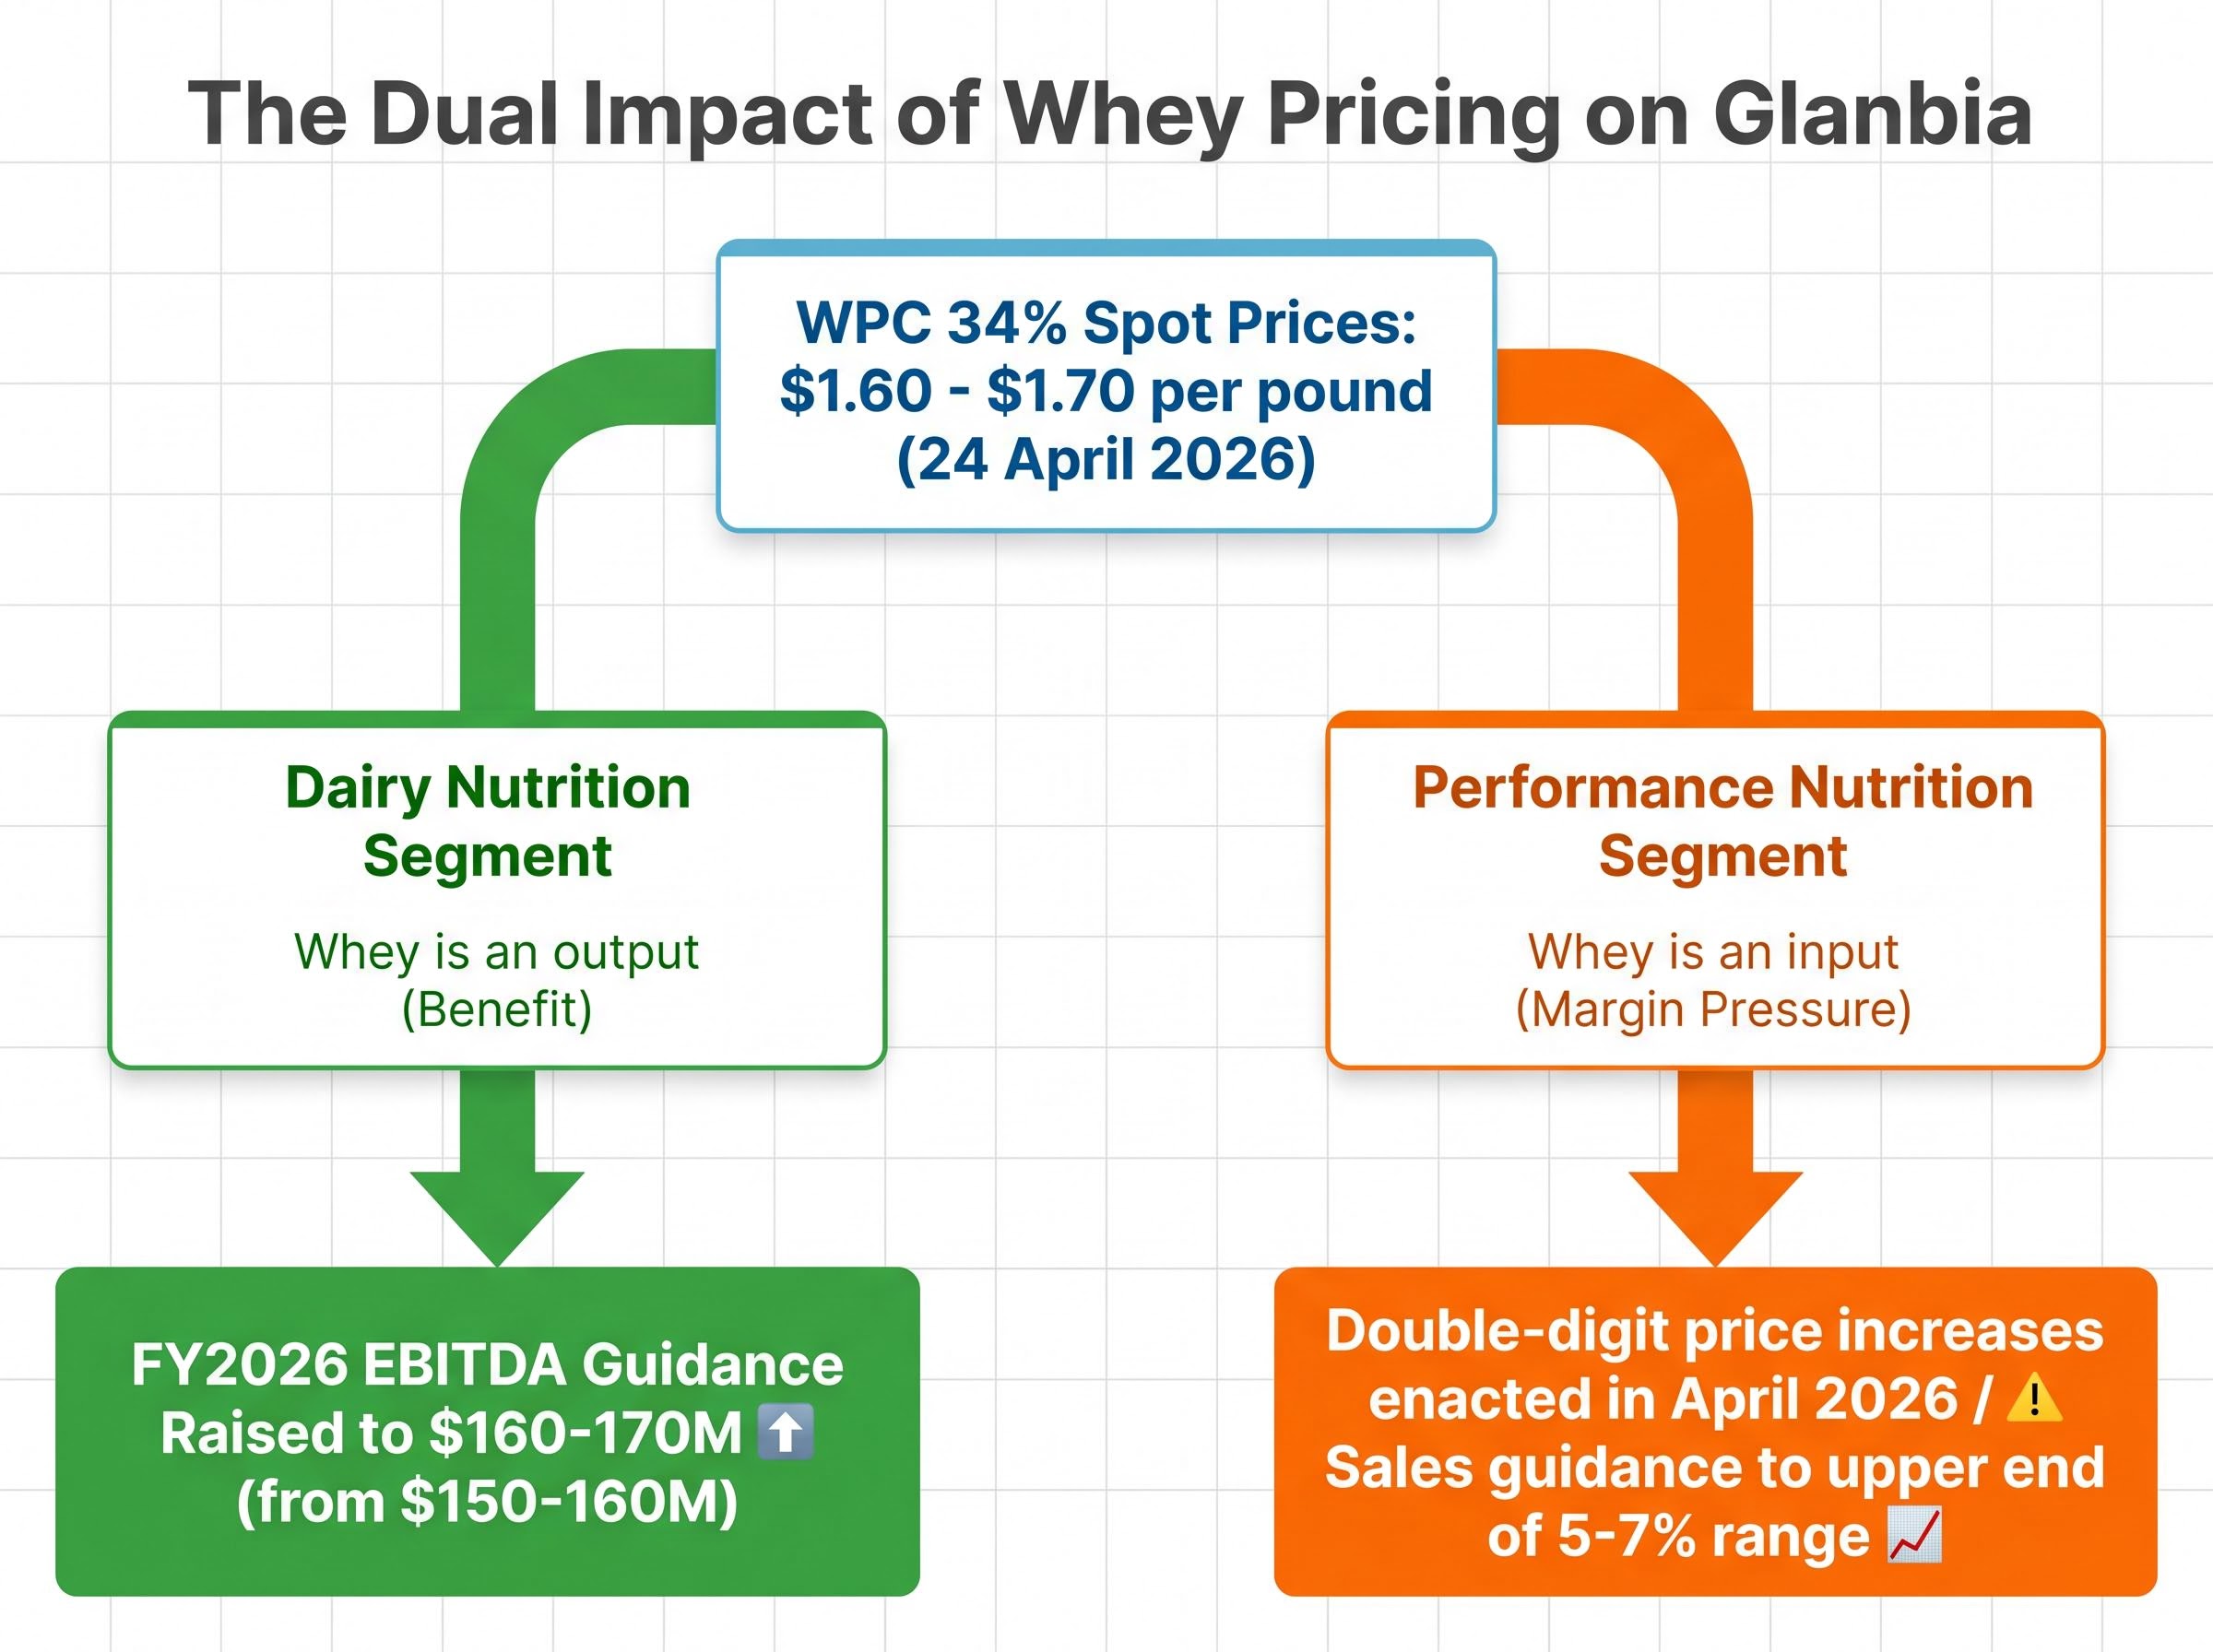
WPC 34% spot prices of approximately $1.60 to $1.70 per pound as of 24 April 2026 confirm the elevated input cost environment. The FY2025 Annual Report flagged whey and dairy protein price volatility as a persistent headwind across Performance Nutrition.
Dairy protein supply chains have been under restructuring pressure across the sector, with Synlait Milk reporting an 88% EBITDA improvement in HY26 after divesting its North Island assets and narrowing its underlying NPAT loss to $34.7 million, developments that signal a broader reset in the manufacturing infrastructure underpinning whey and dairy protein markets.
CLAL WPC 34% weekly price data, sourced from USDA Agricultural Marketing Service Dairy Market News, confirms the $1.60-$1.70 per pound range recorded in the Central and West US markets during the final week of April 2026, providing the commodity benchmark against which Glanbia’s pricing decisions were calibrated.
| Segment | Effect of higher whey prices | FY2026 guidance change |
|---|---|---|
| Dairy Nutrition | Positive: whey is an output; higher prices lift revenue and EBITDA | EBITDA raised to $160-170M (from $150-160M) |
| Performance Nutrition | Negative: whey is an input; higher prices compress margins unless passed through | Organic sales guidance moved to upper end of 5-7% range |
This internal offset mechanism is worth understanding for anyone modelling Glanbia’s net earnings exposure to commodity price movements. The two segments do not simply add; they partially hedge each other.
Glanbia enacted double-digit price increases across Performance Nutrition in April 2026 to offset the elevated whey input costs described above. The timing is analytically significant: the strong Q1 volume figures were recorded before this pricing action fully landed.
The causal chain runs as follows:
EPS guidance revised to the upper end of 7-11%: Management’s willingness to narrow the range upward, even while flagging elasticity risk from April price increases, suggests confidence that demand resilience will hold the earnings trajectory through FY2026.
The 9.2% volume growth recorded in Q1 provides the baseline against which any future softening should be measured. If Q2 volume decelerates to mid-single digits, the April pricing action will be the most likely explanation. If volume holds near Q1 levels, Glanbia’s pricing power at the premium end of sports nutrition will have been confirmed under a genuine cost stress test.
Past performance does not guarantee future results. Financial projections are subject to market conditions and various risk factors.
Three separate guidance lines moved in the same direction following the Q1 IMS. That convergence is more analytically durable than a single metric revision.
The analyst community’s response to FY2025 results in February 2026 provides context. According to the Irish Times, the full-year report prompted estimate upgrades, suggesting that the market had already been repricing Glanbia’s guidance signals constructively in this cycle. The GL9 share price sat at approximately €17.52 on 27 April 2026 before the IMS release; the 8.6% gain on 29 April extended that constructive repricing.
Guidance revisions under supply pressure are not unique to Glanbia in the nutrition sector: a2 Milk cut its FY26 revenue outlook in April 2026 as China supply chain disruptions deferred revenue recognition into FY27, a parallel case of demand holding firm while logistics constraints shaped the earnings trajectory.
The first is consumer response to the April price increases. If demand elasticity in Performance Nutrition proves steeper than management anticipates, volume deceleration could offset the margin benefit of higher prices.
The second is the trajectory of WPC 34% spot prices through the middle quarters of the year. If whey prices stabilise or decline, the margin pressure on Performance Nutrition eases and the cost-pass-through friction diminishes. If prices continue to climb, further pricing action may be required, compounding the elasticity risk.
These statements are speculative and subject to change based on market developments and company performance.
The Q1 2026 result was volume-led, brand-specific, and geographically broad. Those three characteristics make it structurally credible rather than the product of pricing leverage alone. Optimum Nutrition’s 18.8% growth, international expansion at 23.4%, and group volume growth at more than three times the consensus estimate are not figures that appear in a quarter carried by price alone.
The April price increase is the variable that separates the Q1 story from the Q2 story. Management has flagged the risk openly, and the guidance revision suggests the company believes the net impact remains manageable. Whether that belief proves correct will become visible at the half-year results, when geographic breakdowns, consumer demand elasticity, and H1 margin trends provide the first full test.
The question for investors is not whether Q1 was strong. It was. The question is whether the April pricing action turns out to be a speed bump or a ceiling.
This article is for informational purposes only and should not be considered financial advice. Investors should conduct their own research and consult with financial professionals before making investment decisions.
Glanbia reported group like-for-like revenue growth of 7.2% in Q1 2026, well ahead of the 4.6% consensus estimate, with group volume growth of 8.2% against a forecast of just 2.5%. The result drove an 8.6% share price gain on 29 April 2026.
Glanbia shares rose 8.6% on 29 April 2026 after the company released its Q1 Interim Management Statement, which showed performance materially ahead of analyst expectations across both divisions, with volume growth more than three times the consensus forecast.
Rising whey protein costs benefit Glanbia's Dairy Nutrition segment, which sells whey as an output, lifting its FY2026 EBITDA guidance to $160-170 million. However, they increase input costs for the Performance Nutrition segment, which buys whey to manufacture products like Gold Standard Whey, compressing margins unless prices are passed on to consumers.
Glanbia implemented double-digit price increases across Performance Nutrition in April 2026 to offset elevated whey input costs. Management openly acknowledged anticipated demand elasticity risk for the remainder of FY2026, meaning volume growth could decelerate in Q2 and Q3 if consumers reduce purchases in response to higher prices.
Following the Q1 IMS, Glanbia revised its adjusted EPS growth guidance to the upper end of the 7-11% range, implying a midpoint of approximately 9%, which exceeds the prior Bloomberg consensus of approximately 8%. Performance Nutrition organic sales guidance was also moved to the upper end of the 5-7% medium-term target range.