Lululemon Fundamental Analysis: the Price of Brand Dilution
13 hrs ago

Glanbia shares jumped 8.6% on 29 April 2026, the kind of single-session move that demands a closer reading of the earnings release behind it. The Q1 2026 Interim Management Statement delivered volume growth of 8.2%, nearly three times the analyst consensus estimate of 2.5%. Yet the same release carried a management warning: double-digit price increases enacted in April 2026 to offset surging whey input costs could soften volumes in the second half of the year. The tension between those two signals, one backward-looking and strong, the other forward-looking and cautious, defines the Glanbia stock analysis for the remainder of fiscal 2026. What follows unpacks the cost-side mechanics driving that tension, explains why the Dairy Nutrition guidance upgrade and the Performance Nutrition demand risk are two sides of the same whey price coin, and identifies the specific data points investors should monitor as the year progresses.
Whey protein concentrate (WPC) is a primary raw material input for sports nutrition products. When its price moves, the impact flows directly into cost of goods sold for manufacturers like Glanbia, which relies on WPC as a core ingredient across its Optimum Nutrition portfolio and broader Performance Nutrition segment.
The scale of the recent move is difficult to overstate.
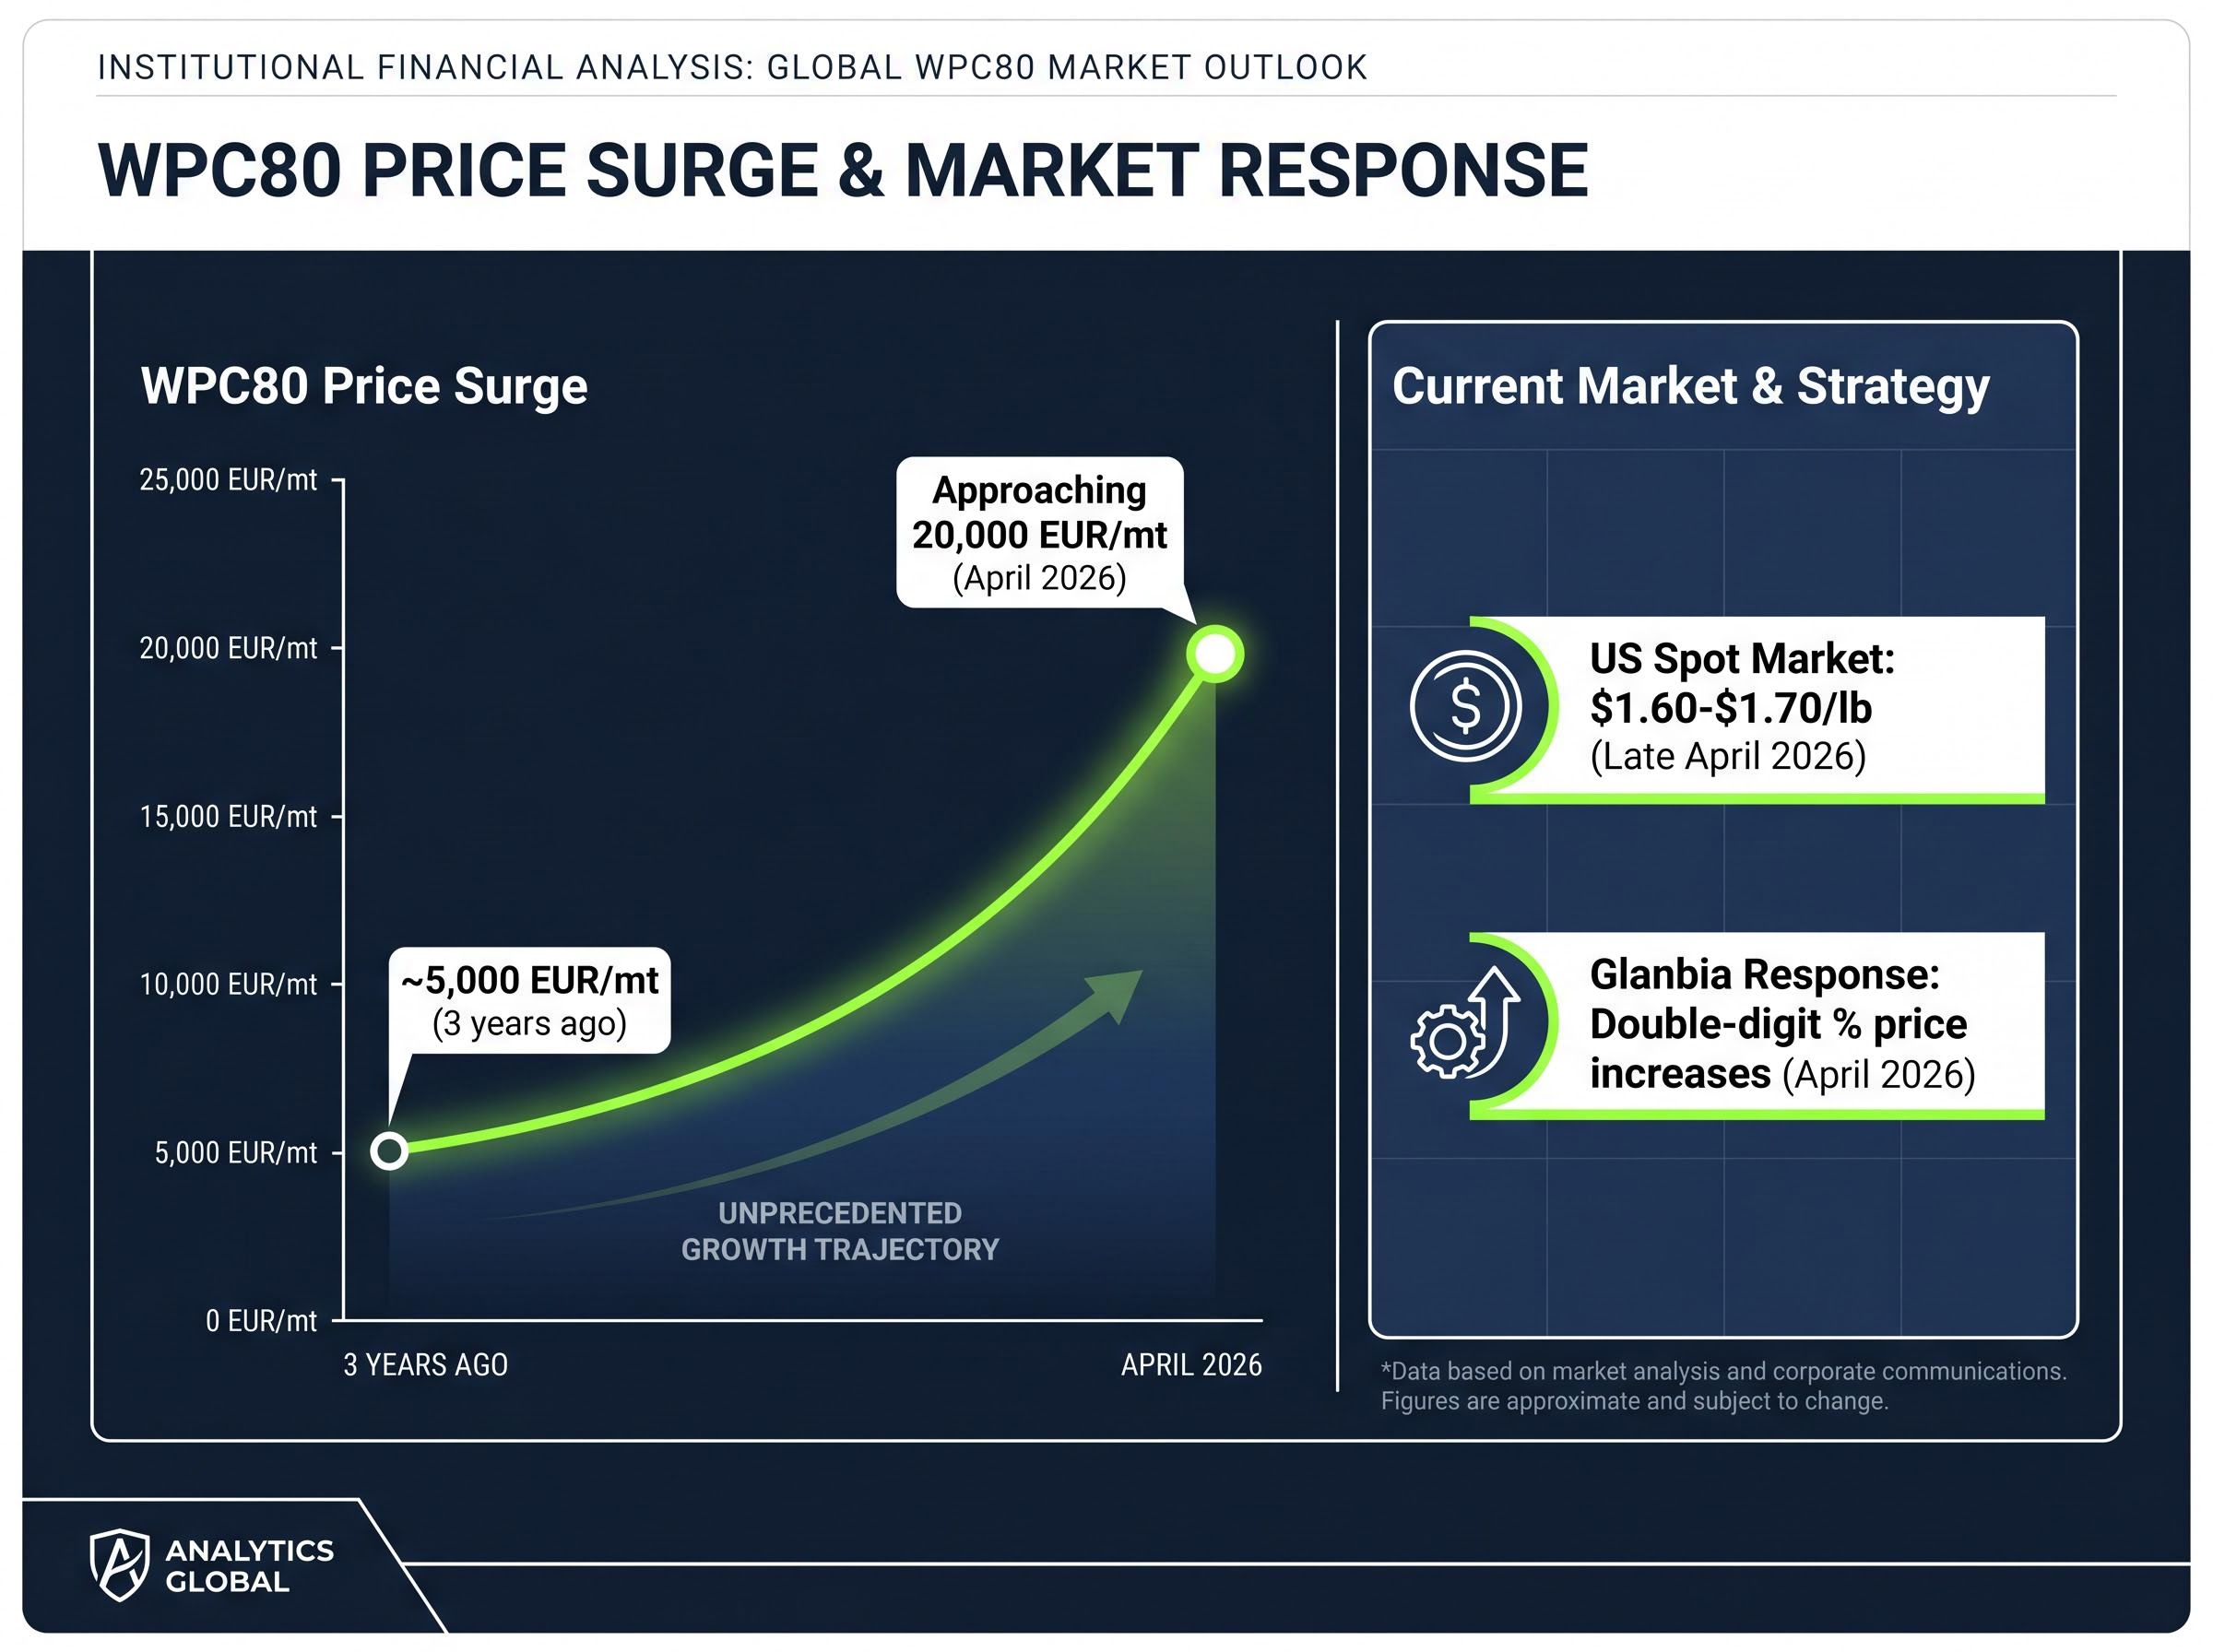
WPC80 prices have risen from approximately 5,000 EUR per metric ton three years ago to approaching 20,000 EUR per metric ton as of April 2026, a near four-fold increase driven by surging demand for high-protein products globally.
In the US spot market, WPC was trading at $1.60-$1.70 per pound as of late April 2026, up approximately 1.54% from the prior week. This is not a short-term spike; it is a structural repricing of a core commodity input.
The global whey protein market growth forecast projects expansion from approximately USD 9.7 billion in 2025 to USD 17.5 billion by 2033, a 7.5% compound annual rate driven by sustained demand for high-protein nutrition products, which helps explain why input prices are repricing structurally rather than cyclically.
Faced with that trajectory, nutrition manufacturers adopt an input cost pass-through strategy. The mechanics are straightforward:
Glanbia enacted double-digit percentage price increases in April 2026 as part of this strategy. The same whey price environment that necessitated those increases also inflated the value of whey-derived revenue streams in Dairy Nutrition, creating the paradox at the centre of the current investment case.
The Q1 2026 IMS beat was not marginal. Like-for-like revenue growth came in at 7.2% against analyst consensus of 4.6%, and the outperformance was volume-led rather than price-led: volume expanded 8.2% versus a consensus expectation of just 2.5%.
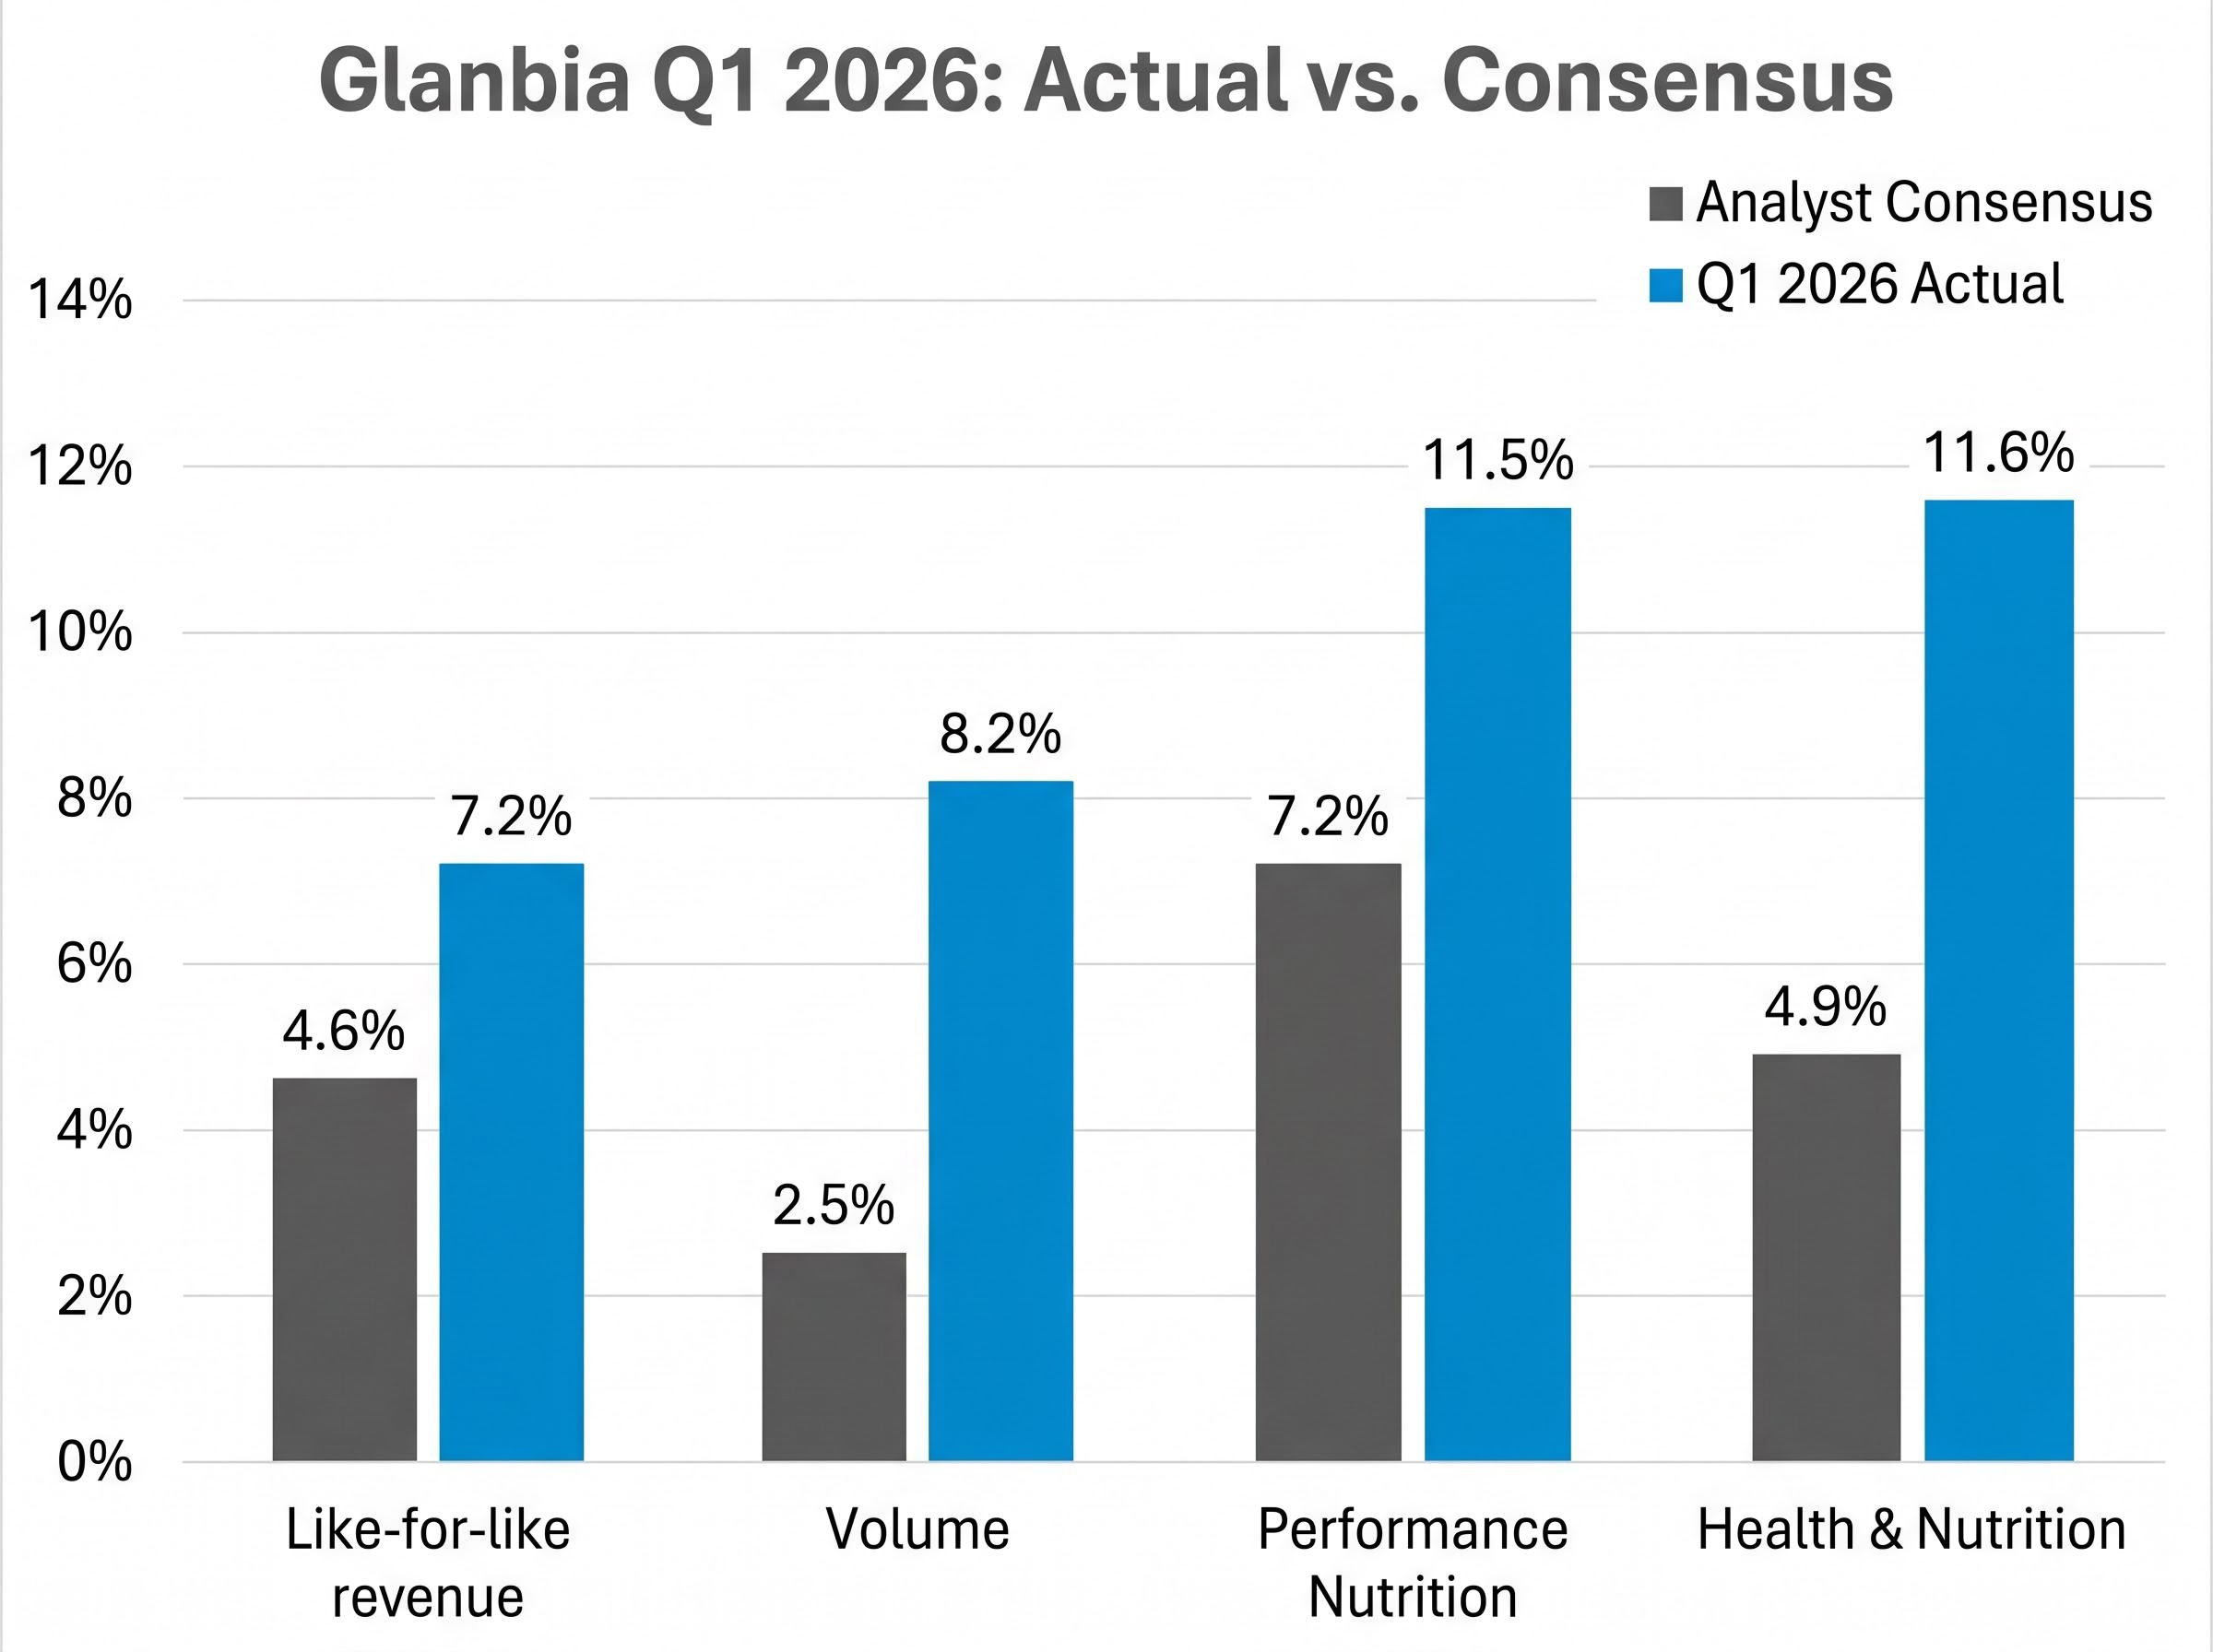
Both operating segments contributed. Performance Nutrition delivered like-for-like growth of 11.5% against consensus of 7.2%, while Health & Nutrition posted 11.6% growth versus consensus of 4.9%.
| Metric | Q1 2026 Actual | Analyst Consensus |
|---|---|---|
| Like-for-like revenue growth | 7.2% | 4.6% |
| Volume growth | 8.2% | 2.5% |
| Performance Nutrition growth | 11.5% | 7.2% |
| Health & Nutrition growth | 11.6% | 4.9% |
The scale of the beat across both segments raises a question the numbers alone cannot answer: how repeatable is this volume trajectory once the April price increases begin flowing through to consumers?
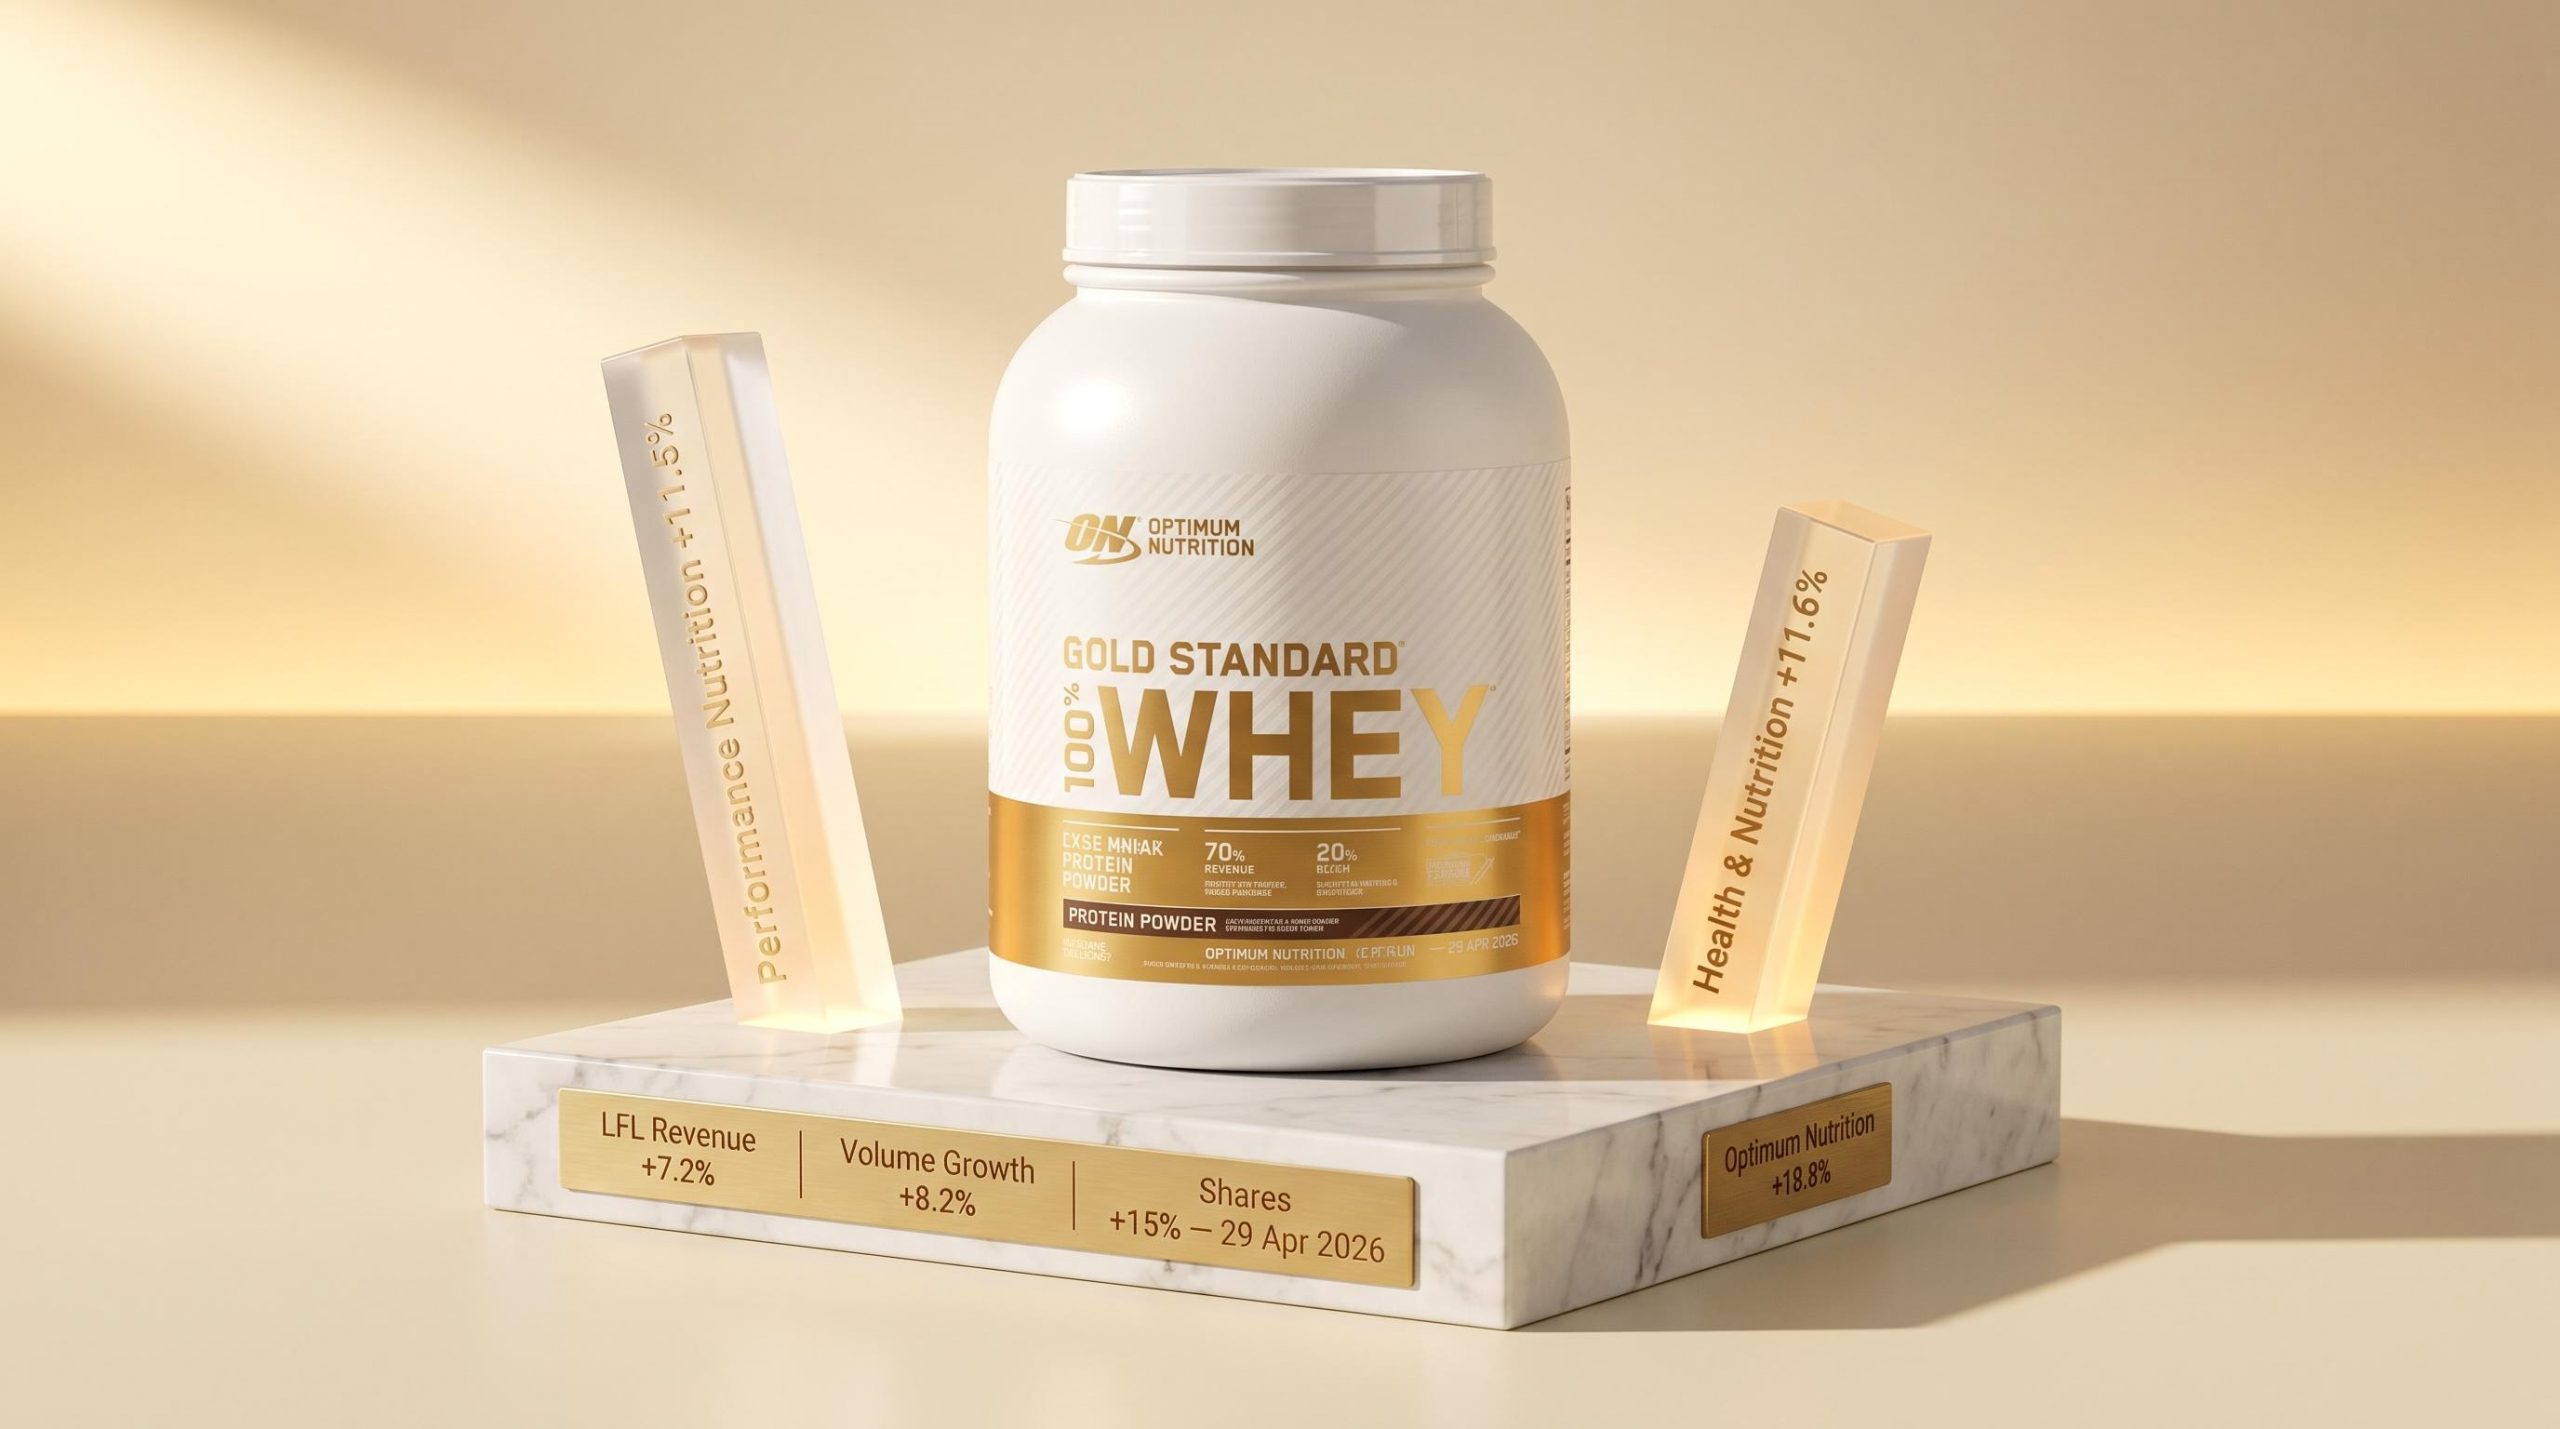
Within Performance Nutrition, Optimum Nutrition was the standout, delivering growth of 18.8% in Q1. Gold Standard Whey and Creatine were cited as the lead product contributors, suggesting the brand’s premium positioning is generating real demand pull rather than relying on promotional volume.
International Performance Nutrition expanded 23.4% in Q1, a figure that represents meaningful geographic diversification. If US or European consumers prove more price-sensitive to the April increases, international markets provide a partial buffer that could sustain the segment’s headline growth rate even if domestic volumes decelerate.
The Dairy Nutrition earnings before interest, tax, depreciation, and amortisation (EBITDA) guidance revision tells one story. Management lifted the range to $160-$170 million from the prior $150-$160 million, attributing the upgrade to a combination of higher whey pricing and solid volume performance. The same whey prices pressuring the cost line in Performance Nutrition are directly inflating the revenue and margin line in Dairy Nutrition.
| Guidance Metric | Previous | Revised (April 2026) |
|---|---|---|
| Dairy Nutrition EBITDA | $150-$160 million | $160-$170 million |
| Adjusted EPS growth | 7-11% (full range) | 7-11% (upper end) |
| Performance Nutrition organic sales | 5-7% (medium-term range) | 5-7% (upper end) |
The FY2026 adjusted EPS growth guidance was narrowed to the upper end of the 7-11% range, landing above Bloomberg consensus of approximately 8%. Performance Nutrition organic sales growth guidance was similarly moved to the upper end of its 5-7% medium-term target range.
Against this backdrop of upgrades, management explicitly acknowledged that volume softness is expected in H2 2026 as a direct consequence of the April price increases. This is the demand elasticity caveat that qualifies every positive headline from the IMS.
Proactively flagging the risk rather than embedding it silently in guidance signals a degree of management credibility. It also provides investors with a framework for interpretation: if H2 volume data arrives below consensus, the warning was already on the table. This is a standard posture when implementing price increases, guiding conservatively on volume while protecting the margin-side outlook.
Commodity cycle earnings pressure is a recurring theme across agri-linked food companies in 2026; GrainCorp’s decision to guide FY26 EBITDA materially below its prior-year result while maintaining cost discipline illustrates how operators with diversified segment exposure can communicate downside risk without abandoning the medium-term growth thesis.
As of early trading on 29 April 2026 (prior to the 8.6% single-day gain), Glanbia shares traded at 17.52 EUR, representing a market capitalisation of approximately 4.242 billion EUR. The consensus analyst price target stands at 22.18 EUR across 10 ratings with an Overweight consensus, implying roughly 27% upside from the pre-rally price.
An alternative consensus figure of 19.2 EUR suggests meaningful dispersion among analysts. That gap, from 19.2 EUR to 22.18 EUR, reflects differing assumptions about how much H2 execution risk to price in.
| Metric | Value |
|---|---|
| Current share price (pre-rally) | 17.52 EUR |
| Consensus price target | 22.18 EUR |
| Alternative consensus target | 19.2 EUR |
| FY2025 pre-exceptional EBITDA | $499.1 million |
| FY2025 adjusted EPS | 134.93 cents |
The 2026 recovery thesis does not start from a position of strength. FY2025 pre-exceptional EBITDA came in at $499.1 million, down 9.5% year-over-year, while adjusted EPS fell 3.6% to 134.93 cents. These results, released on 25 February 2026, form the base from which the 7-11% EPS growth guidance is calculated.
Management reaffirmed the 7-11% range in February before the Q1 IMS. The April narrowing to the upper end of that range represents a meaningful confidence signal, but it should be assessed against the context of a prior-year earnings decline rather than in isolation.
Demand elasticity in sports nutrition is not uniform across the consumer base. Price-sensitive consumers may trade down to private-label protein alternatives or reduce purchase frequency when retail prices rise by double-digit percentages. Brand-loyal consumers, particularly those purchasing premium products like Gold Standard Whey, tend to absorb price increases with less attrition.
The question is where the balance falls. Optimum Nutrition’s 18.8% Q1 growth suggests brand strength is generating genuine demand pull, but that growth was recorded before the April price increases took effect. The H2 2026 reporting checkpoint will be the first real test.
Does Optimum Nutrition’s brand premium carry enough consumer loyalty to sustain volume at materially higher price points, or will the double-digit increases trigger trade-down behaviour that compresses Performance Nutrition’s growth rate?
Three monitoring checkpoints for investors tracking this risk:
The geographic diversification buffer remains a mitigating factor. International Performance Nutrition’s 23.4% Q1 growth provides meaningful insulation if US or European demand softens in response to higher shelf prices. The FY2025 adjusted EPS of 134.93 cents serves as the base from which the 7-11% growth guidance would deliver approximately 144-150 cents at the upper end, a range that leaves limited room for volume disappointment.
The entire fiscal 2026 investment case reduces to a binary that will resolve itself in H2 data. Glanbia either sustains volume through its brand premium and international diversification, making this a quality growth story with re-rating potential, or it does not, making it a commodity margin recovery story with a more limited valuation ceiling.
The bull case rests on three conditions:
The risk case also has three identifiable triggers:
Investors wanting to understand how the dairy supply chain is responding to the same whey-pricing environment will find our detailed coverage of Synlait Milk’s dairy commodity recovery, which examines how the New Zealand processor achieved an 88% EBITDA improvement and balance sheet restructuring after a period of severe commodity-driven margin pressure.
The Q1 volume growth of 8.2% is the high-water mark. The EPS growth guidance upper-end midpoint of approximately 9% is now the consensus expectation embedded in the share price. Optimum Nutrition’s 18.8% growth anchors the bull case. All three figures will be tested when H2 data arrives.
Glanbia has demonstrated genuine volume momentum at a moment when the market expected far less. The Q1 beat was broad-based, product-led, and geographically diversified. It was also recorded entirely before the April price increases took effect, making it a lagging indicator of consumer behaviour rather than a leading one.
The current setup rewards a specific type of investor conviction. Those who believe brand equity in premium sports nutrition is durable enough to absorb double-digit price increases will find the valuation gap to the 22.18 EUR consensus target compelling at today’s price. Those who weight demand elasticity risk more heavily will wait for H2 data before adding exposure.
The H1 2026 results, expected later this year, will be the resolution point. Like-for-like volume growth in Performance Nutrition is the single metric that will confirm or refute whether the Q1 momentum can survive the cost pass-through cycle.
This article is for informational purposes only and should not be considered financial advice. Investors should conduct their own research and consult with financial professionals before making investment decisions. Past performance does not guarantee future results. Financial projections are subject to market conditions and various risk factors.
Glanbia shares jumped 8.6% on 29 April 2026 after the company reported Q1 2026 like-for-like revenue growth of 7.2% and volume growth of 8.2%, both significantly ahead of analyst consensus estimates of 4.6% and 2.5% respectively.
Rising whey prices create a dual effect for Glanbia: they increase input costs in the Performance Nutrition segment, forcing double-digit price increases to protect margins, while simultaneously boosting revenue and EBITDA in the Dairy Nutrition segment, which management used to upgrade its Dairy Nutrition EBITDA guidance to $160-$170 million.
Following the Q1 2026 outperformance, Glanbia narrowed its FY2026 adjusted EPS growth guidance to the upper end of its 7-11% range, above the Bloomberg consensus of approximately 8%, and moved Performance Nutrition organic sales growth guidance to the upper end of its 5-7% medium-term target range.
Management explicitly flagged that the double-digit price increases enacted in April 2026 to offset surging whey costs are expected to soften volumes in H2 2026, with additional risks including competitor pricing restraint from peers like Kerry Group and further whey cost escalation that could force a second round of price increases.
Investors should track three key data points: H2 like-for-like volume growth in Performance Nutrition relative to the Q1 baseline of 8.2%, management commentary at the H1 2026 results on whether guidance is maintained or revised, and competitor pricing actions from peers such as Kerry Group or private-label operators that could intensify trade-down pressure.