
Record Highs Are Not the Risk Most Investors Think They Are
5 hrs ago

Brent crude surged past $107 per barrel on 27 April 2026, hours after Iran’s latest diplomatic bid to reopen the Strait of Hormuz collapsed against Washington’s insistence on linking any deal to nuclear negotiations. Iran submitted a formal proposal through Pakistani intermediaries to end hostilities and restore shipping through the Strait, explicitly excluding its nuclear programme from the terms. President Trump dismissed it the same day, declaring the United States holds “all the cards.” The standoff sent crude oil prices sharply higher and added fresh pressure to a national average gasoline price already sitting at $3.89 per gallon. What follows is a breakdown of the proposal itself, the structural power of the Strait over global oil supply, the price action of the last 30 days, the supply-side factors compounding the crisis, and the two scenarios investors and consumers should now be tracking.
Iran’s proposal, delivered via Pakistani intermediaries on 27 April, offered three things: a reopening of the Strait of Hormuz, a ceasefire, and deferral of nuclear negotiations to a later diplomatic phase. The United States rejected it within hours.
The fault line is specific and structural. Iran wants to separate the Strait from the nuclear file. Washington refuses to discuss one without the other.
| Iran’s Proposal Terms | U.S. Stated Requirements |
|---|---|
| Nuclear talks deferred to a later phase | Any agreement must address Iran’s nuclear programme |
| Strait of Hormuz reopened immediately | Strait reopening conditional on broader deal |
| Ceasefire and end to hostilities | Ceasefire tied to comprehensive settlement |
Trump had already cancelled Islamabad peace talks on Saturday 26 April, stating Iran should contact him when ready. The same day the proposal was rejected, Iran’s Foreign Minister Abbas Araghchi was in Moscow meeting with President Vladimir Putin, signalling that Tehran is working multiple diplomatic tracks simultaneously.
According to Axios, citing one U.S. official and two additional sources, the proposal was treated as a non-starter. That incompatibility between Iran’s nuclear deferral and Washington’s nuclear precondition means no near-term resolution is on the table, and the supply risk premium embedded in crude prices has no catalyst to unwind.
The Strait of Hormuz is a narrow passage between Iran and Oman, roughly 33 kilometres wide at its narrowest shipping lane. Approximately 20% of all globally traded oil passes through it daily, along with roughly one-third of the world’s liquefied natural gas (LNG) shipments. Saudi Arabia, the UAE, Kuwait, and Iraq, four of the world’s largest oil exporters, depend on the Strait to move their crude to market.
No viable alternative pipeline network exists to reroute this volume at speed. When the Strait is threatened, the market does not wait for tankers to stop moving. It reprices immediately.
The EIA analysis of world oil transit chokepoints places Hormuz daily throughput at approximately 20.9 million barrels per day, making it the single largest volume concentration point in global seaborne energy trade and the primary reason a diplomatic failure in Washington registers immediately in crude futures.
On 27 March 2026, when Strait closure fears intensified during a military escalation, Brent crude surged to $114.81 per barrel, the highest level of the current crisis.
Oil futures markets operate on probability, not confirmation. Traders reprice contracts based on the likelihood of supply loss, which means a collapsed diplomatic meeting moves prices before a single barrel is physically disrupted. Speculative positioning amplifies these moves; when traders rush to buy contracts as a hedge against disruption, the intraday swings can be severe. This forward-pricing mechanism is why a Sunday rejection letter in Washington translates into a Monday morning price spike at petrol stations across the United States.
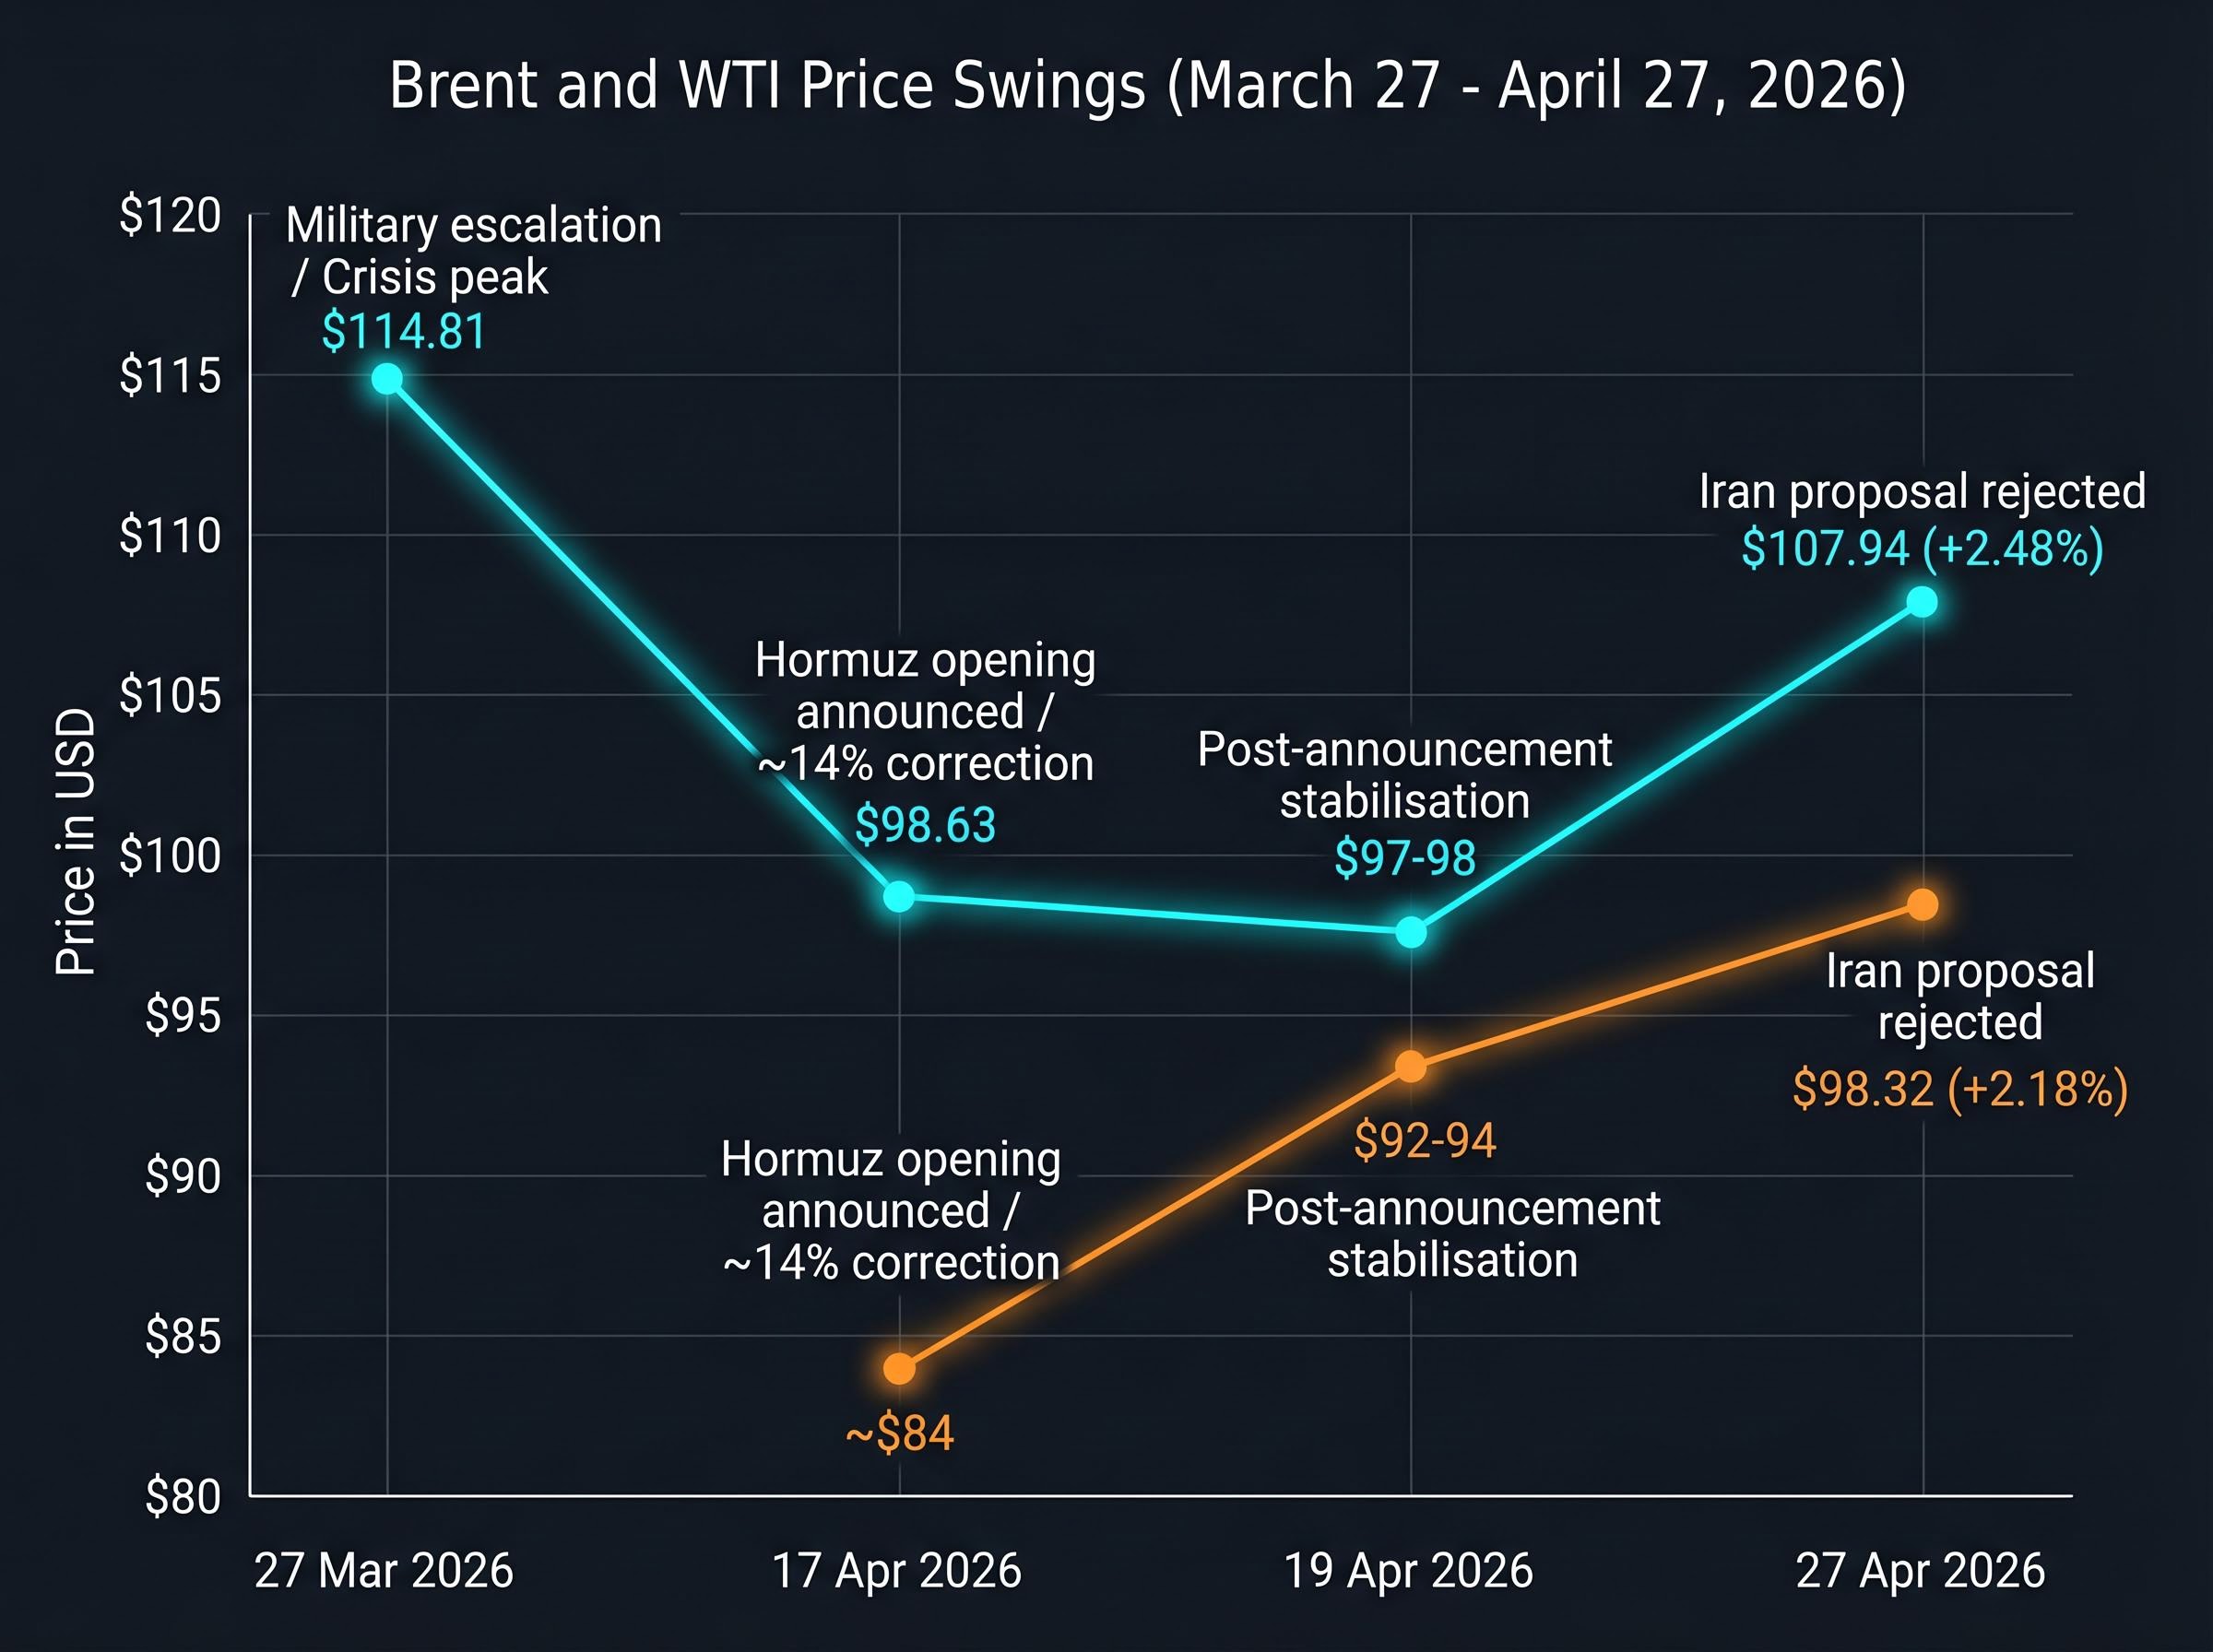
The price arc since late March tells a coherent story of a market caught between escalation and relief, unable to settle on either.
It started on 27 March, when the military escalation pushed Brent to $114.81. For three weeks, that was the ceiling, the market’s worst-case pricing signal. Then on 17 April, Iran announced a temporary Hormuz opening, and Brent dropped to $98.63, a fall of roughly 14% from peak. WTI fell to approximately $84. The correction was sharp and immediate, evidence that the market is as sensitive to diplomatic progress as it is to diplomatic failure.
By 19 April, prices had stabilised: Brent at $97-98, WTI at $92-94. The initial relief trade had faded, replaced by cautious positioning.
Then came today. The rejection of Iran’s proposal on 27 April pushed Brent to $107.94 (up 2.48%) and WTI to $98.32 (up 2.18%), erasing most of the April relief in a single session.
| Date | Event | Brent Price | WTI Price | Move |
|---|---|---|---|---|
| 27 March | Military escalation | $114.81 | N/A | Crisis peak |
| 17 April | Hormuz opening announced | $98.63 | ~$84 | ~14% correction |
| 19 April | Post-announcement stabilisation | $97-98 | $92-94 | Flat |
| 27 April | Iran proposal rejected | $107.94 | $98.32 | +2.48% / +2.18% |
The 14% single-event correction on 17 April is the clearest evidence of how rapidly prices could fall if a genuine resolution materialises.
The national average gasoline price sits at $3.89 per gallon, down 6 cents from the prior week. That modest relief at the pump, however, may prove short-lived if crude continues to climb from here.
The gasoline price transmission into U.S. inflation is more direct than the headline number suggests: a 37% gasoline price surge over seven weeks pushed CPI up 90 basis points in a single month, and the Cleveland Fed nowcast reached 3.58%, complicating the Federal Reserve’s rate path in ways that go beyond the standard energy price pass-through models.
The Iran standoff is not operating in a supply vacuum. Two other forces are shaping the barrel count, and they push in opposite directions.
The IEA Oil Market Report for April 2026 projects the 80,000 bpd demand contraction, attributing it to the economic drag generated by the Iran conflict, a forecast that frames the supply-side arithmetic as particularly unfavourable given that Russian output losses are occurring against a backdrop of weakening consumption, not growth.
The net effect: supply remains tight even before Hormuz risk is factored in.
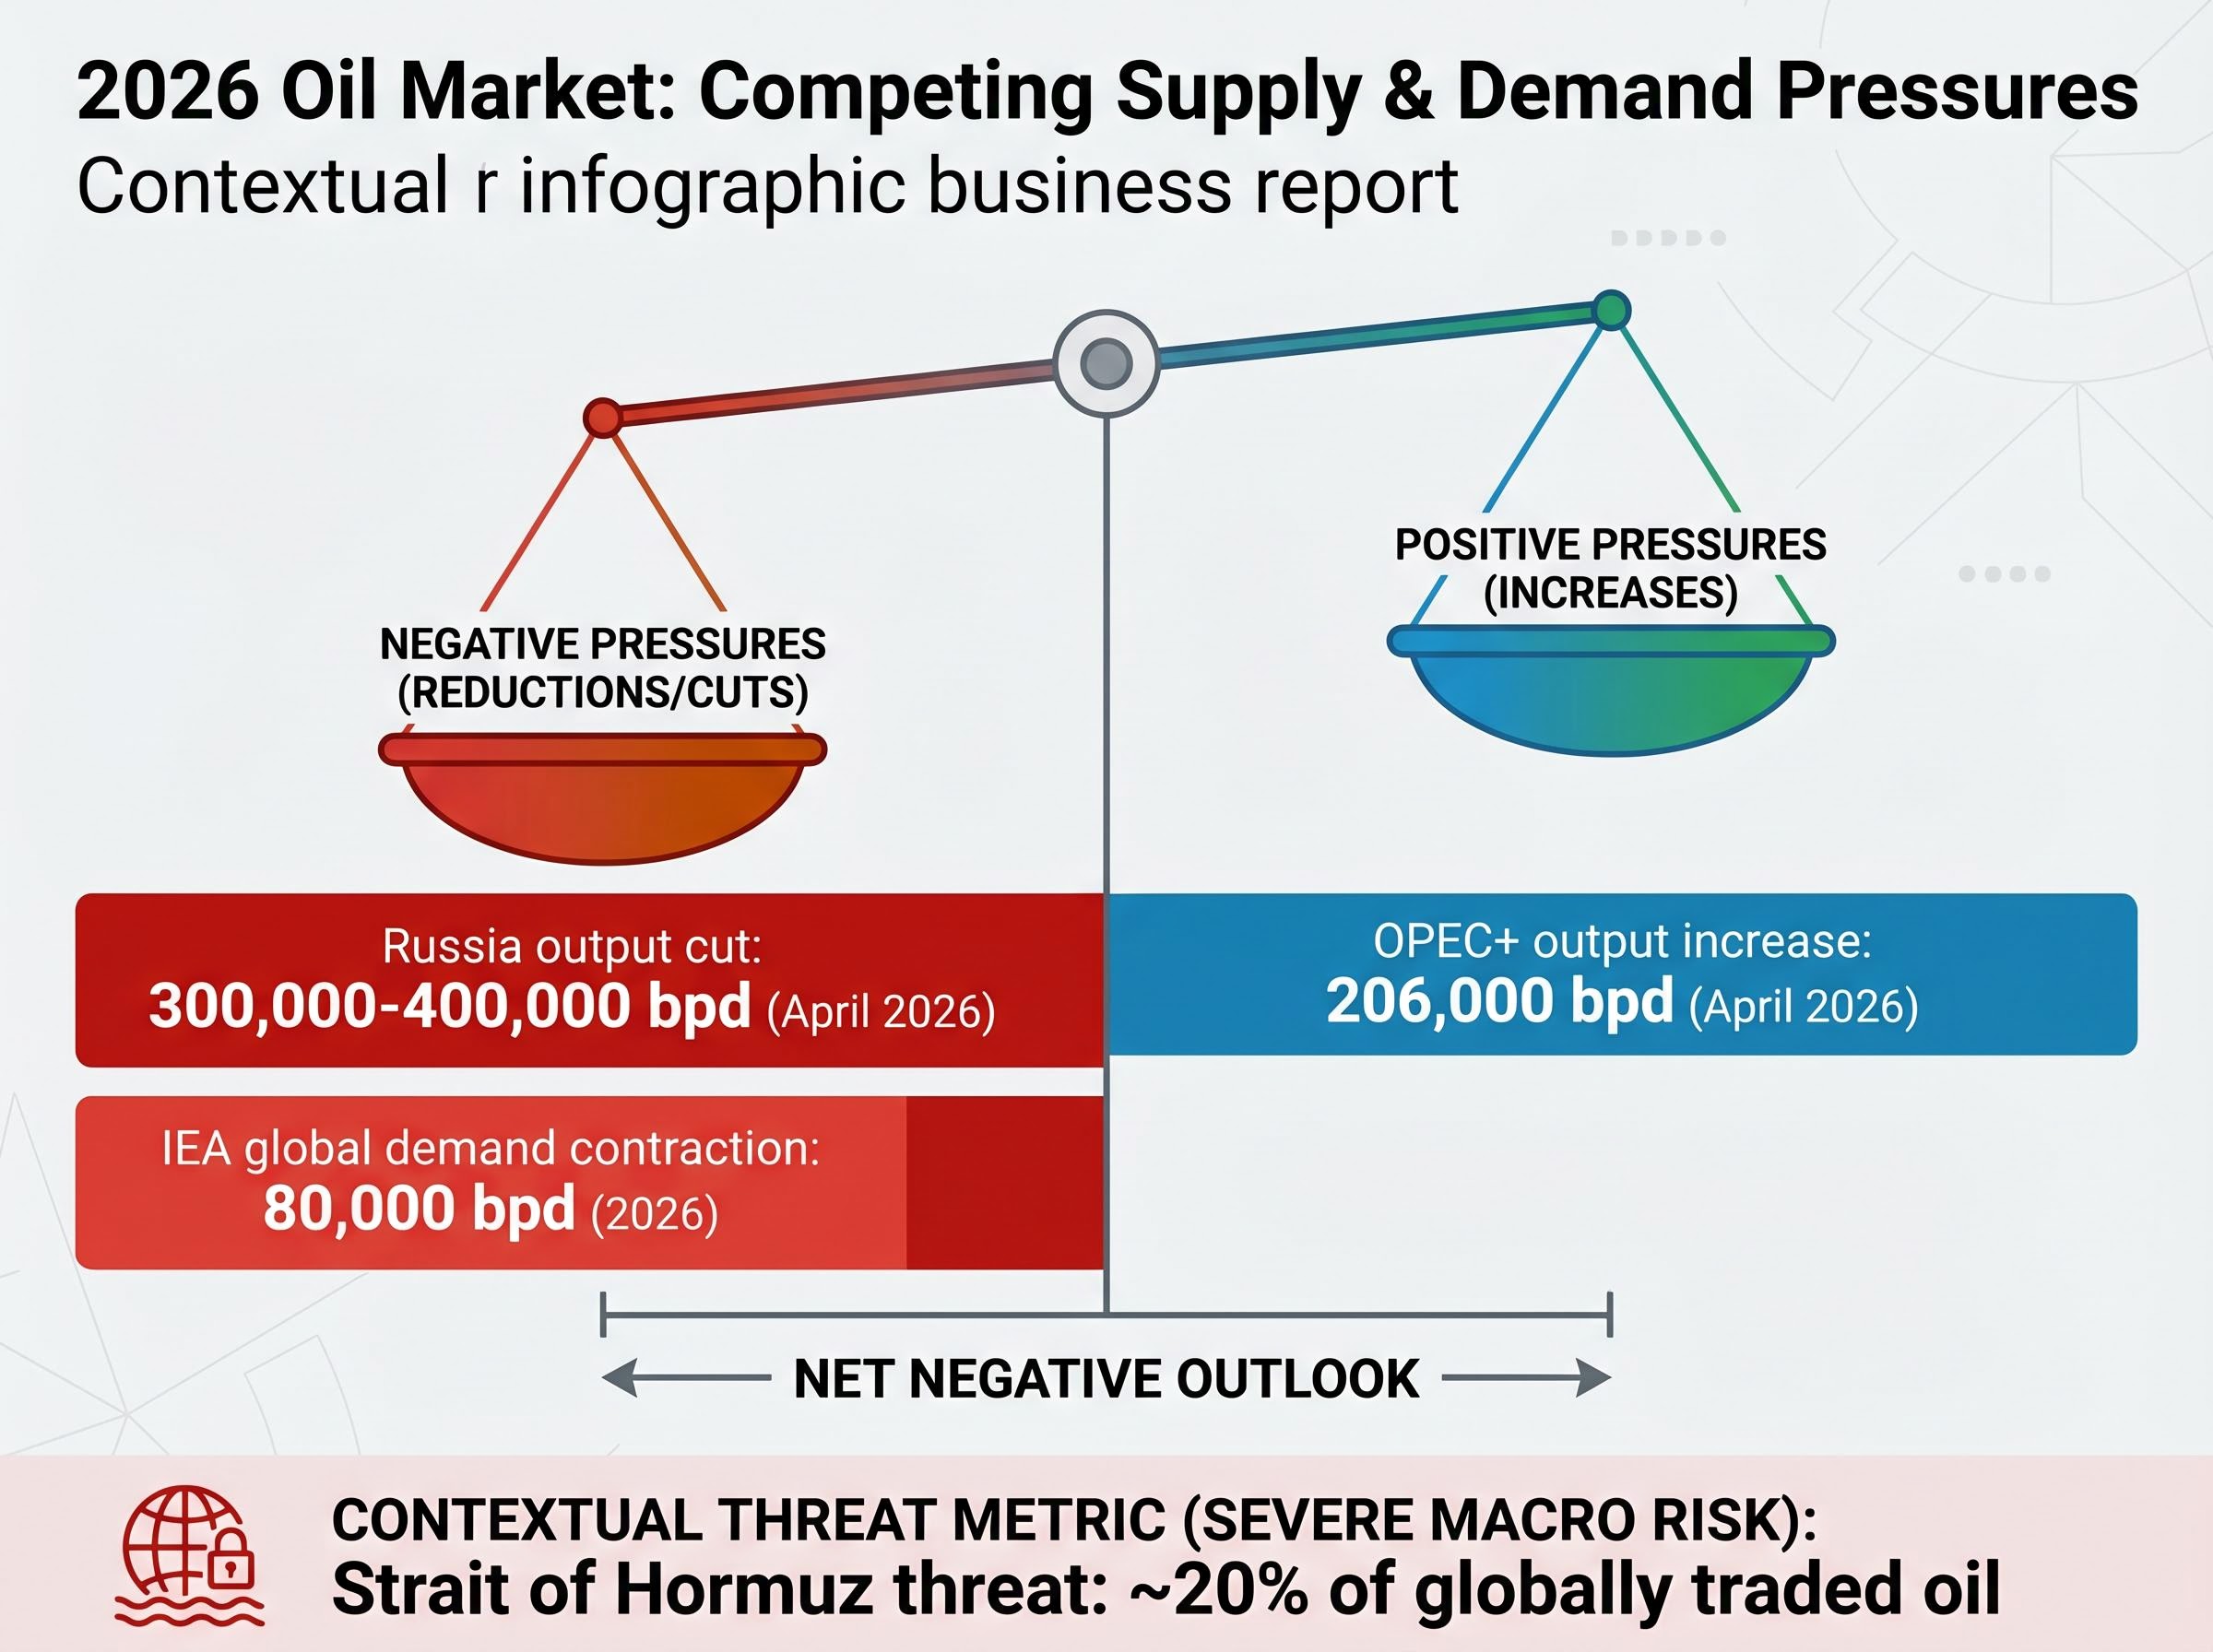
The arithmetic exposes the gap. OPEC+ is adding 206,000 bpd to global supply. Russia is simultaneously removing 300,000-400,000 bpd. The Strait of Hormuz, if disrupted, could restrict roughly 20% of global oil trade. Against that scale, the OPEC+ increase is a rounding error. It has not been sufficient to suppress prices during the standoff, and it would not stabilise markets in an escalation scenario.
With no near-term resolution visible, the market is effectively trading between two bookends. Both have recent precedent.
| Scenario | Trigger | Brent Price Range | WTI Implication | Consumer Impact |
|---|---|---|---|---|
| Deal / Resolution | Hormuz reopened, ceasefire holds | $70-82 | Proportional decline toward $60-75 | Gasoline falls toward $3.00-3.40 range |
| Escalation / Collapse | Talks fail, physical Strait closure | $114+ | WTI risks exceeding $100+ | Gasoline rises sharply; California could exceed $6.50 |
The deal scenario draws from the 17 April correction as the closest comparable event: when the market briefly believed the Strait would reopen, Brent fell 14% in a single session. Scenario-based quarterly forecasts place the resolution range at $70-91 per barrel, depending on the speed and scope of any agreement.
J.P. Morgan’s full-year 2026 Brent average forecast of $60 per barrel reflects a base case that includes eventual resolution, suggesting that institutional positioning is not pricing in permanent crisis.
The escalation scenario calibrates against the 27 March high of $114.81. A physical closure of the Strait, or a breakdown in all intermediary channels, could push prices to or beyond that level, with duration determining the ceiling.
These statements are speculative and subject to change based on market developments and diplomatic outcomes. Past price movements do not guarantee future results.
The gap between $60 and $114 is not uncertainty for its own sake. It reflects a market that knows precisely what each outcome would mean and is waiting for a signal that has not yet arrived.
For investors wanting to move from scenario ranges to specific equity decisions, our comprehensive walkthrough of energy stock positioning across the Iran conflict scenarios covers ExxonMobil and Chevron free cash flow yields, the gap between ETF performance and crude price gains, and why clean energy stocks suffered collateral damage from inflation-driven rate cut repricing.
Iran’s 27 April proposal represents a real diplomatic opening, but its structural incompatibility with Washington’s nuclear precondition means the supply risk premium in crude prices has no catalyst to unwind in the near term. If resolution comes, the 17 April correction suggests the price relief could be rapid and significant. If talks collapse further, the 27 March peak marks the floor of the upside risk, not the ceiling.
Investors and consumers should monitor the next round of Iran-U.S. communication through intermediary channels (Pakistan, Oman), any shift in Trump’s stated negotiating position, and the EIA weekly petroleum status report due 30 April for updated U.S. inventory context.
This article is for informational purposes only and should not be considered financial advice. Investors should conduct their own research and consult with financial professionals before making investment decisions.
The Strait of Hormuz is a narrow shipping passage between Iran and Oman through which approximately 20% of all globally traded oil passes daily, making any threat to its operation an immediate catalyst for crude oil price spikes worldwide.
Brent crude surged to $107.94 per barrel after the United States rejected Iran's diplomatic proposal to reopen the Strait of Hormuz, because Iran's offer explicitly excluded its nuclear programme from negotiations while Washington insists any deal must address the nuclear file.
A diplomatic resolution could pull Brent crude down to the $70-82 range and lower gasoline prices toward $3.00-3.40, while a full escalation or physical Strait closure could push Brent back above $114 and send California gasoline prices past $6.50.
Russia cut production by 300,000-400,000 barrels per day in April 2026 due to Ukrainian strikes on port and refinery infrastructure, more than offsetting OPEC+'s 206,000 barrel per day output increase and keeping the market structurally tight even before Hormuz disruption risk is factored in.
Investors should track the next round of Iran-U.S. communications through Pakistani and Omani intermediaries, any shift in the Trump administration's stated negotiating position on nuclear preconditions, and the EIA weekly petroleum status report due 30 April 2026 for updated U.S. inventory data.


