
Wells Fargo beat Wall Street on profit in its Q3 2026 earnings, posting diluted earnings per share of $1.87 against a $1.85 consensus. Its shares still fell roughly 2% to 2.8% after the 13 October release, because revenue of $21.87 billion missed the $22.31 billion forecast and net interest income came in short as well.
The gap is hard to ignore. Average loans and deposits each grew 11%, yet revenue rose only 2%.
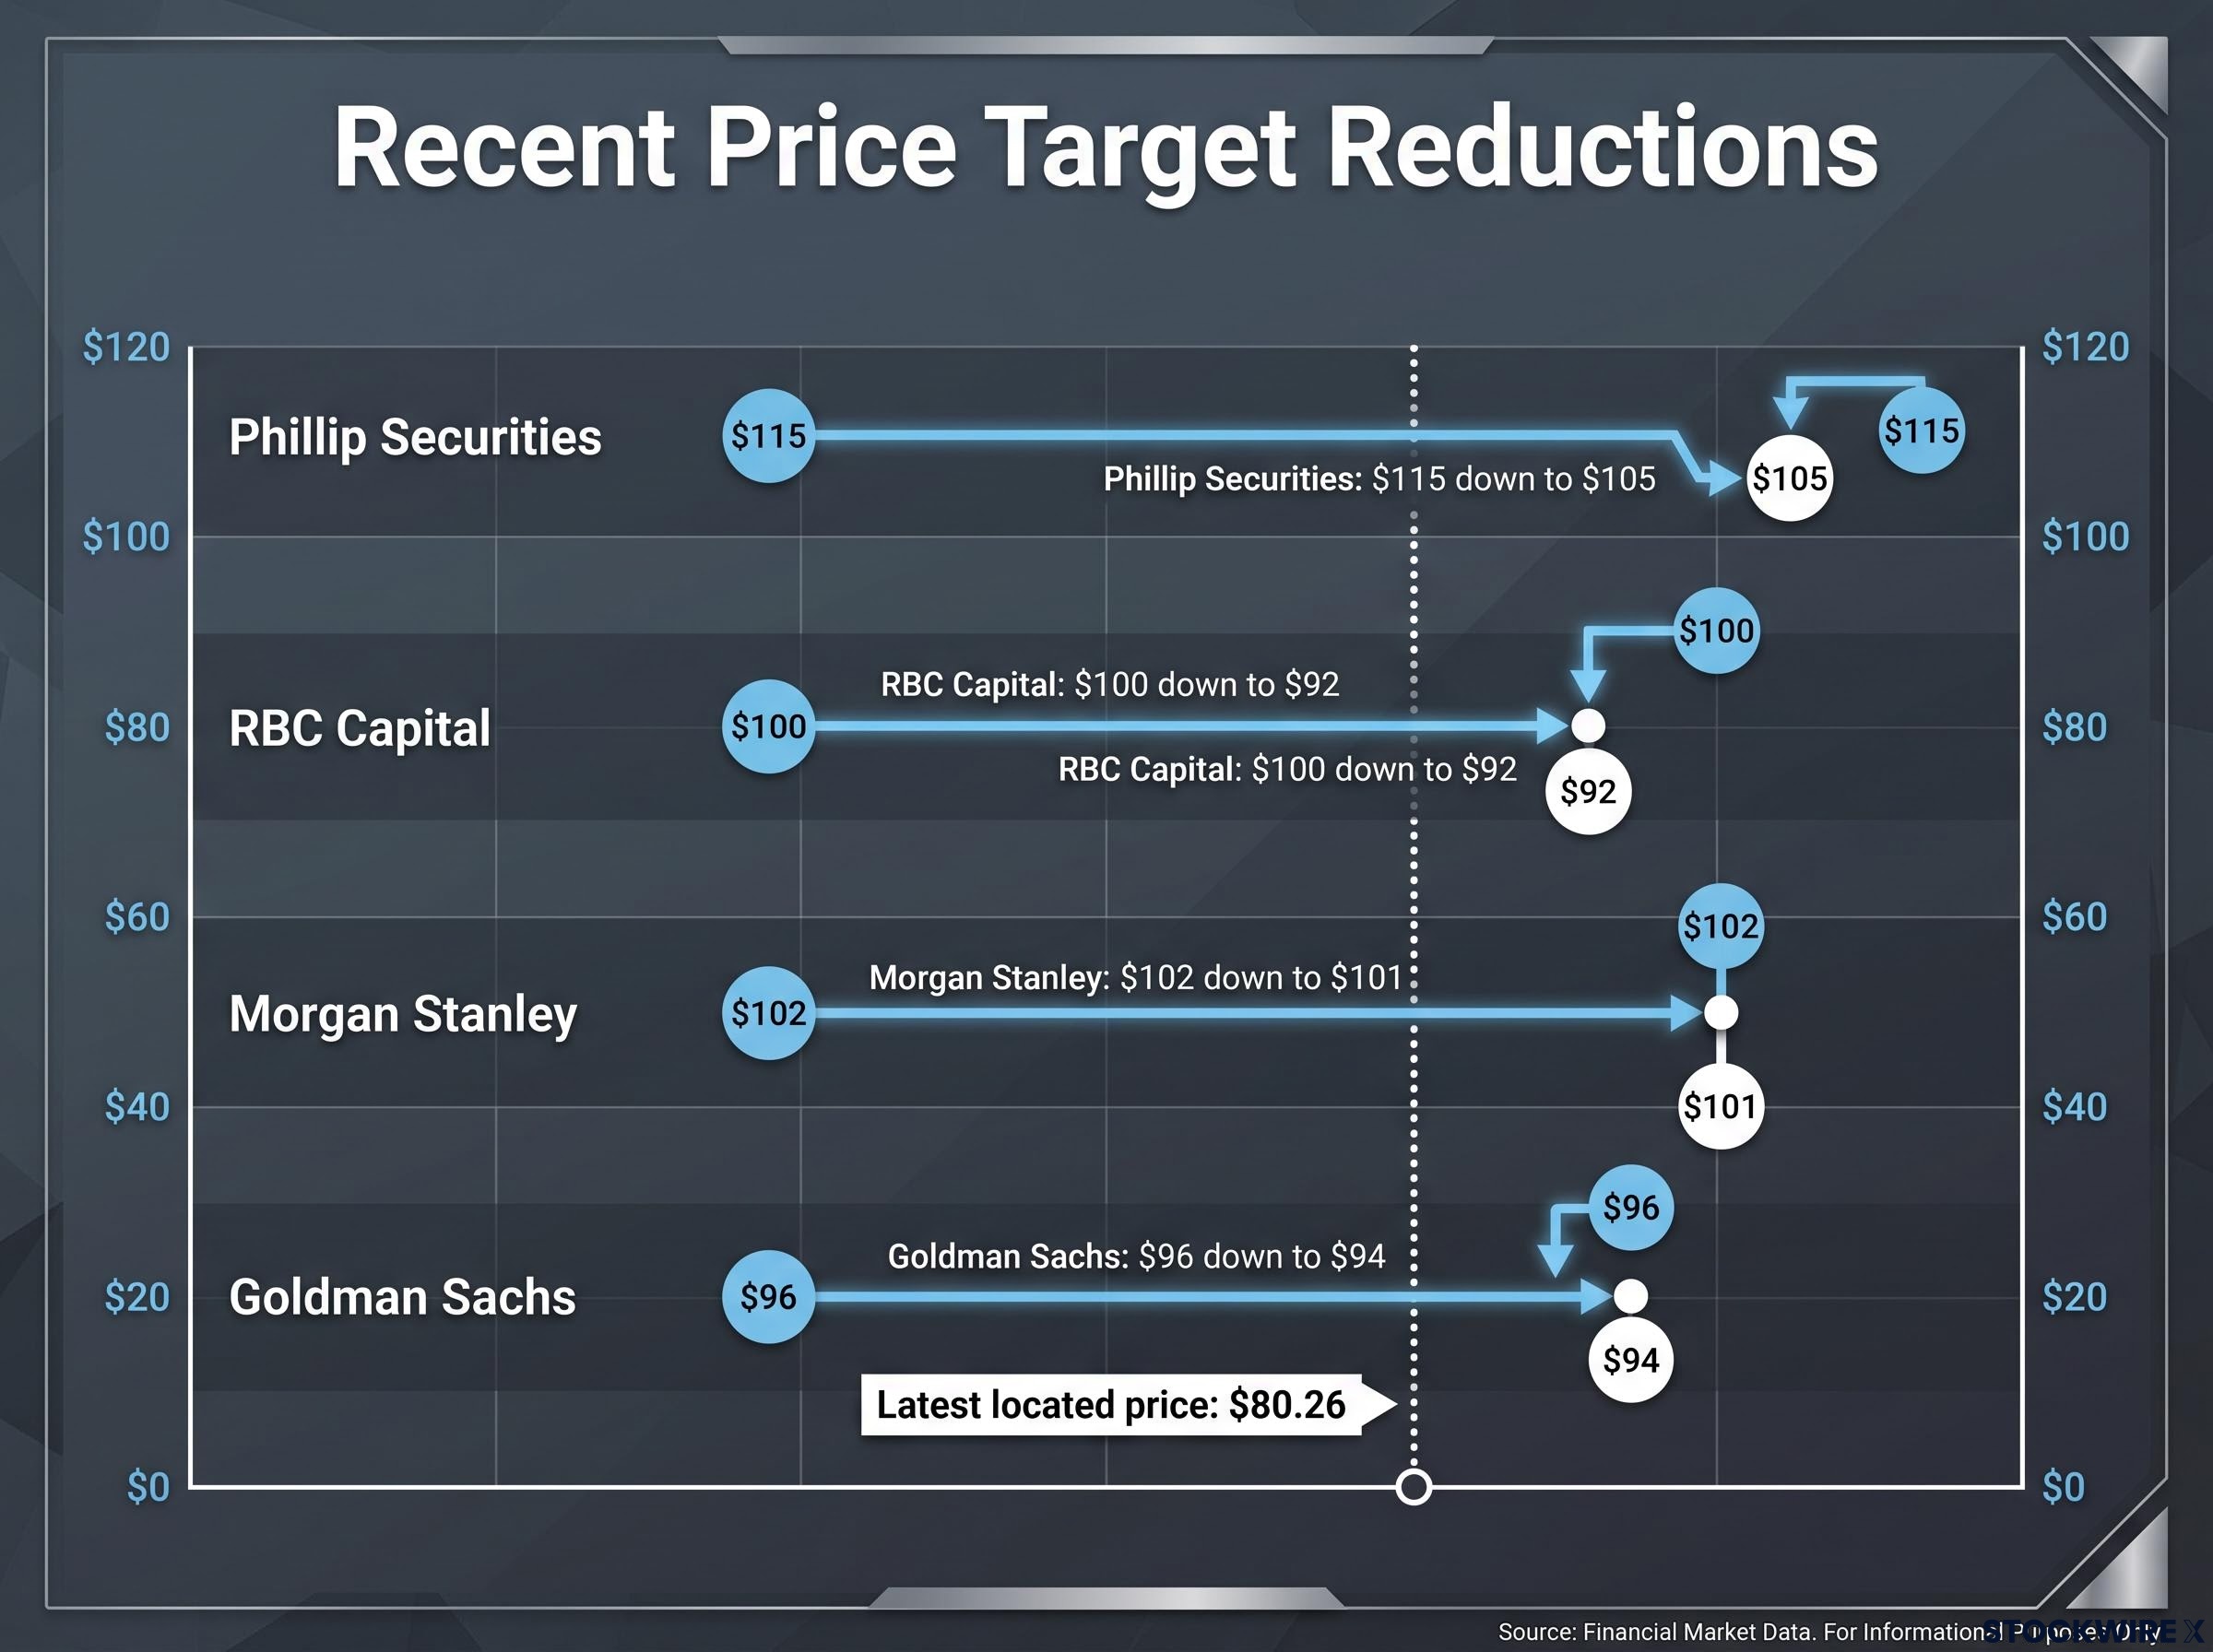
Phillip Securities responded on 21 October by keeping its BUY rating but cutting its target to US$105 from US$115. That leaves the open question: is this a cyclical wobble, or a structural squeeze on margins?
Here is where the quarter fell short, what the lower target implies, and which numbers decide whether the stock’s premium valuation holds.
Why did a profit beat still read as a miss?
On the surface, the quarter looked fine. Net income rose 6% to $5.951 billion, and EPS cleared expectations. Net interest income (NII), the gap between what the bank earns on loans and pays on deposits, is where it unravelled.
| Measure | Reported | Consensus | Result |
|---|---|---|---|
| Net income | $5.951B | n/a | Up 6% from $5.589B |
| Diluted EPS | $1.87 | $1.85 | Beat |
| Revenue | $21.870B | $22.31B | Miss |
| NII | $12.517B | $12.63B (Reuters) / $12.66B (CNBC) | Miss |
The real issue is conversion. Balances grew 11% but revenue grew 2%, which tells you the bank is currently paying more to grow than the headline profit suggests. That is what the market priced.
Cyclical drags
The shortfall assembled from several sources, ranked by impact:
- Deposit costs: pricier commercial deposits and fewer non-interest-bearing deposits offset loan growth.
- Trading: Markets revenue fell 1% year on year and 17% sequentially. Fixed income, currencies and commodities (FICC) dropped 18% on the quarter; equities rose 21% on the year but fell 14% sequentially.
- Late-September rate volatility: a sharp move slowed client activity in FICC.
- Other fees: non-interest income slipped 1% on lost rail-car lease income, weaker venture-capital gains and lower mortgage fees.
Investment advisory fees (+15%), investment banking fees (+6%) and M&A revenue (+30%) cushioned the blow.
The structural question
Trading weakness can fade. Deposit pricing may not. Since the Federal Reserve lifted its asset cap in 2025 and terminated the remaining 2018 order on 5 March 2026, Wells Fargo has grown freely, but funding that growth costs more. Morgan Stanley’s pre-results view that margin pressure was easing proved premature.
Rising deposit mobility, driven by money market funds and stablecoins, helps explain why banks must pay more to retain funding, and it is the force behind the pricier deposits that weighed on net interest income.
What do costs, credit and guidance say about the quality of the quarter?
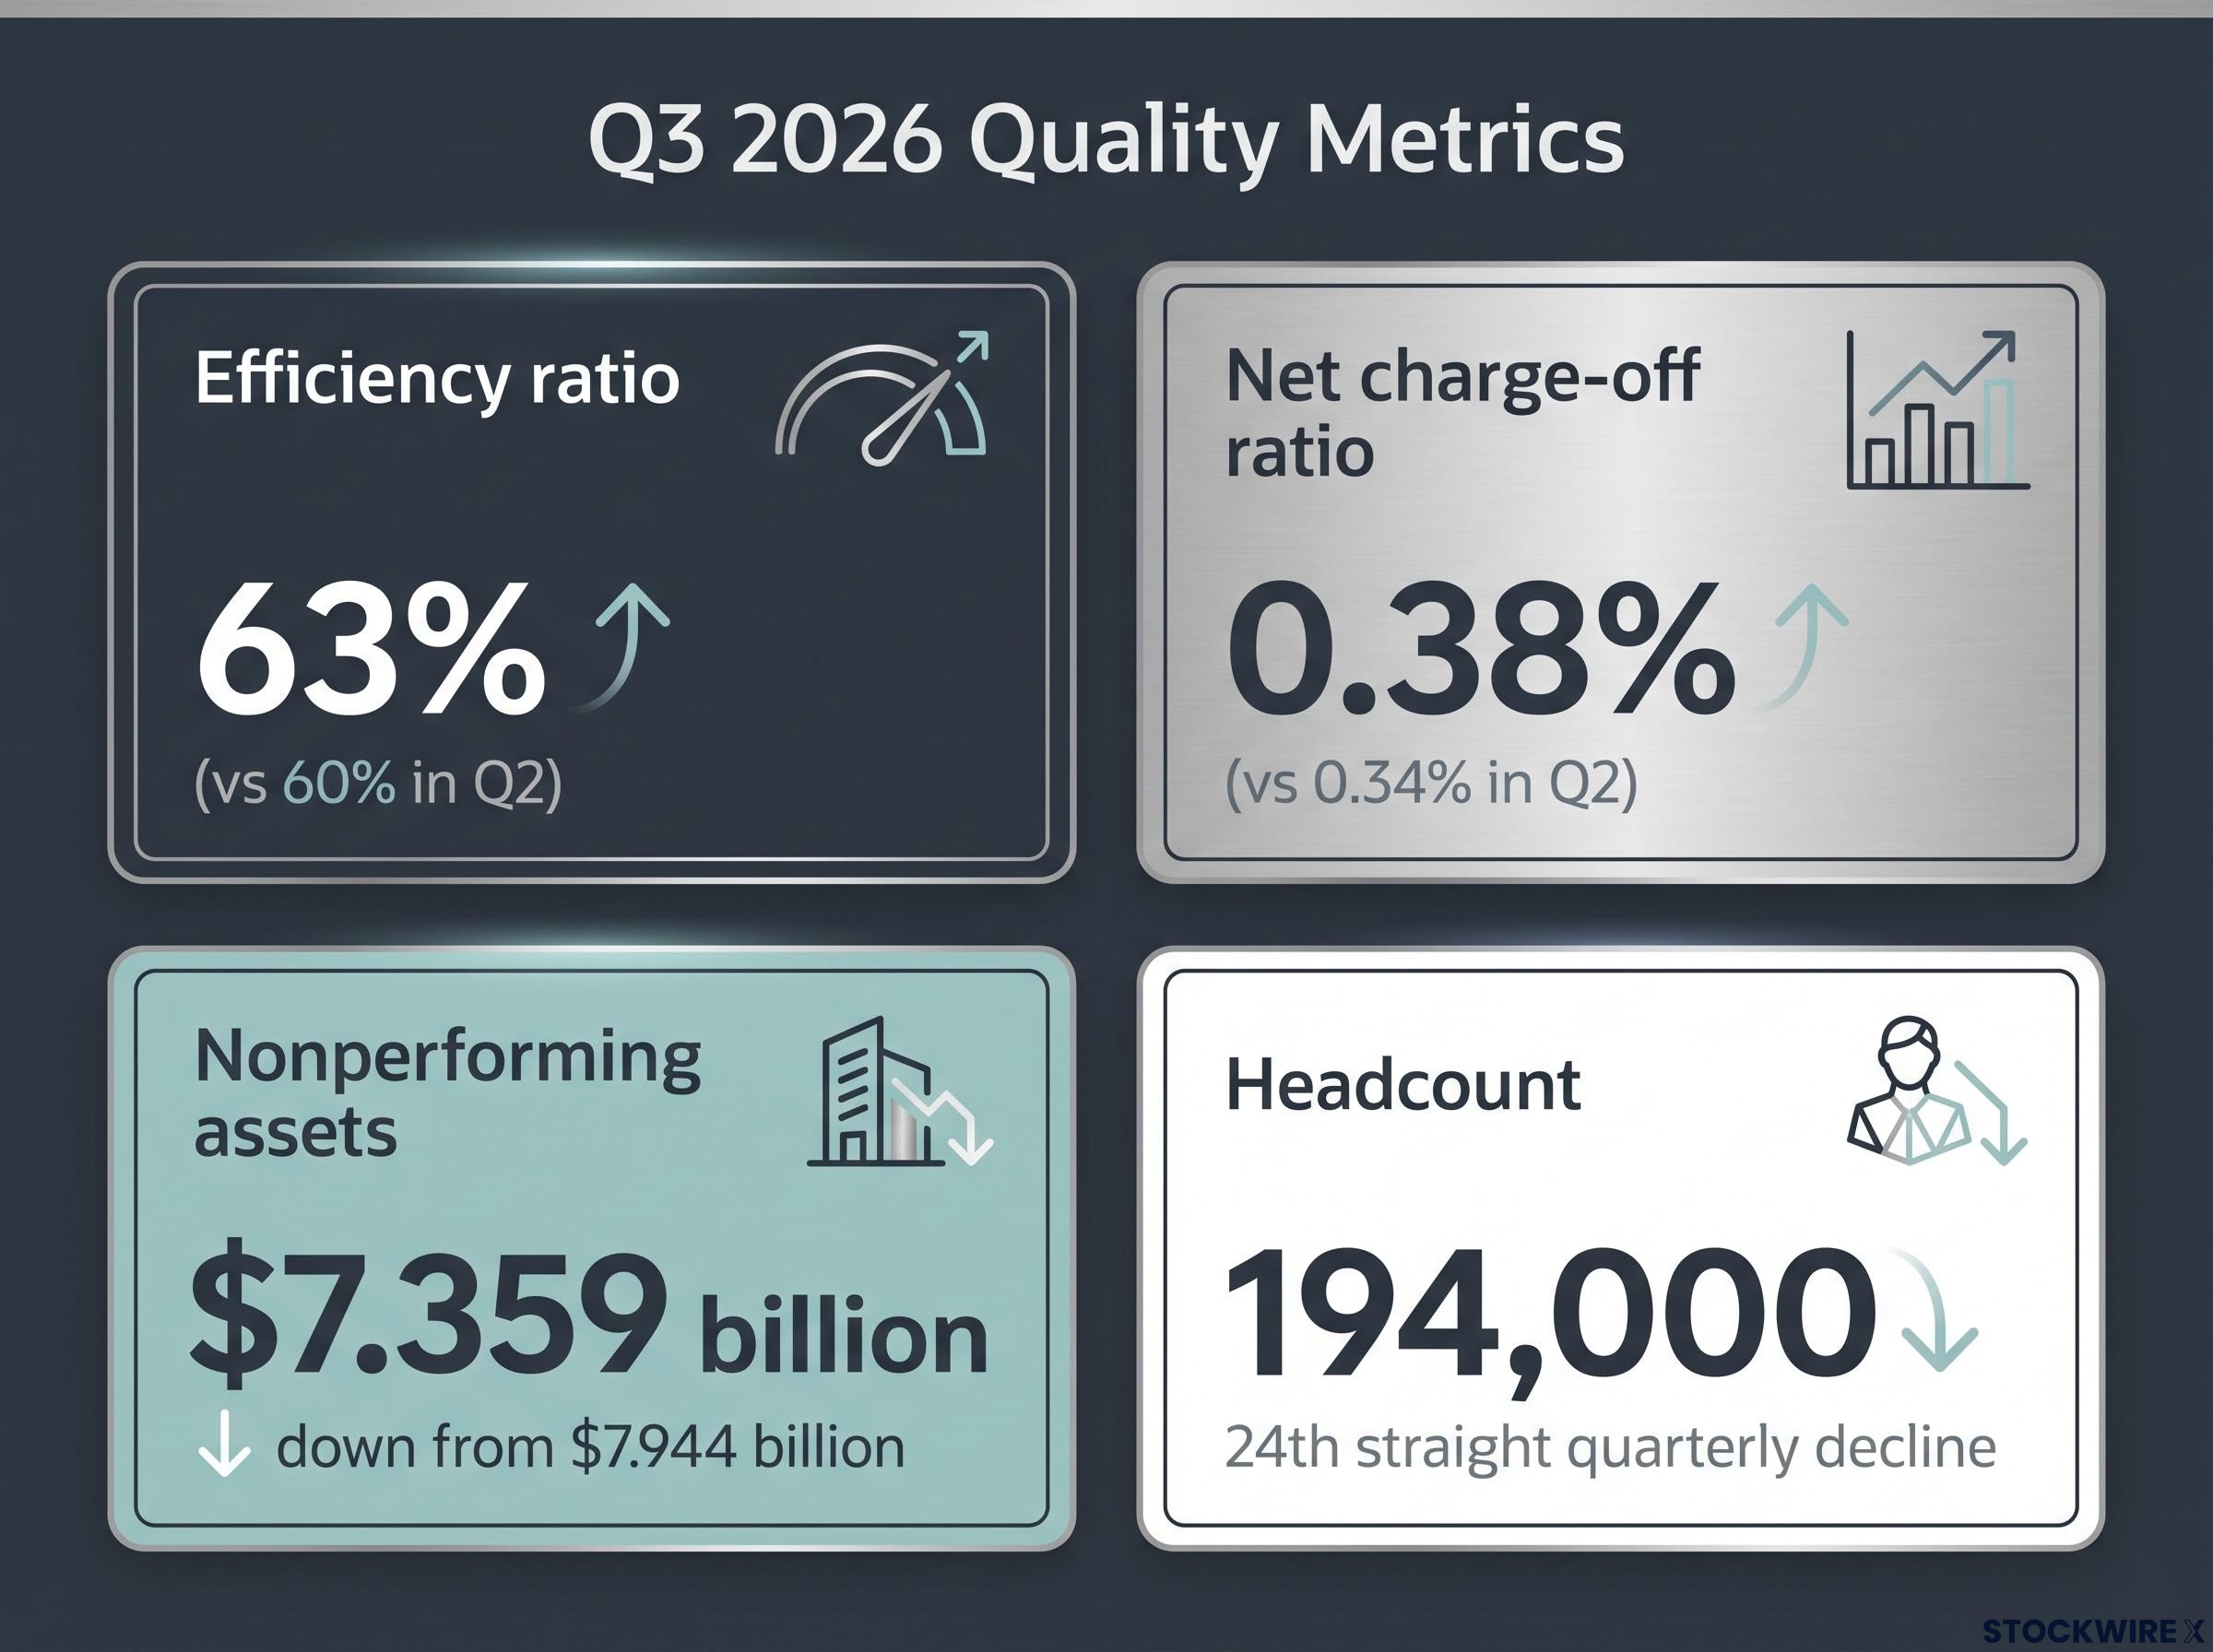
The rest of the report steadied the picture. Expenses fell 1%, and headcount dropped to 194,000, the 24th straight quarterly decline.
Costs and credit
- Efficiency ratio (costs as a share of revenue; lower is better): 63%, versus 60% in Q2 and 65% a year earlier
- Net charge-off ratio: 0.38%, versus 0.34% in Q2 and 0.40% a year earlier; net charge-offs $983 million
- Provision: $1.029 billion
- Nonperforming assets: $7.359 billion (0.70% of loans), down from $7.944 billion
- Consumer charge-offs: 0.70%; commercial charge-offs rose
Management also plans to absorb about $400 million of higher revenue-related costs within unchanged expense guidance. Loan growth came from Corporate and Investment Banking (+19%), securities-based lending (+16%) and auto (+31%), with 660,000+ new card accounts whose benefits land mainly in 2027-2028.
Peers JPMorgan, Bank of America and Citigroup also reported, with Citigroup’s net income up 40%. Credit is not what is hurting this stock, so you should read the risk as earnings power and rate sensitivity rather than loan losses.
Peers reported alongside Wells Fargo, and big bank earnings across the sector have leaned on capital markets and loan volumes, which makes funding costs the differentiator when trading cools.
Guidance and rate sensitivity
Full-year NII guidance holds at about $50 billion, with Q4 near $13 billion. Markets NII was trimmed to about $1.8 billion from $2 billion.
Return gap Return on tangible common equity (ROTCE), profit relative to shareholders’ tangible capital, was 16.3%, against management’s 17%-18% target.
The banking book benefits from higher rates while the Markets business suffers from them, so rate moves cut both ways.
What does Phillip Securities’ BUY with a lower target signal for investors?
Reading the Phillip call
Phillip cut its FY2026 earnings estimates by 8% on lower NII, advisory fee and other income forecasts. It values the stock at 1.85x FY2026 price-to-book (share price relative to net assets per share), assuming a 16.7% return on equity (ROE).
| Firm | New target | Previous | Rating |
|---|---|---|---|
| Phillip Securities | $105 | $115 | BUY |
| UBS | $102 | n/a | Buy |
| Morgan Stanley | $101 | $102 | Overweight |
| Goldman Sachs | $94 | $96 | n/a |
| RBC Capital | $92 | $100 | Outperform |
| JPMorgan | $91.50 | n/a | Neutral |
Against the latest located price of $80.26, Phillip’s target implies roughly 31% upside. A cut target with a retained BUY tells you the analyst still likes the franchise but will pay less for the earnings.
Bull case, bear case
Bulls point to 16.3% ROTCE, double-digit balance growth and freedom from the cap. Bears argue the stock is priced as a sustainably high-return bank before the revenue model is proven; returns slipping toward the low teens would leave 1.85x exposed. Key risks:
- Further rate cuts squeezing floating-rate yields
- Deposit repricing
- Rising commercial charge-offs
- Execution on card vintages arriving in 2027-2028
Your decision hinges on whether returns stay in the mid-to-high teens.
What the target cuts change, and what they leave intact
The franchise story survives: tight costs, no asset cap, 11% balance growth and a card book still maturing. What changed is the near-term revenue path, which now looks less generous than analysts had assumed.
Four numbers will settle the debate. Watch Q4 NII against the $13 billion guide, deposit cost trends, Markets NII versus the lowered $1.8 billion, and ROTCE progress toward 17%-18%.
If those land, the premium multiple has support. If they slip, the target cuts may not be finished.
Past performance does not guarantee future results. Financial projections are subject to market conditions and various risk factors. This article is for informational purposes only and should not be considered financial advice. Investors should conduct their own research and consult with financial professionals before making investment decisions.