Stock Market Rally Defies Sentiment: What the Data Shows

Key Takeaways
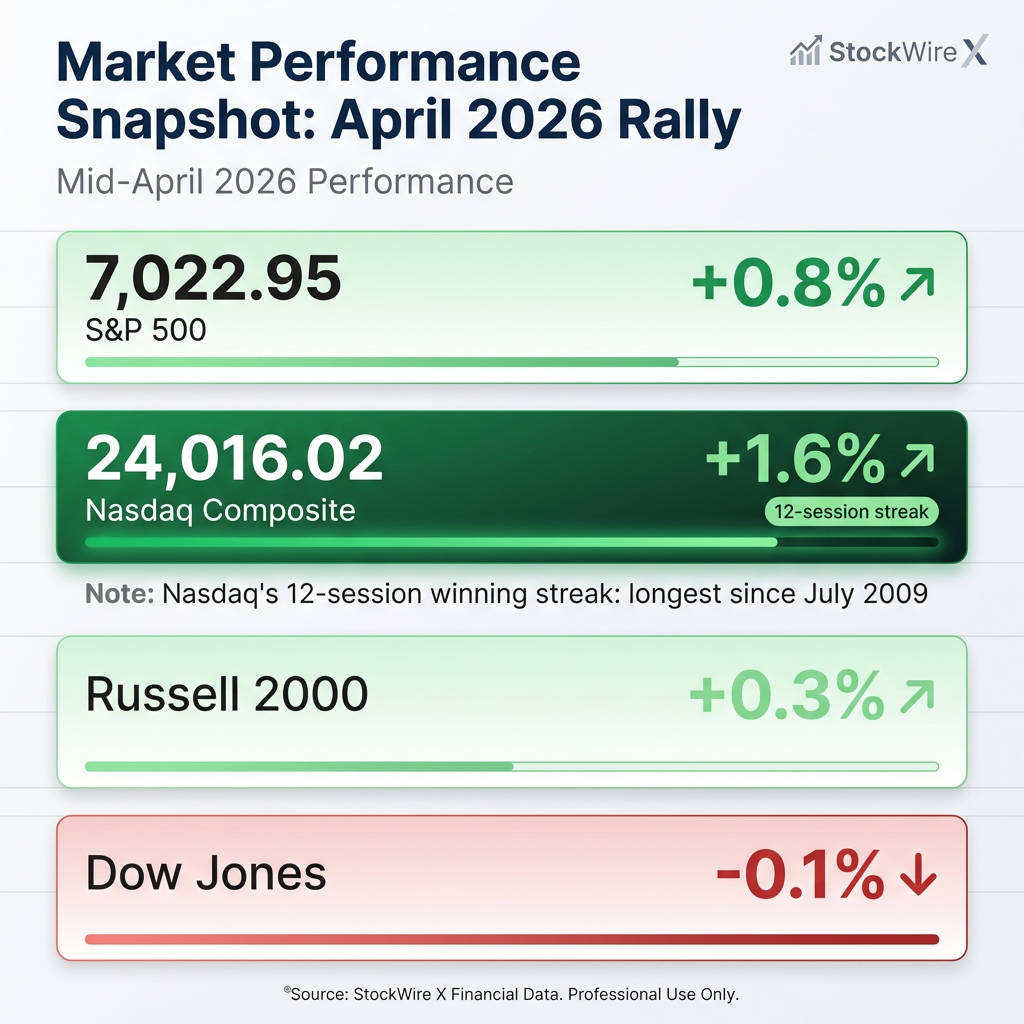
- The S&P 500 reached 7,022.95 and the Nasdaq completed a 12-session winning streak, its longest run since July 2009, signalling sustained bullish momentum despite cautious investor sentiment.
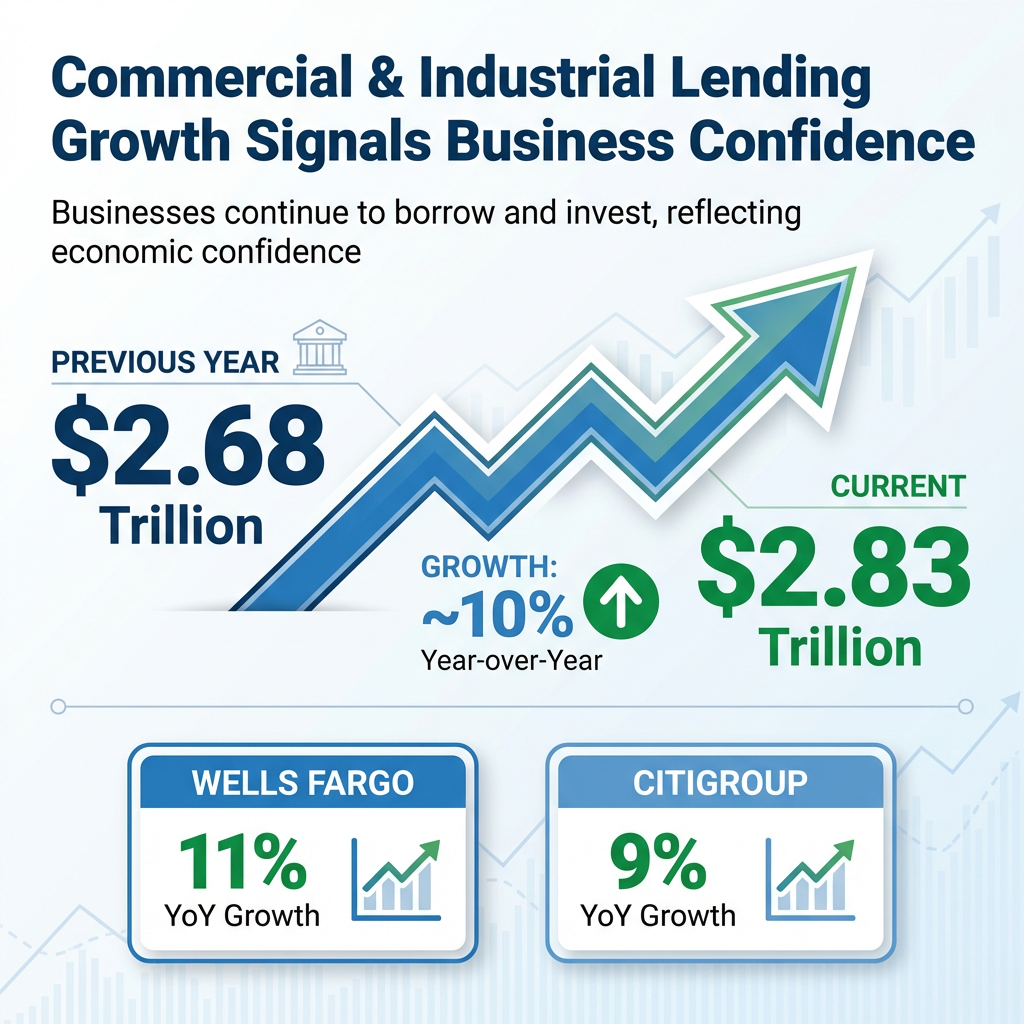
- Commercial and industrial lending hit $2.83 trillion, representing roughly 10% annual growth, with Wells Fargo and Citigroup reporting double-digit loan expansion, indicating strong business confidence.
- All major Wall Street institutions have set year-end S&P 500 targets above current levels, ranging from 7,100 to 7,800, implying potential upside of 1% to 11% from mid-April 2026 prices.
- Semiconductor and AI stocks are acting as leading indicators of economic health, with the Nasdaq's outperformance confirming that technology infrastructure investment remains the market's dominant theme.
- Lowered Q1 2026 analyst earnings forecasts have reduced the bar for positive surprises, creating a potential near-term catalyst that could extend the current rally if corporate results beat conservative expectations.
The S&P 500 reached 7,022.95 on Wednesday, climbing 0.8% to reclaim its January 2026 high after a late March correction that saw the index fall 10%. The Nasdaq Composite advanced 1.6% to 24,016.02, capping a 12-session winning streak, the longest such run since July 2009. Yet investor sentiment remained notably cautious, a disconnect that market analyst Paul Hickey described as revealing. “The equity markets convey a far more positive outlook than prevailing news coverage suggests,” Hickey told CNBC in mid-April.
The March correction that saw the index fall 10% represented the sharpest geopolitical-driven decline since the International Energy Agency characterised the Iran conflict as producing the largest oil supply disruption in market history, with the S&P 500 bottoming at approximately 6,322 on 21 March.
The paradox is striking. Price action pointed to economic resilience, yet many participants remained sceptical. Markets are forward-looking mechanisms, pricing in expectations about future conditions rather than merely reacting to current headlines. This rally may be signalling strength in the real economy that cautious commentary is overlooking.
What Drives a Stock Market Rally: Key Mechanics Explained
Stock markets are forward-looking mechanisms. They price in expected future conditions, which explains why indices can rise even when current headlines appear negative. Understanding this fundamental behaviour helps investors distinguish between sustainable advances and temporary bounces.
Four primary drivers sustain market rallies:
- Corporate earnings growth and expectations: Company profitability and analyst forecasts for future earnings shape valuations and investor confidence
- Economic fundamentals: Employment levels, lending activity, GDP growth, and other macroeconomic indicators signal the health of the underlying economy
- Monetary policy and interest rate expectations: Central bank decisions and anticipated policy shifts influence borrowing costs and investment flows
- Investor sentiment and positioning: Market participant outlook, fund flows, and positioning patterns affect demand for equities
Wall Street institutions have established year-end S&P 500 targets ranging from 7,100 to 7,800, all above the current 7,022.95 level. These projections reflect institutional assessments of the fundamental drivers listed above, suggesting major banks see additional upside potential from mid-April levels.
When big ASX news breaks, our subscribers know first
Economic Indicators Supporting the Rally
Multiple economic metrics point to genuine resilience in the U.S. economy. Hickey argued that the real economy remains robust, which supports equity appreciation rather than the decline many expected under recent pressure.
| Economic Indicator | Current Reading | Comparison/Context |
|---|---|---|
| Commercial & Industrial Lending | $2.83 trillion | Up from $2.68 trillion year-over-year |
| Unemployment Rate | 4.3% | Relatively stable, gradual cooling |
| March Job Additions | 178,000 jobs | Continued employment growth |
| Weekly Initial Claims | 207,000 | Below 4-week average of 209,750 |
| Fed Districts Expanding | 8 of 12 | Federal Reserve April Beige Book |
Bank lending data provides particularly strong evidence of business confidence. Commercial and industrial lending reached $2.83 trillion, representing approximately 10% annual growth. Wells Fargo reported 11% year-over-year loan growth, whilst Citigroup posted 9% growth. This credit demand reflects continued business investment and expansion activity, a signal that executives remain willing to borrow for growth initiatives.
Labour market conditions showed gradual cooling without significant deterioration. The 4.3% unemployment rate and contained jobless claims indicate no alarming breakdown in hiring. The Federal Reserve’s April Beige Book characterised labour demand as relatively stable across eight of 12 districts, a finding consistent with an economy experiencing moderate deceleration rather than contraction.
Semiconductor and AI Stocks Lead Market Higher
Hickey presented a framework positioning semiconductor stocks as the modern equivalent of Dow Theory transport stocks. Just as railroad and shipping shares once signalled broad economic activity by moving goods, chip stocks now indicate the health of the digital economy by enabling computation, connectivity, and artificial intelligence infrastructure. Their strength matters because technology underpins economic activity across sectors.
The Nasdaq’s dominant performance on 15 April, up 1.6% and completing its 12-session streak, reflected sustained conviction in AI and technology infrastructure investments. Chip and AI stocks reaching new highs confirmed that the market’s dominant investment theme remained intact, with participants continuing to allocate capital toward companies positioned to benefit from artificial intelligence adoption.
Market breadth offered additional reassurance. The Russell 2000 gained 0.3%, indicating small-cap participation in the rally beyond large-cap technology names. The Dow’s slight 0.1% decline suggested some rotation within the market, but the broader advance across indices and market capitalisation tiers remained healthy.
The S&P 500 and Nasdaq reached all-time highs on 17 April 2026, marking the third consecutive weekly advance for all major US indices as optimism around US-Iran peace negotiations reduced geopolitical risk premiums and supported continued equity inflows across market capitalisation tiers.
The next major ASX story will hit our subscribers first
Wall Street Price Targets and Earnings Season Outlook
All major Wall Street institutions have established year-end S&P 500 targets that exceed the current 7,022.95 level, with implied upside ranging from approximately 1% to 11%. This institutional consensus reflects expectations that economic fundamentals, corporate earnings, and policy conditions will support further gains through the remainder of 2026.
| Institution | Year-End S&P 500 Target | Implied Upside |
|---|---|---|
| Morgan Stanley | 7,800 | ~11% |
| Citigroup | 7,700 | ~10% |
| Barclays | 7,650 | ~9% |
| Goldman Sachs | 7,600 | ~8% |
| UBS Global Wealth Management | 7,500 | ~7% |
| J.P. Morgan | 7,200 | ~2.5% |
| Bank of America | 7,100 | ~1% |
The Q1 2026 earnings season setup may create favourable conditions for positive surprises. Hickey argued that reduced analyst forecasts have lowered the bar for companies to beat expectations. When estimates are conservative, even moderately strong quarterly results can exceed lowered projections, generating upside surprises that support further market gains. This dynamic could serve as a near-term catalyst rather than a risk to the rally.
Key Considerations for Investors Navigating This Rally
Optimism surrounding U.S.-Iran ceasefire negotiations drove positive sentiment in mid-April, contributing to the rally’s momentum. Reduced fears of worst-case economic scenarios allowed the S&P 500 to recover rapidly from March’s 10% decline, demonstrating the market’s ability to absorb geopolitical shocks when underlying fundamentals remain sound.
Investors should monitor several factors for signs of changing dynamics:
- Q1 2026 earnings results relative to lowered expectations: Corporate performance against reduced analyst forecasts will test whether the rally has fundamental support
- Federal Reserve communications and policy signals: Any shift in central bank guidance on interest rates or economic outlook could influence market direction
- Geopolitical developments, particularly the U.S.-Iran situation: Further escalation or sustained ceasefire will affect energy prices and risk sentiment
- Semiconductor and AI sector continued leadership: Sustained strength in technology infrastructure stocks would confirm the durability of the dominant investment theme
- Market breadth and small-cap participation: Broad participation across market capitalisation tiers suggests healthier advances than narrow rallies concentrated in a few large stocks
Federal Reserve communications and policy signals have shifted materially since early 2026, when markets priced in two rate cuts; by mid-April, a 73% probability emerged that the Fed would hold rates steady through year-end as energy-driven inflation pressures mounted.
The disconnect between cautious sentiment and strong price action creates both opportunity and uncertainty. Whilst scepticism often prevails at market peaks, it can also persist during sustainable advances. The underlying economic data, including robust bank lending of $2.83 trillion, stable employment at 4.3% unemployment, and expansion across eight of 12 Federal Reserve districts, currently supports the latter interpretation. The S&P 500’s journey from 3,756 in 2020 to the current 7,022.95 reflects a multi-year advance built on economic recovery and corporate earnings growth. Conditions warrant continued monitoring, but the fundamental case for the rally remains intact based on available evidence.
This article is for informational purposes only and should not be considered financial advice. Investors should conduct their own research and consult with financial professionals before making investment decisions.
For investors navigating the disconnect between cautious sentiment and strong price action, our comprehensive walkthrough of volatility investment strategies examines portfolio positioning approaches, risk management frameworks, and sector allocation tactics that have proven effective during the April 2026 geopolitical uncertainty period.
Frequently Asked Questions
What is driving the current stock market rally in 2026?
The 2026 stock market rally is driven by strong corporate lending growth, stable employment, AI and semiconductor sector leadership, and Wall Street price targets ranging from 7,100 to 7,800 for the S&P 500, all pointing to economic resilience despite cautious sentiment.
Why do stock markets rise even when news headlines seem negative?
Stock markets are forward-looking mechanisms that price in expected future conditions rather than current headlines, which is why the S&P 500 can advance even when prevailing news coverage appears pessimistic.
What economic indicators support the S&P 500 rally?
Key supporting indicators include commercial and industrial lending reaching $2.83 trillion (approximately 10% annual growth), an unemployment rate of 4.3%, 178,000 jobs added in March, and eight of 12 Federal Reserve districts reporting expansion in the April Beige Book.
What are Wall Street's year-end S&P 500 targets for 2026?
Major institutions have set year-end S&P 500 targets above the current 7,022.95 level, with Morgan Stanley at 7,800, Goldman Sachs at 7,600, and Bank of America at the most conservative 7,100, implying upside of roughly 1% to 11%.
How should investors position themselves during this stock market rally?
Investors should monitor Q1 2026 earnings results against lowered analyst expectations, Federal Reserve policy signals, geopolitical developments around U.S.-Iran negotiations, and whether semiconductor and small-cap stocks continue to participate broadly in the advance.