How Iran Conflict Drove History’s Largest Oil Shock and 5% S&P Drop

Key Takeaways
- The Iran conflict produced the largest oil supply disruption in history according to the International Energy Agency, sending the S&P 500 down approximately 5% over five consecutive weeks through March 2026.
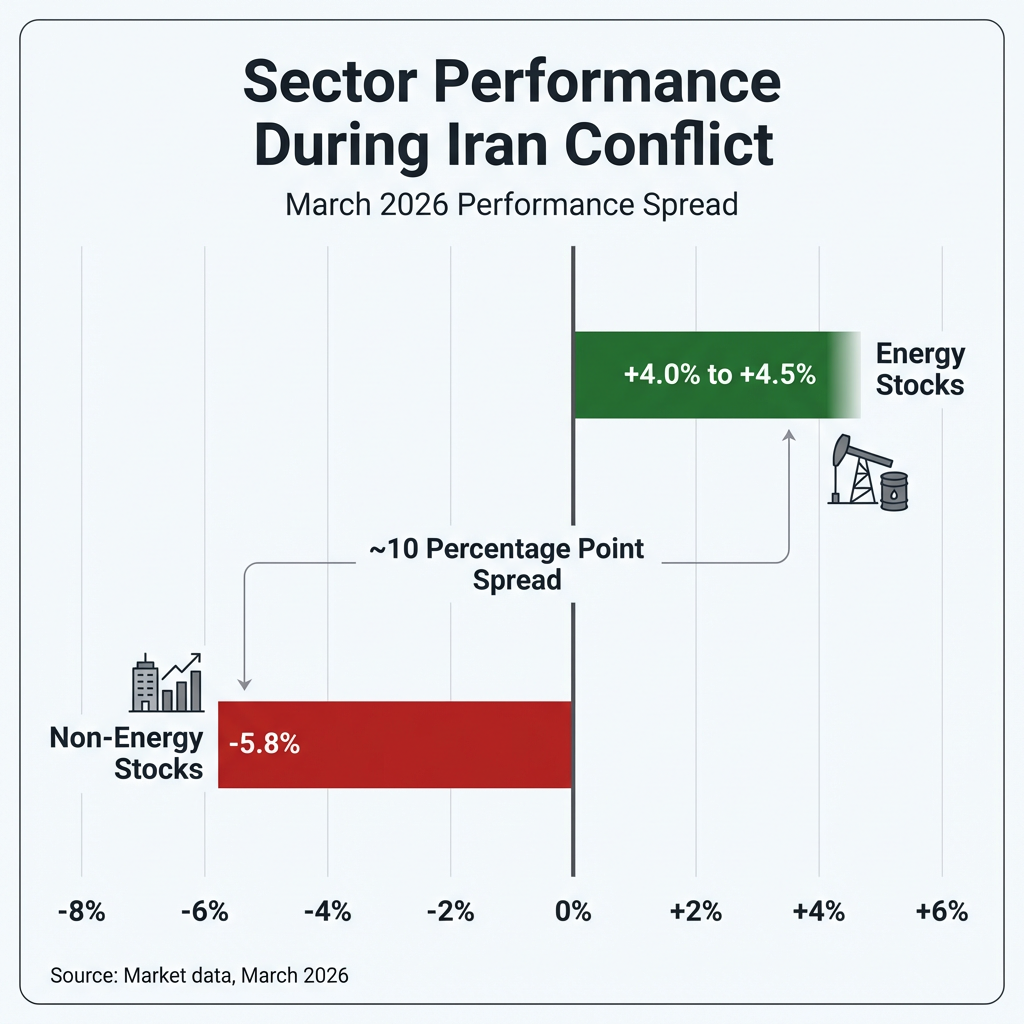
- Energy stocks gained 4-4.5% while non-energy stocks fell 5.8%, creating a roughly 10 percentage point sector spread that reflects classic geopolitical risk rotation toward commodity price beneficiaries.
- A temporary truce on April 17-18, 2026 eased acute supply concerns, but analysts warn that risk premiums and market volatility will likely remain elevated due to infrastructure damage and uncertainty about truce durability.
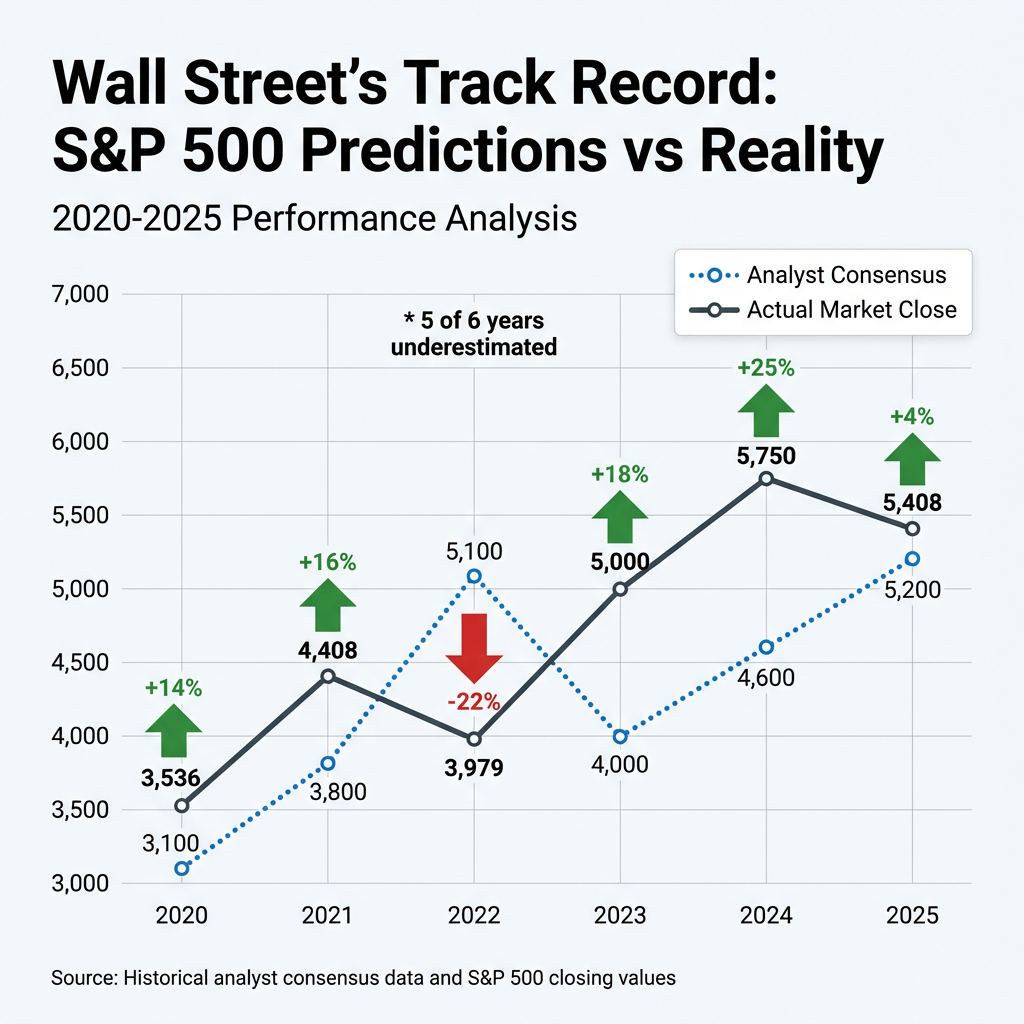
- Wells Fargo cut its S&P 500 year-end target from 7,800 to 7,300, though Wall Street analysts underestimated actual index performance in five of the six years from 2020 through 2025.
- Investors are advised to review sector exposure for energy cost vulnerability, monitor diplomatic developments, and avoid reactive trading decisions, as historical recovery patterns have consistently rewarded patient long-term holders.
The Iran conflict has produced what the International Energy Agency characterises as the largest supply disruption in oil market history. The S&P 500 declined approximately 5% through March 2026, marking five consecutive weeks of losses. This analysis examines sector performance divergence, the temporary truce’s implications, and what Wall Street’s forecast revisions reveal about forward positioning.
Current Market Snapshot: How Bad Is the Damage?
The S&P 500’s 5% decline through March 2026 represents a significant correction, though not a catastrophic market breakdown. The five-week consecutive drop had occurred only twice in the previous 15 years, highlighting the sustained nature of selling pressure. On March 2, 2026, the Dow Jones fell over 400 points in a single session.
International markets experienced steeper losses than domestic indices. The MSCI ACWI ex-US Index declined more than 10% during March 2026, reflecting heightened vulnerability in markets more dependent on Middle Eastern energy imports.
| Index | Performance | Period |
|---|---|---|
| S&P 500 | Down ~5% | Through March 2026 |
| Dow Jones | -400+ points | March 2, 2026 |
| MSCI ACWI ex-US | Down >10% | March 2026 |
The correction provides clear benchmarks for investors assessing portfolio performance relative to broader market conditions. Domestic equity exposure limited losses compared to international holdings during this period.
When big ASX news breaks, our subscribers know first
Understanding the Energy Supply Shock
The Strait of Hormuz closure created structural supply constraints that distinguish this conflict from typical geopolitical tensions. This critical chokepoint handles roughly 20% of global oil transit, making physical supply disruption unavoidable when the strait closes.
The International Energy Agency’s characterization as the largest supply disruption reflects not just volume metrics but the concentration risk inherent in Strait of Hormuz dependency, where one-fifth of global oil transit flows through a chokepoint vulnerable to single-point-of-failure scenarios that distinguish this energy security challenge from typical supply shocks.
International Energy Agency Assessment “Largest supply disruption in the history of the global oil market.”
The closure drove elevated global oil and gas prices as physical supply constraints emerged regardless of strategic petroleum reserve releases or demand reduction efforts. When a chokepoint controlling one-fifth of global oil supply closes, markets cannot substitute alternative routes quickly enough to prevent price spikes.
Oil futures markets reflected this supply tightness through steep backwardation. This market structure occurs when near-term contracts trade at premiums to longer-dated contracts, signalling immediate physical demand pressure. Backwardation indicates market participants expect continued disruption and are willing to pay premiums for immediate delivery rather than waiting for future supply.
Winners and Losers: Sector Performance Breakdown
The conflict produced sharp sector divergence, with energy stocks gaining approximately 4-4.5% whilst non-energy companies declined approximately 5.8%. The spread between these sectors reached roughly 10 percentage points, reflecting classic geopolitical risk rotation.
| Sector | Performance | Key Driver |
|---|---|---|
| Energy Stocks | +4% to +4.5% | Elevated oil/gas prices |
| Non-Energy Stocks | -5.8% | Cost inflation concerns |
| Airlines | United Airlines -6% | Fuel cost pressure |
Investors rotated toward commodity price beneficiaries whilst reducing exposure to sectors vulnerable to energy cost inflation. Energy companies benefit directly from higher oil and gas prices through improved revenues and margins. Conversely, energy-intensive industries face margin compression as input costs rise.
The inflation transmission mechanisms from energy price spikes operate through direct consumer price effects (gasoline, heating), input cost increases across manufacturing and transportation, and second-round effects as businesses pass through higher costs, creating the margin compression pressures visible in energy-intensive sector performance.
Sectors most vulnerable to elevated energy costs experienced the steepest declines:
- Airlines: Fuel represents 20-30% of operating costs; United Airlines declined 6% as jet fuel prices surged
- Transportation: Shipping and logistics companies face direct fuel cost increases
- Manufacturing: Energy-intensive production processes suffer margin pressure
- Consumer Discretionary: Reduced disposable income as consumers face higher energy bills
The rotation pattern represents textbook geopolitical risk response, with capital flowing toward direct commodity exposure and away from economically sensitive sectors.
The Temporary Truce: Relief Rally or False Dawn?
A temporary truce was announced on April 17-18, 2026, with Iran reporting the Strait of Hormuz is “completely open.” The announcement eased immediate supply concerns and reduced acute energy market stress. Physical oil shipments could theoretically resume through the critical chokepoint.
However, analysts warned that relief may prove temporary. Market volatility will likely continue despite diplomatic progress, and headline risk remains elevated.
Key analyst concerns include:
- Significant doubt about truce durability and whether it represents genuine de-escalation
- Risk premiums will remain elevated as markets price ongoing uncertainty
- Shipping operators may remain cautious about re-escalation risk, limiting immediate supply normalisation
- Political pressures on both sides could undermine truce sustainability
Even if the peace agreement holds, Strait of Hormuz shipping could face disruptions for months. Destruction of key regional infrastructure during the conflict requires repair time regardless of diplomatic progress. Elevated shipping costs are expected to persist as insurance premiums increase and operators factor re-escalation risk into route planning.
Wall Street’s Revised Outlook: What the Numbers Show
Major investment firms reduced S&P 500 targets following the conflict escalation. Wells Fargo cut its year-end target from 7,800 to 7,300, whilst JPMorgan reduced its outlook citing limited upside. Multiple additional firms scaled back expectations as elevated oil prices and low consumer confidence weighed on growth forecasts.
Historical data provides crucial context for interpreting these revisions. Analysts have systematically underestimated S&P 500 performance in five of the six years from 2020 through 2025.
| Year | Consensus Forecast | Actual Close | Variance |
|---|---|---|---|
| 2020 | 3,300 | 3,756 | +14% |
| 2021 | 4,100 | 4,766 | +16% |
| 2022 | 4,950 | 3,840 | -22% |
| 2023 | 4,050 | 4,770 | +18% |
| 2024 | 4,720 | 5,881 | +25% |
| 2025 | 6,600 | 6,846 | +4% |
The pattern shows systematic underestimation except during 2022, when aggressive Federal Reserve rate hikes triggered an unexpected bear market. In 2024, analysts underestimated the actual close by nearly 25%, the widest miss in the period examined.
Forecasts serve as directional indicators rather than precise predictions. The current pessimism may or may not prove justified. Structural risks from Strait of Hormuz disruption differ meaningfully from the policy-driven concerns that dominated previous years.
The next major ASX story will hit our subscribers first
What Should Investors Do Now?
Historical parallels offer perspective whilst acknowledging current risks carry distinct characteristics. In April 2025, markets dropped following sweeping tariff announcements but recovered quickly after policy rollback. That episode demonstrated markets’ ability to rebound when policy-reversible risks resolve.
The historical recovery pattern analysis from the initial 8% drawdown through mid-April 2026 demonstrates markets’ systematic tendency to reprice geopolitical risks downward once acute crisis phases pass, a behavioral pattern that has rewarded patient holders across multiple conflict cycles despite continued elevated headline uncertainty.
The Iran conflict presents a different risk profile. Tariffs represented policy decisions that could be reversed through administrative action. Infrastructure damage to Strait of Hormuz shipping represents structural disruption requiring months to repair regardless of diplomatic progress.
Key positioning considerations for current conditions include:
- Review sector exposure, particularly energy holdings that may provide portfolio hedge
- Assess vulnerability to energy cost inflation across holdings
- Maintain perspective on historical recovery patterns following geopolitical shocks
- Monitor diplomatic developments without making reactive trading decisions on headlines
- Avoid panic selling based on short-term volatility
Investors who maintain positions during downturns generally achieve positive outcomes over both short and long horizons. Historical data shows that remaining invested has rewarded patience more consistently than market timing attempts. The current environment carries genuine structural risks, but wholesale portfolio repositioning based on near-term uncertainty often proves counterproductive.
Conclusion
The Iran conflict produced significant market disruption through March 2026, with the S&P 500 declining 5% and international markets falling more than 10%. Energy sector outperformance of roughly 4-4.5% contrasted sharply with non-energy stocks’ 5.8% decline, reflecting classic commodity price beneficiary rotation.
The temporary truce announced April 17-18, 2026 eased immediate supply concerns, but analysts warn that volatility will persist given uncertainty about durability. Wall Street’s downward forecast revisions follow a historical pattern of underestimation in five of the past six years, though structural infrastructure risks distinguish current conditions from policy-reversible scenarios.
Investors facing geopolitical uncertainty benefit from maintaining investment discipline rather than reactive repositioning. Historical recovery patterns suggest patience typically rewards long-term holders, though monitoring sector exposure and vulnerability to energy cost inflation remains prudent during this period.
This article is for informational purposes only and should not be considered financial advice. Investors should conduct their own research and consult with financial professionals before making investment decisions.
Frequently Asked Questions
How has the Iran conflict affected the stock market in 2026?
The Iran conflict pushed the S&P 500 down approximately 5% through March 2026 over five consecutive weeks of losses, while international markets tracked by the MSCI ACWI ex-US fell more than 10% during the same period.
What is the Strait of Hormuz and why does it matter to investors?
The Strait of Hormuz is a critical shipping chokepoint that handles roughly 20% of global oil transit; its closure during the Iran conflict caused the International Energy Agency to declare the largest supply disruption in the history of the global oil market, driving elevated energy prices worldwide.
Which stock market sectors are winning and losing during the Iran conflict?
Energy stocks gained approximately 4-4.5% as oil and gas prices rose, while non-energy stocks declined around 5.8%, with airlines like United Airlines hit hardest as jet fuel represents 20-30% of their operating costs.
What did the April 2026 Iran truce mean for oil markets and stock investors?
A temporary truce announced on April 17-18, 2026 eased immediate supply concerns and Iran reported the Strait of Hormuz was fully open, but analysts warned that volatility and elevated risk premiums would likely persist given uncertainty about the truce's durability and ongoing infrastructure damage.
Should I sell my stocks during the Iran conflict market downturn?
Historical data suggests investors who maintain positions during geopolitical downturns generally achieve positive outcomes over time, and reactive selling based on short-term volatility has consistently proven less effective than staying invested across multiple conflict cycles.