A Federal Reserve hold sounds like the quietest outcome a central bank can deliver. This week it is not. Markets price roughly a 90% chance the Fed holds rates on Wednesday, yet the decision lands in the same few days as the Bank of Canada, the European Central Bank, the Bank of Japan, a Chinese Communist Party plenum and earnings from Alphabet, Microsoft and Amazon.
That clustering is the real risk. A “non-event” at the Fed can still reprice your portfolio if it shifts expectations at the same moment as three other central banks and the biggest names in tech.
The backdrop makes it harder. US indices have been consolidating after a downtrend that began in early October, and earnings have arrived broadly in line, offering no fresh reason to buy. The question underneath every chart right now is simple: what has changed to justify more upside?
This Fed week preview gives you a working framework for reading price action, rate pricing and earnings reactions together, so you can judge each headline against what is already in prices rather than in isolation.
What is on the calendar, and which events actually move markets?
The week is dense. Five central bank or policy events, a run of macro data across three continents and several of the largest AI-linked companies all report inside five trading days.
Most of it will not move your portfolio much. The useful skill is ranking each event by how far a surprise could stray from what markets already expect.
| Event | Date | Expectation | What would surprise |
|---|---|---|---|
| Federal Reserve | 27-28 October | Hold at 3.75%-4.00% (about 90%) | A hike, or language softening or hardening the December path |
| Bank of Canada | 28 October | 25 bp hike to 2.50% | A hold, given only 19 of 34 economists expect a hike |
| ECB | This week | Hold at 2.50% deposit rate | Any response to bond turmoil that alters December pricing |
| Bank of Japan | 29-30 October | Hold at 1.25% | Guidance pointing firmly to 1.50% soon |
| China fifth plenum | 26-29 October | Party discipline and personnel | Unexpected economic or trade signals |
Wednesday and Thursday: the pressure points
Wednesday anchors the week. A hold that is 90% priced tells you almost nothing on its own, so your attention belongs on the statement wording and the press conference for any change in the path toward the 8-9 December meeting.
The Bank of Canada decides the same day, and its split economist poll makes it the likeliest central bank surprise. Bank of New York Mellon (BNY) data shows a December ECB hike to 2.75% about 75% priced, so the ECB’s tone on the bond selloff matters more than its rate. For the BOJ, the debate is whether 1.50% arrives in December or January.
For the BOJ, a hold at 1.25% is expected, so BOJ forward guidance on whether 1.50% comes in December or January is what can move the yen and carry trades after the decision.
Taken together, these decisions test one idea: whether an oil-driven inflation shock forces central banks into synchronised tightening. Alphabet and Microsoft report Wednesday, with Amazon and Intel on Thursday, so rate news and earnings news will collide.
The rest of the week
Australia’s Q3 CPI arrives Tuesday, with big-four bank forecasts for trimmed-mean inflation centred near 1.0% quarter-on-quarter, above the Reserve Bank of Australia’s 0.8%. Bank forecasts put headline inflation at 3.9% year-on-year, while the original source expected 4.2%; the gap likely reflects different measures, so check which one you are reading. Seagate and Corning also report Tuesday.
China’s plenum is mainly about party discipline and personnel, not stimulus. Friday closes with Eurozone GDP and Chinese purchasing managers’ index data.
When big ASX news breaks, our subscribers know first
How to read rate pricing: why would the Fed hike into an oil shock?
Start with the signal. Depending on which snapshot you read, the market prices a December Fed hike at somewhere between roughly 67% and 90%.
Reading the pricing range
The sources genuinely disagree. CME FedWatch put a December hike at 76.2% on 26 October, other reports placed it near 67.5%-76%, Reuters described roughly 80% on 23-24 October, and the original source cited about 90%.
Probabilities shift daily with every data release, so always check the publication time before trusting a number. Treat the range as the message: a December hike is the base case. A Reuters poll found 94 of 100 economists expect an October hold and all 100 expect a December hike.
Because that hike is heavily priced, markets will react to changes in the path beyond December, not the hike itself. The original source shows a further hike about 30% likely by January and 93% by March, though weaker US data has trimmed conviction. The Fed itself signalled two hikes this year (one delivered in September), then a hold through 2027 and cuts by 2028.
The tightening case versus the patience case
Why tighten against a supply shock? Higher oil lifts gasoline and transport costs, which can push up household expectations, company pricing and wage demands. Those second-round effects can turn a temporary energy spike into lasting core inflation, which strips out volatile food and energy.
Oil supply shocks work through first-round energy costs before second-round effects reach wages and core prices, which is why you should watch core readings, not headline CPI, to judge whether central banks must keep tightening.
The counterargument is blunt: rate hikes cannot produce more oil.
- Tightening case: September CPI rose to 3.7% year-on-year, New York Fed one-year inflation expectations hit 3.9% (the highest since May 2023), headline PCE reached 3.6% and core PCE 3.1%.
- Patience case: The shock is external, tied to the US-Israeli war with Iran; September’s 0.8% retail sales gain came largely from a 7.1% jump in gasoline prices, and the Beige Book found little change in overall spending in most districts.
Oil keeps the debate live. Brent was reported above $110, at about $114.73 in late-week reporting, though that figure has not been independently confirmed.
The lesson for this week Markets often react more to changes in the discount rate, risk premium and forward guidance than to whether earnings beat or meet consensus.
Why do in-line earnings fail to lift the market?
On paper, earnings look excellent. FactSet shows S&P 500 Q3 blended growth of 29.5% year-on-year as of 23 October, up from 29.2% a month earlier, while LSEG IBES puts growth above 32% for companies that have reported. Those are different measures, not a contradiction.
So why has the market gone soggy? Because the bar was already set high. Aggregate surprises ran at +16.8% in Q1 and +26.0% in Q2, and the original source puts tech earnings growth at 65.6% annualised.
After surprises that large, meeting expectations removes the catalyst. Analysts have little reason to lift forecasts, and you have little reason to pay a higher multiple.
The gap between earnings beats and stock reaction is already visible this season: when most companies clear the bar by thin margins, you should expect the average price response to a beat to hover near zero.
That is the difference between confirmation and acceleration. Confirmation can hold prices up; only acceleration expands valuations that are already stretched. In crowded AI trades, confirmation without upside can become a reason to sell.
The evidence is already visible. Verizon fell despite decent results, and Apple, Google and Meta lagged on Monday. Reuters commentator Joachim Klement has reportedly warned that forward price-to-earnings ratios can look cheaper as estimates rise, yet valuation risk remains if those estimates are already priced in.
None of Alphabet, Microsoft or Amazon had reported as of 27 October. If you hold large-cap tech, treat a “beat and hold” as neutral at best, and check these four lines instead:
- Capital expenditure: is AI spending rising faster than expected?
- Cloud growth: is it accelerating or merely steady?
- Margins: is spending eroding profitability?
- Guidance: does management raise the outlook for next quarter?
The technical levels show where weak reactions could bite.
| Level | Index | Why it matters |
|---|---|---|
| 29,000 | Nasdaq | First support cluster |
| 28,700 | Nasdaq | Next support if 29,000 breaks |
| 27,500 | Nasdaq | Air pocket with little support above it |
| 2,815-2,820 | Russell 2000 | Former support now acting as resistance |
Consumer pullback or AI boom: which matters more for the economy?
Earnings tell you about a narrow group of companies. The bigger question is whether the broad economy holds up, and here two forces pull in opposite directions.
Why scale favours the consumer
The size gap Consumers account for 68% of the US economy. Business investment accounts for about 14%, roughly one-fifth of the consumer share.
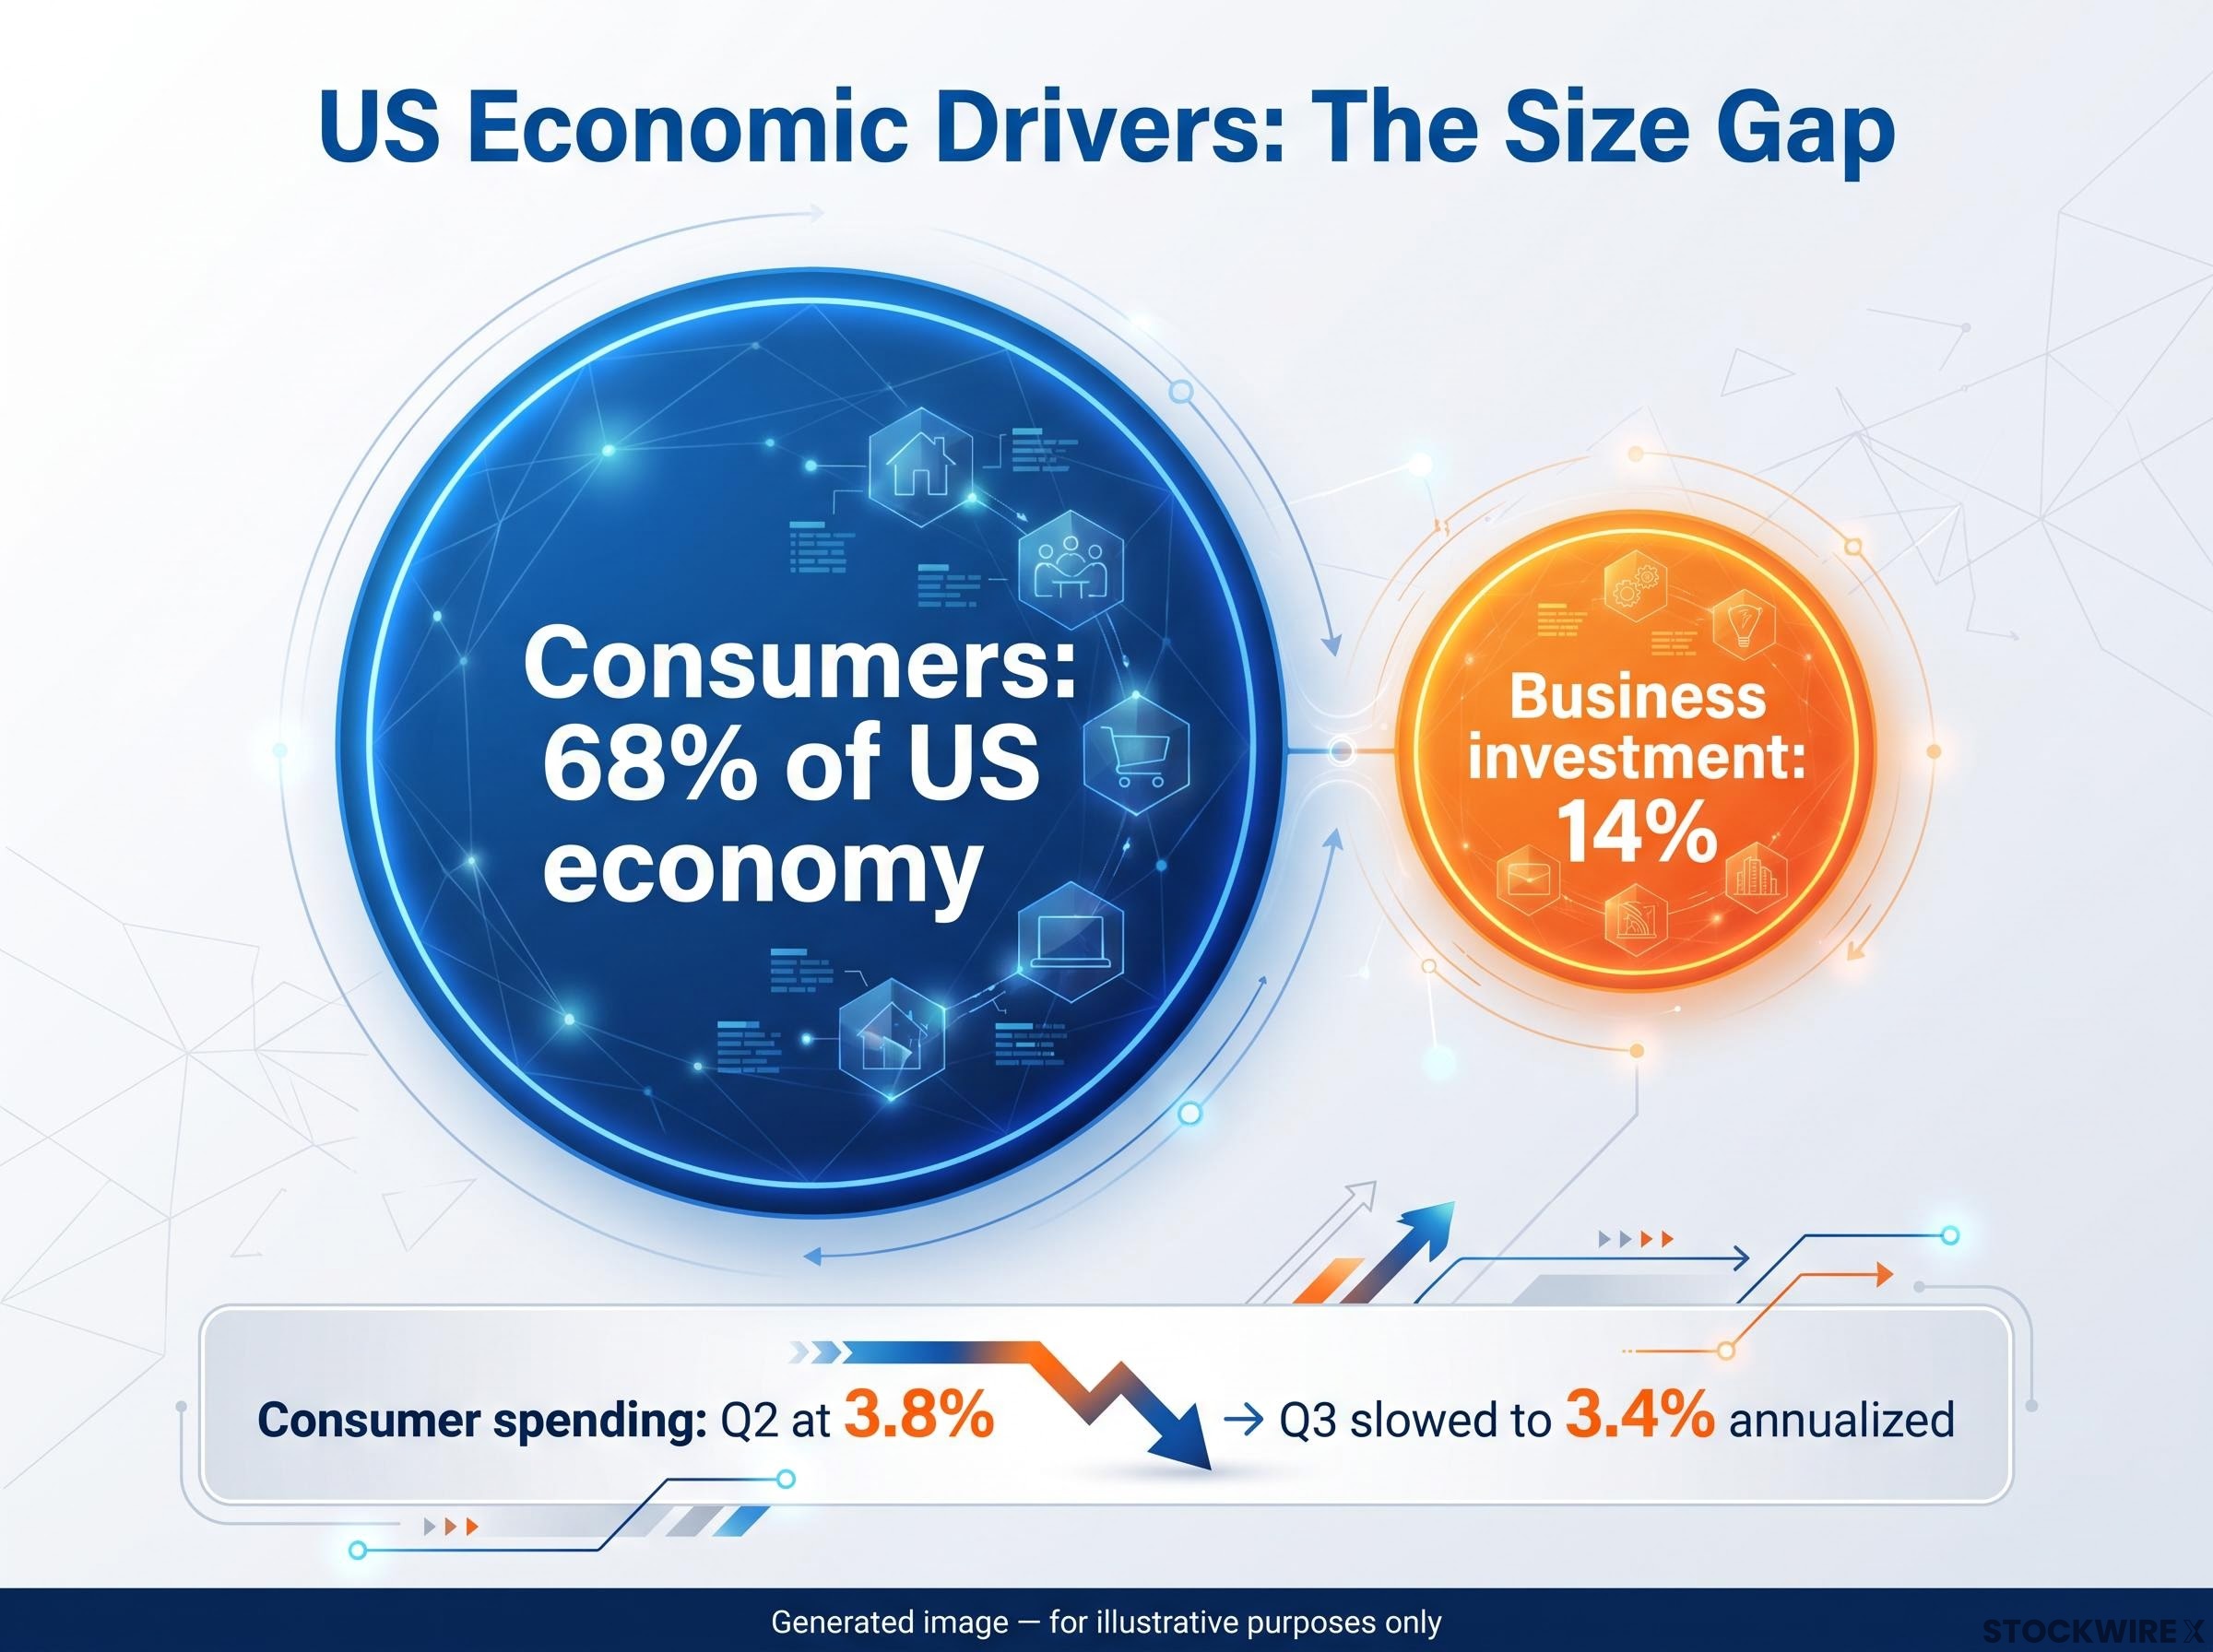
That ratio is why a consumer pullback could overwhelm the data-centre boom. Q3 consumer spending slowed to about 3.4% annualised from 3.8% in Q2, and a GDP tracking model has fallen from 5-6% in early August to 3.5%, against a Reuters consensus of 3.2% (Q2 grew 2.2%).
The 14 October Beige Book described growth as modest and uneven, driven by AI buildout and defence manufacturing. Stress is spreading from low-income to middle-income households, and Boston reported flat overall spending. Remember too that September’s retail strength was mostly gasoline, not demand.
Why AI spending still matters
The scale argument is not the whole story:
- Multiplier effects: data-centre spending flows into semiconductors, construction, software and electricity.
- Profit support: it can lift corporate earnings even if it cannot offset a consumer slowdown one-for-one.
- Concentration: it is spread across a small set of firms, while a consumer pullback would reach every region and income group.
Stress abroad adds weight to the cautious side. France’s 10-year yield reportedly hit about 5%, its highest since 2002, and Italy’s spread has widened, although these figures are not independently confirmed.
As one example of how a macro trader is positioned, the head of global macro at Tasty Live is bearish on equities, holding put verticals in the Russell, Nasdaq and S&P alongside long bonds. A put vertical is a defined-risk options strategy where you sell a higher-strike put and buy a lower-strike put. This is an illustration, not a recommendation.
The weighted view: a broad consumer slowdown reaches more households and sectors than AI spending can offset, so treat spending data as a bigger risk to earnings than any single tech report.
For readers weighing the consumer risk, our detailed coverage of slowing consumer spending shows how real PCE stalled as households cut goods purchases while still paying for services.
Putting the week together: a decision checklist before Friday
No single event sets direction. The combination of rates, earnings and risk premium does. Run each headline through this sequence:
- Pricing versus outcome: compare each decision with what was priced, not with what sounds dramatic.
- Statement tone: listen for shifts in the path beyond December, from the Fed and its peers.
- Earnings quality: judge capex, cloud growth, margins and guidance, not the beat itself.
- Oil and bond stress: check Brent and European yields before trusting any rally.
If all four point the same way by Friday, the signal is worth acting on. If they conflict, patience may be the better call for your portfolio.
Past performance does not guarantee future results. Financial projections are subject to market conditions and various risk factors. These statements are speculative and subject to change based on market developments and company performance.
This article is for informational purposes only and should not be considered financial advice. Investors should conduct their own research and consult with financial professionals before making investment decisions.