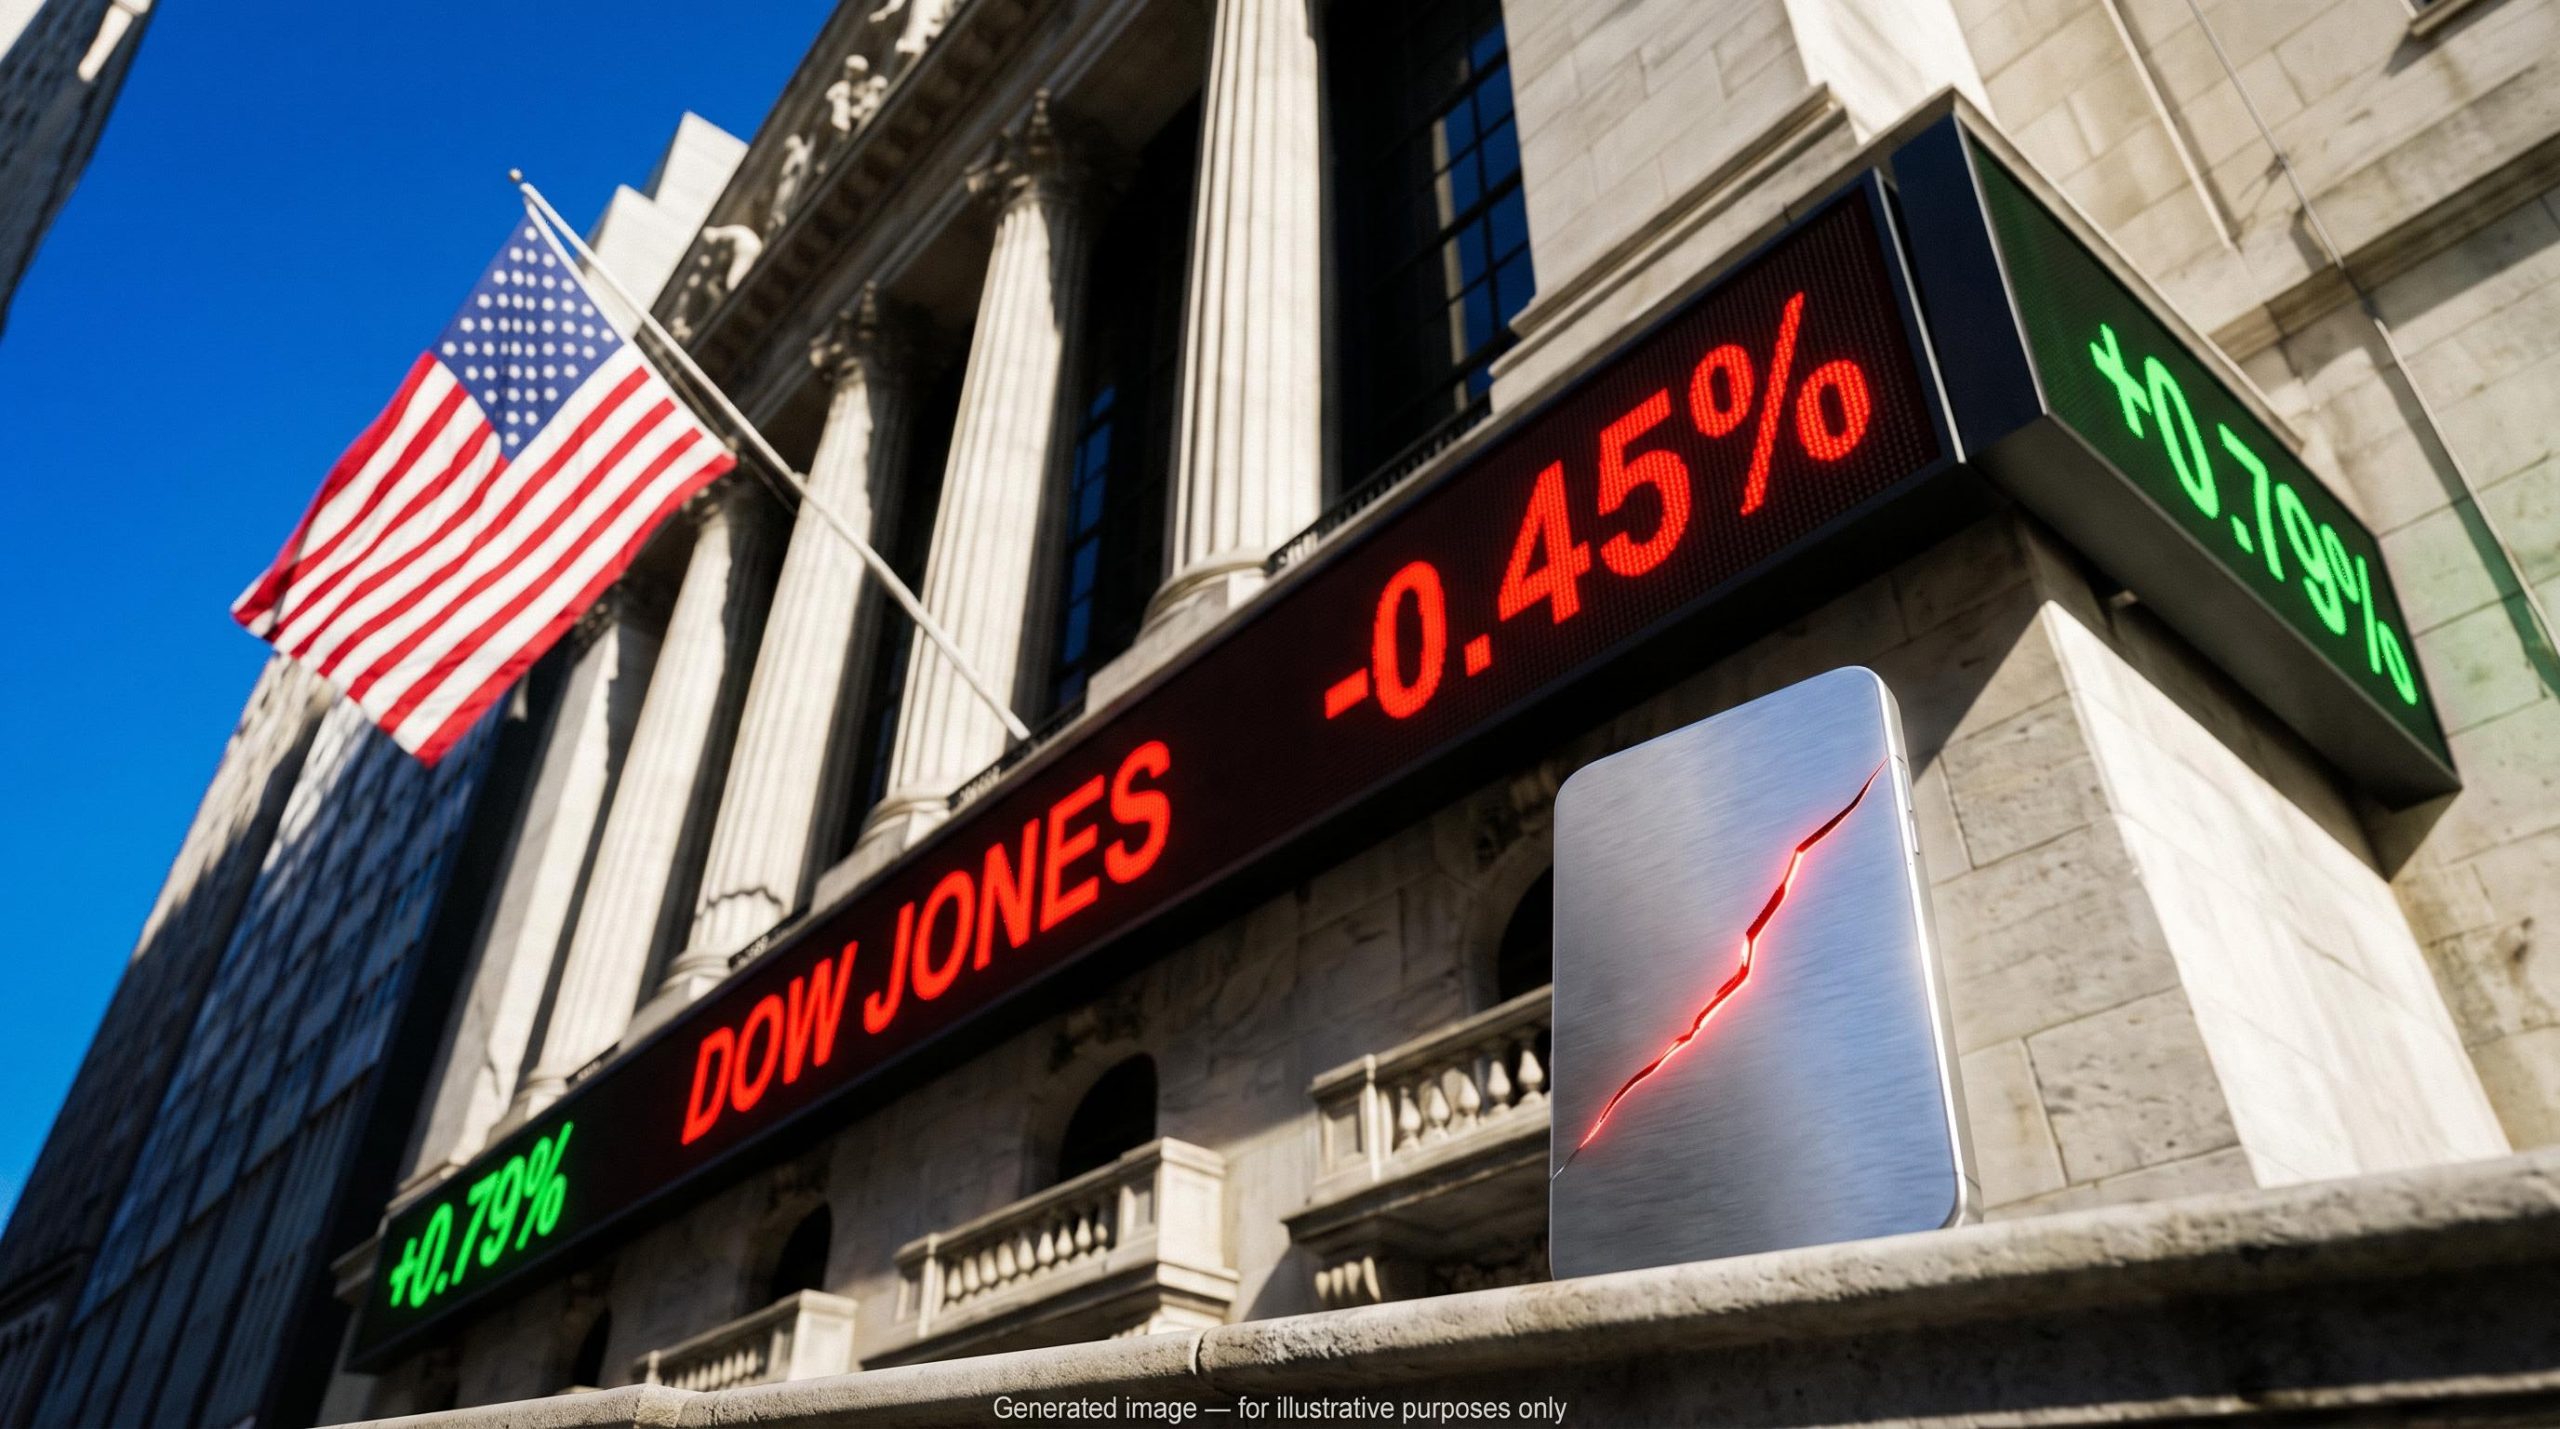
The Dow Jones Industrial Average slipped about 0.45% to near 51,750 in intraday trade on Tuesday, 3 November 2026, while the S&P 500 and Nasdaq Composite climbed. A chip rally lifted most of the market, but one stock’s disappointing guidance was enough to drag the Dow today.
All index levels below are intraday figures from the session, not final closes.
The bigger tests come next. Wednesday is the first trading session to reflect the midterm election results, and it also brings ADP private payrolls and the ISM services survey. October nonfarm payrolls follow on Friday, a run of releases that could shape the Federal Reserve’s December rate decision.
Three things matter here: why a single high-priced stock can swing the Dow, where the index sits on the chart after a cooling October, and which releases this week could shift rate expectations.
Why did Apple pull the Dow lower while chips lifted everything else?
Tuesday reversed Monday’s pattern. On Monday the Dow rose while the Nasdaq Composite fell more than 1%. On Tuesday the Nasdaq and S&P 500 broke a three-session losing streak, and the Dow gave back Monday’s gain.
| Index (intraday) | Level | Point move | % move |
|---|---|---|---|
| Dow Jones Industrial Average | 51,751.68 | -232.30 | -0.45% |
| S&P 500 | 7,571.81 | +30.41 | +0.40% |
| Nasdaq Composite | 25,361.31 | +196.95 | +0.79% |
A later Reuters update showed the Dow narrowing its loss to 0.24% and the Nasdaq extending its gain to 1.06%. These figures have not been independently confirmed.
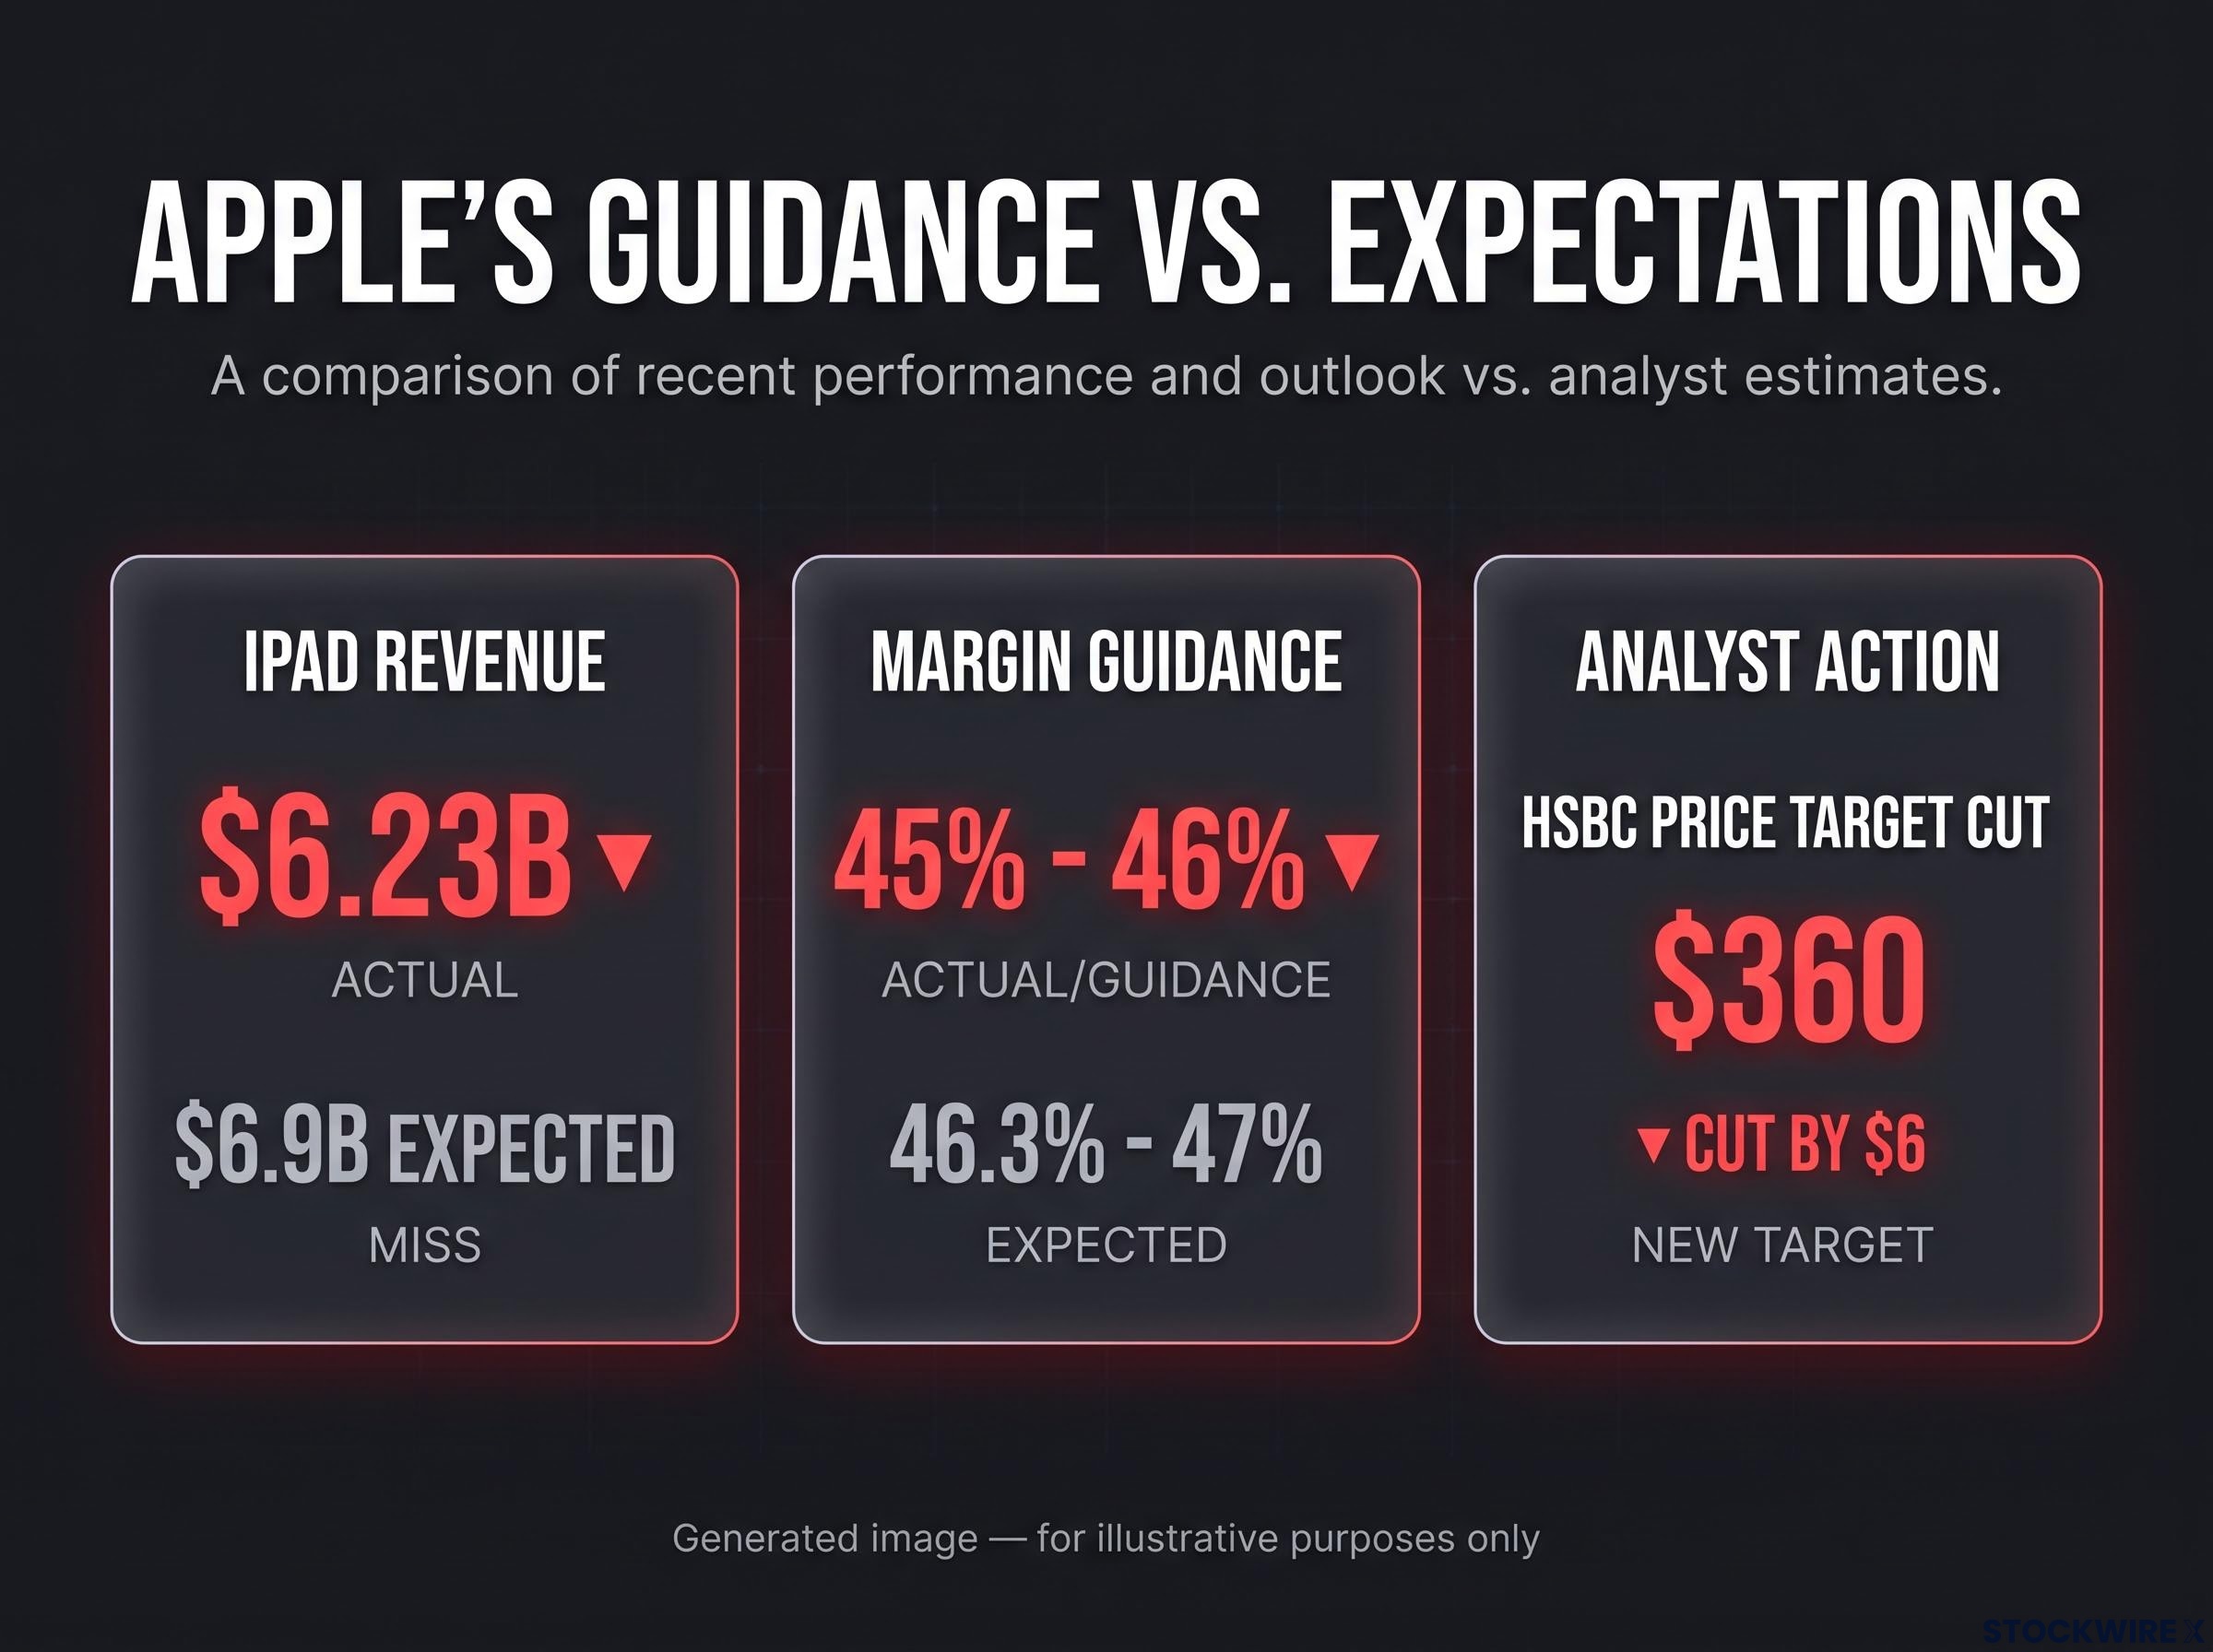
The cause was Apple. Its results on Monday beat on headline revenue and profit, but investors focused on the outlook. Reports put the key figures at:
- Margin guidance: 45%-46% gross margin for the December quarter, against roughly 46.3%-47% expected, with higher memory-chip costs cited
- iPad revenue: about $6.23 billion, short of roughly $6.9 billion expected
- Share reaction: down roughly 2%-3.4% in Tuesday trading
These figures are drawn from reports and are not independently confirmed. HSBC cut its Apple price target by $6 to $360.
How a price-weighted index works
The Dow adds up the share prices of its 30 components and divides the total by a number called the divisor, currently 0.152. That means a $1 move in any stock shifts the index by roughly 6.6 points, whatever the company’s size. The S&P 500 weights companies by market value instead, so the two indices can tell different stories on the same day.
The price-weighting method also means a single expensive stock having a bad week can overwhelm gains across the other 29 components, which is why divergences between the Dow and the S&P 500 are often more informative than either number alone.
Meanwhile, buyers returned to semiconductors. AMD rose ahead of its third-quarter report, with Broadcom, Micron and Nvidia also advancing. The Dow’s red headline reflects one expensive share price, not broad weakness. On days like this, check the S&P 500 and Nasdaq before you read the Dow as a gauge of market mood.
Where does the Dow stand technically after retracing half its October gain?
Start at the bottom of the October climb. The Dow began the month just above 50,500 on 1 October and pushed to a high of 52,927.88 on 22 October.
Then it pulled back. Tuesday’s session opened at 51,932.63, and sources disagree on how low it went: FXStreet put the low near 51,500, the weakest since 14 October, while real-time data showed 51,593.16.
Retracement: The Dow has given back about half of its October advance. The exact October low was not located in an authoritative series, so this figure is approximate.
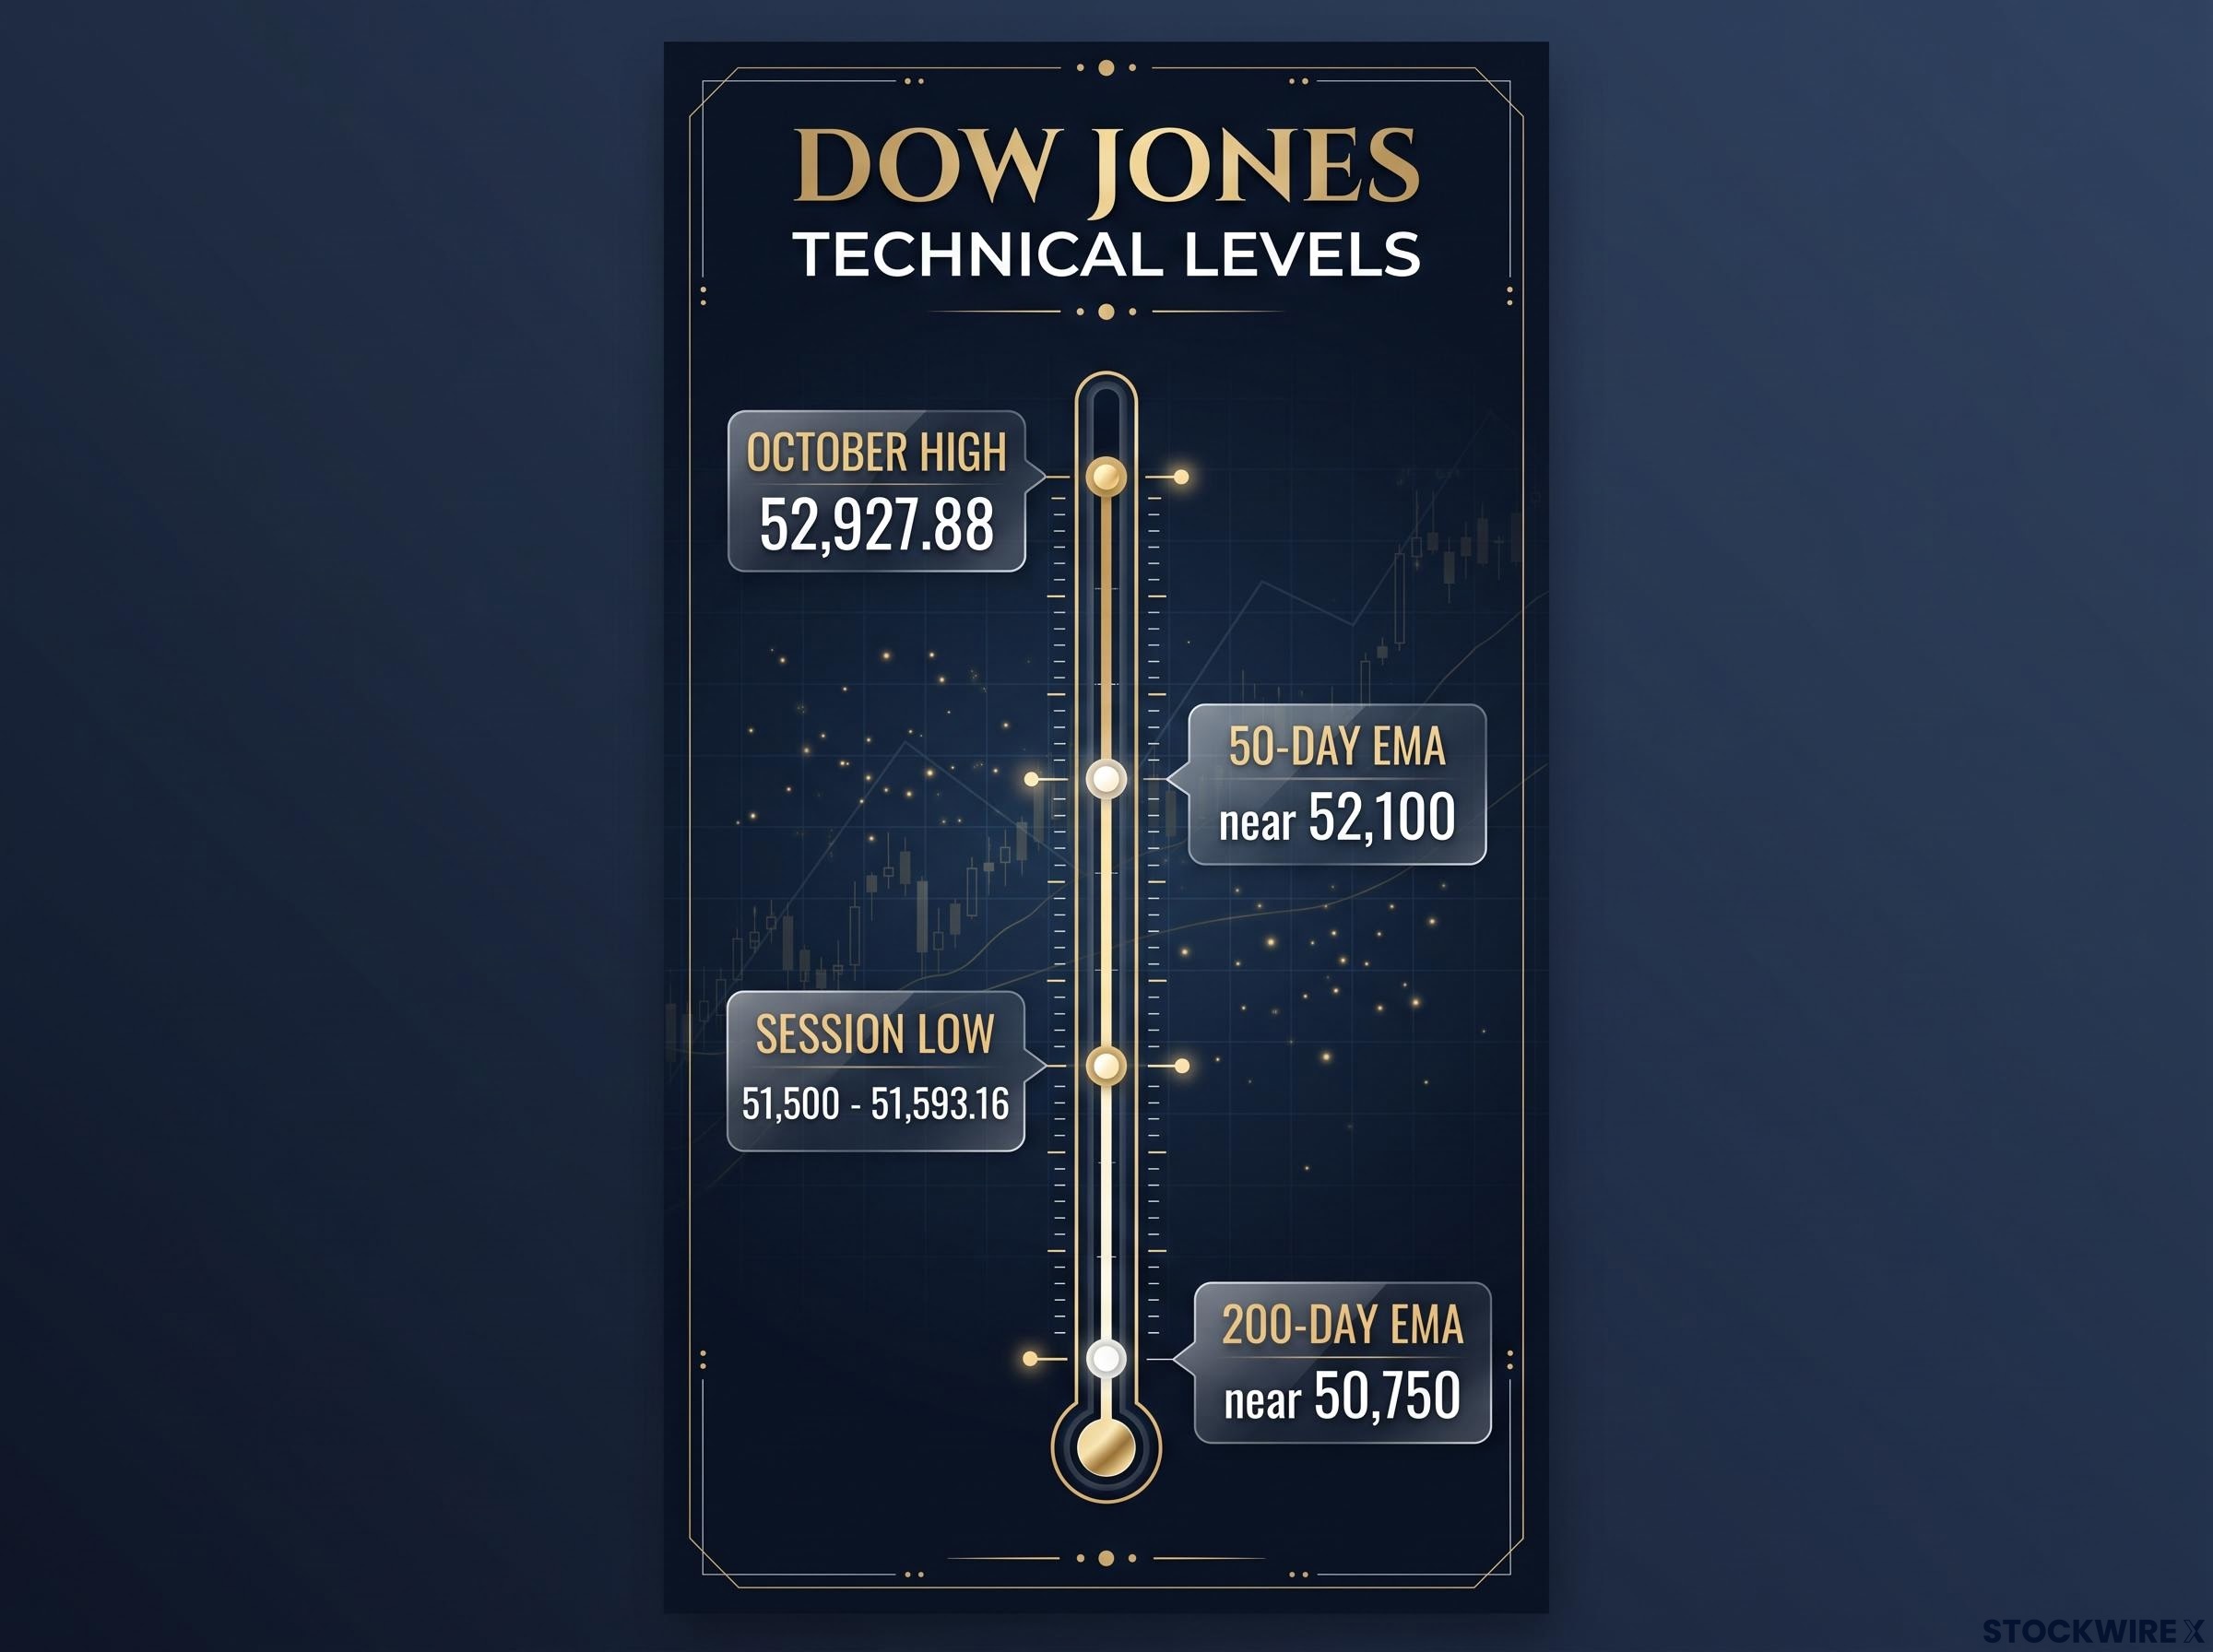
The levels on the chart look like this:
- October high: 52,927.88
- 50-day EMA: near 52,100, now above price after a third close beneath it
- 200-day EMA: near 50,750, the next reference level
- Session low: between 51,500 and 51,593.16, depending on the source
An exponential moving average (EMA) is an average of recent closing prices that gives more weight to the latest sessions. Daily momentum has also cooled from the overbought readings seen through much of late October.
Perspective matters. The Dow is less than 6% below its August high, while the Nasdaq 100 sits roughly 10% under its peak. This is a pullback within a longer-term uptrend, and the 200-day EMA is the level that would change that reading if it broke.
For readers wanting to judge whether this pullback is a correction or a trend change, our deep-dive into how Dow Theory confirms trends explains why the Transportation Average must agree with the Industrial Average.
What do the midterms, ADP, ISM services and payrolls mean for the Fed’s December call?
Midterm odds and market history
Votes are counted after polls close on Tuesday, so Wednesday’s open is the market’s first chance to react. Prediction markets put Democrats at about 94% to win the House and about 74%-78% for the Senate. These are unverified, market-implied figures. Investors and analysts said stocks do not yet reflect a Democratic sweep, which makes the Senate result the bigger uncertainty.
History offers some comfort. Schwab data cited by CNBC shows the S&P 500 gained an average of 5.7% in the three months after midterms, with positive six-month returns in all 13 midterm years studied. BlackRock found weaker six-month returns (10.4%) when a party lost its trifecta, against 16.1% otherwise.
That is an average, not a trading rule. Strategists disagree on whether elections cause these moves, and the pattern can fail during a recession or an aggressive Fed. These observations are speculative and subject to change based on market developments.
The data run and the Fed
| Release | Timing | Forecast | Prior |
|---|---|---|---|
| ADP October employment | Wednesday 13:15 GMT | 69K (other estimates about 65K) | 90K |
| ISM services index | Wednesday 15:00 GMT | 54.8-55.0 | Not confirmed |
| October nonfarm payrolls | Friday 13:30 GMT | 65K (range about 60K-65K) | 29K |
CME-based pricing shows roughly 78%-80% odds of a 25-basis-point December hike. Each outcome would shift that differently:
The Fed’s 10-2 vote to hold in late October, with two dissenters favouring a 25-basis-point hike, helps explain why December pricing leans toward tightening and why each jobs print carries extra weight.
- Weak jobs data: weakens the case for a December hike
- Firm jobs data: reinforces the current hike odds
- Strong payrolls plus persistent services activity: raises the risk of a higher policy path into 2027
There are caveats. ADP covers only private employment and can diverge from official Bureau of Labor Statistics payrolls, revisions can change the signal, and inflation still weighs on the Fed’s thinking. For rate-sensitive positions, Friday’s payrolls number likely matters more than the election result itself.
Three things to watch from Wednesday’s open to Friday’s payrolls
First, watch whether Apple’s drag fades or deepens, and whether the Dow can reclaim its 50-day EMA or slides toward the 200-day. Second, watch the Senate outcome, because that is the result markets have not fully priced. Third, watch ADP and ISM services on Wednesday as an early read on Friday’s payrolls, the release most likely to move December rate expectations.
This article is for informational purposes only and should not be considered financial advice. Investors should conduct their own research and consult with financial professionals before making investment decisions.