
How Dual-Class Shares Put $24 Billion in Gulf Capital at Arm’s Length
19 hrs ago

The University of Michigan Consumer Sentiment Index fell to 49.8 in April 2026, the lowest reading in the survey’s history. At the same time, U.S. equities are trading near all-time highs. That gap between how Americans feel about the economy and what financial markets are pricing captures the central tension of the current moment: the conditions for stagflation are forming, even if the data has not yet confirmed the worst-case scenario. Two months into the Iran conflict, the U.S. economy faces an energy-driven inflation resurgence colliding with a deteriorating growth outlook. The Federal Reserve, constrained by its dual mandate and a hawkish incoming chair nominee, cannot move comfortably in either direction. Economists including Mohamed El-Erian and Mark Zandi have warned publicly that the standard policy toolkit does not work cleanly under these conditions. What follows explains what stagflation actually is, how the Iran conflict created the current risk, why the Fed is effectively paralysed, and what this means for U.S. investors navigating the rest of 2026.
The same week sentiment collapsed, the S&P 500 and Nasdaq closed at all-time highs for a third consecutive week, driven by a temporary Iranian agreement to halt nuclear enrichment and reopen the Strait of Hormuz; that ceasefire expired days later, leaving oil above $99 per barrel and the rally’s durability in question.
Most economic downturns follow a recognisable logic. Inflation rises, the central bank raises interest rates, growth slows, and inflation comes back down. Recession and inflation tend to trade off against each other, which gives policymakers a clear lever to pull. Stagflation breaks that logic.
Stagflation is the simultaneous presence of three conditions that, under normal circumstances, do not appear together:
The reason this combination is so damaging is that it removes every clean policy option.
The tools used to fight inflation, raising interest rates, actively worsen growth and employment. The tools used to stimulate growth, cutting rates, actively worsen inflation. Under stagflation, every move the central bank makes solves one problem while deepening the other.
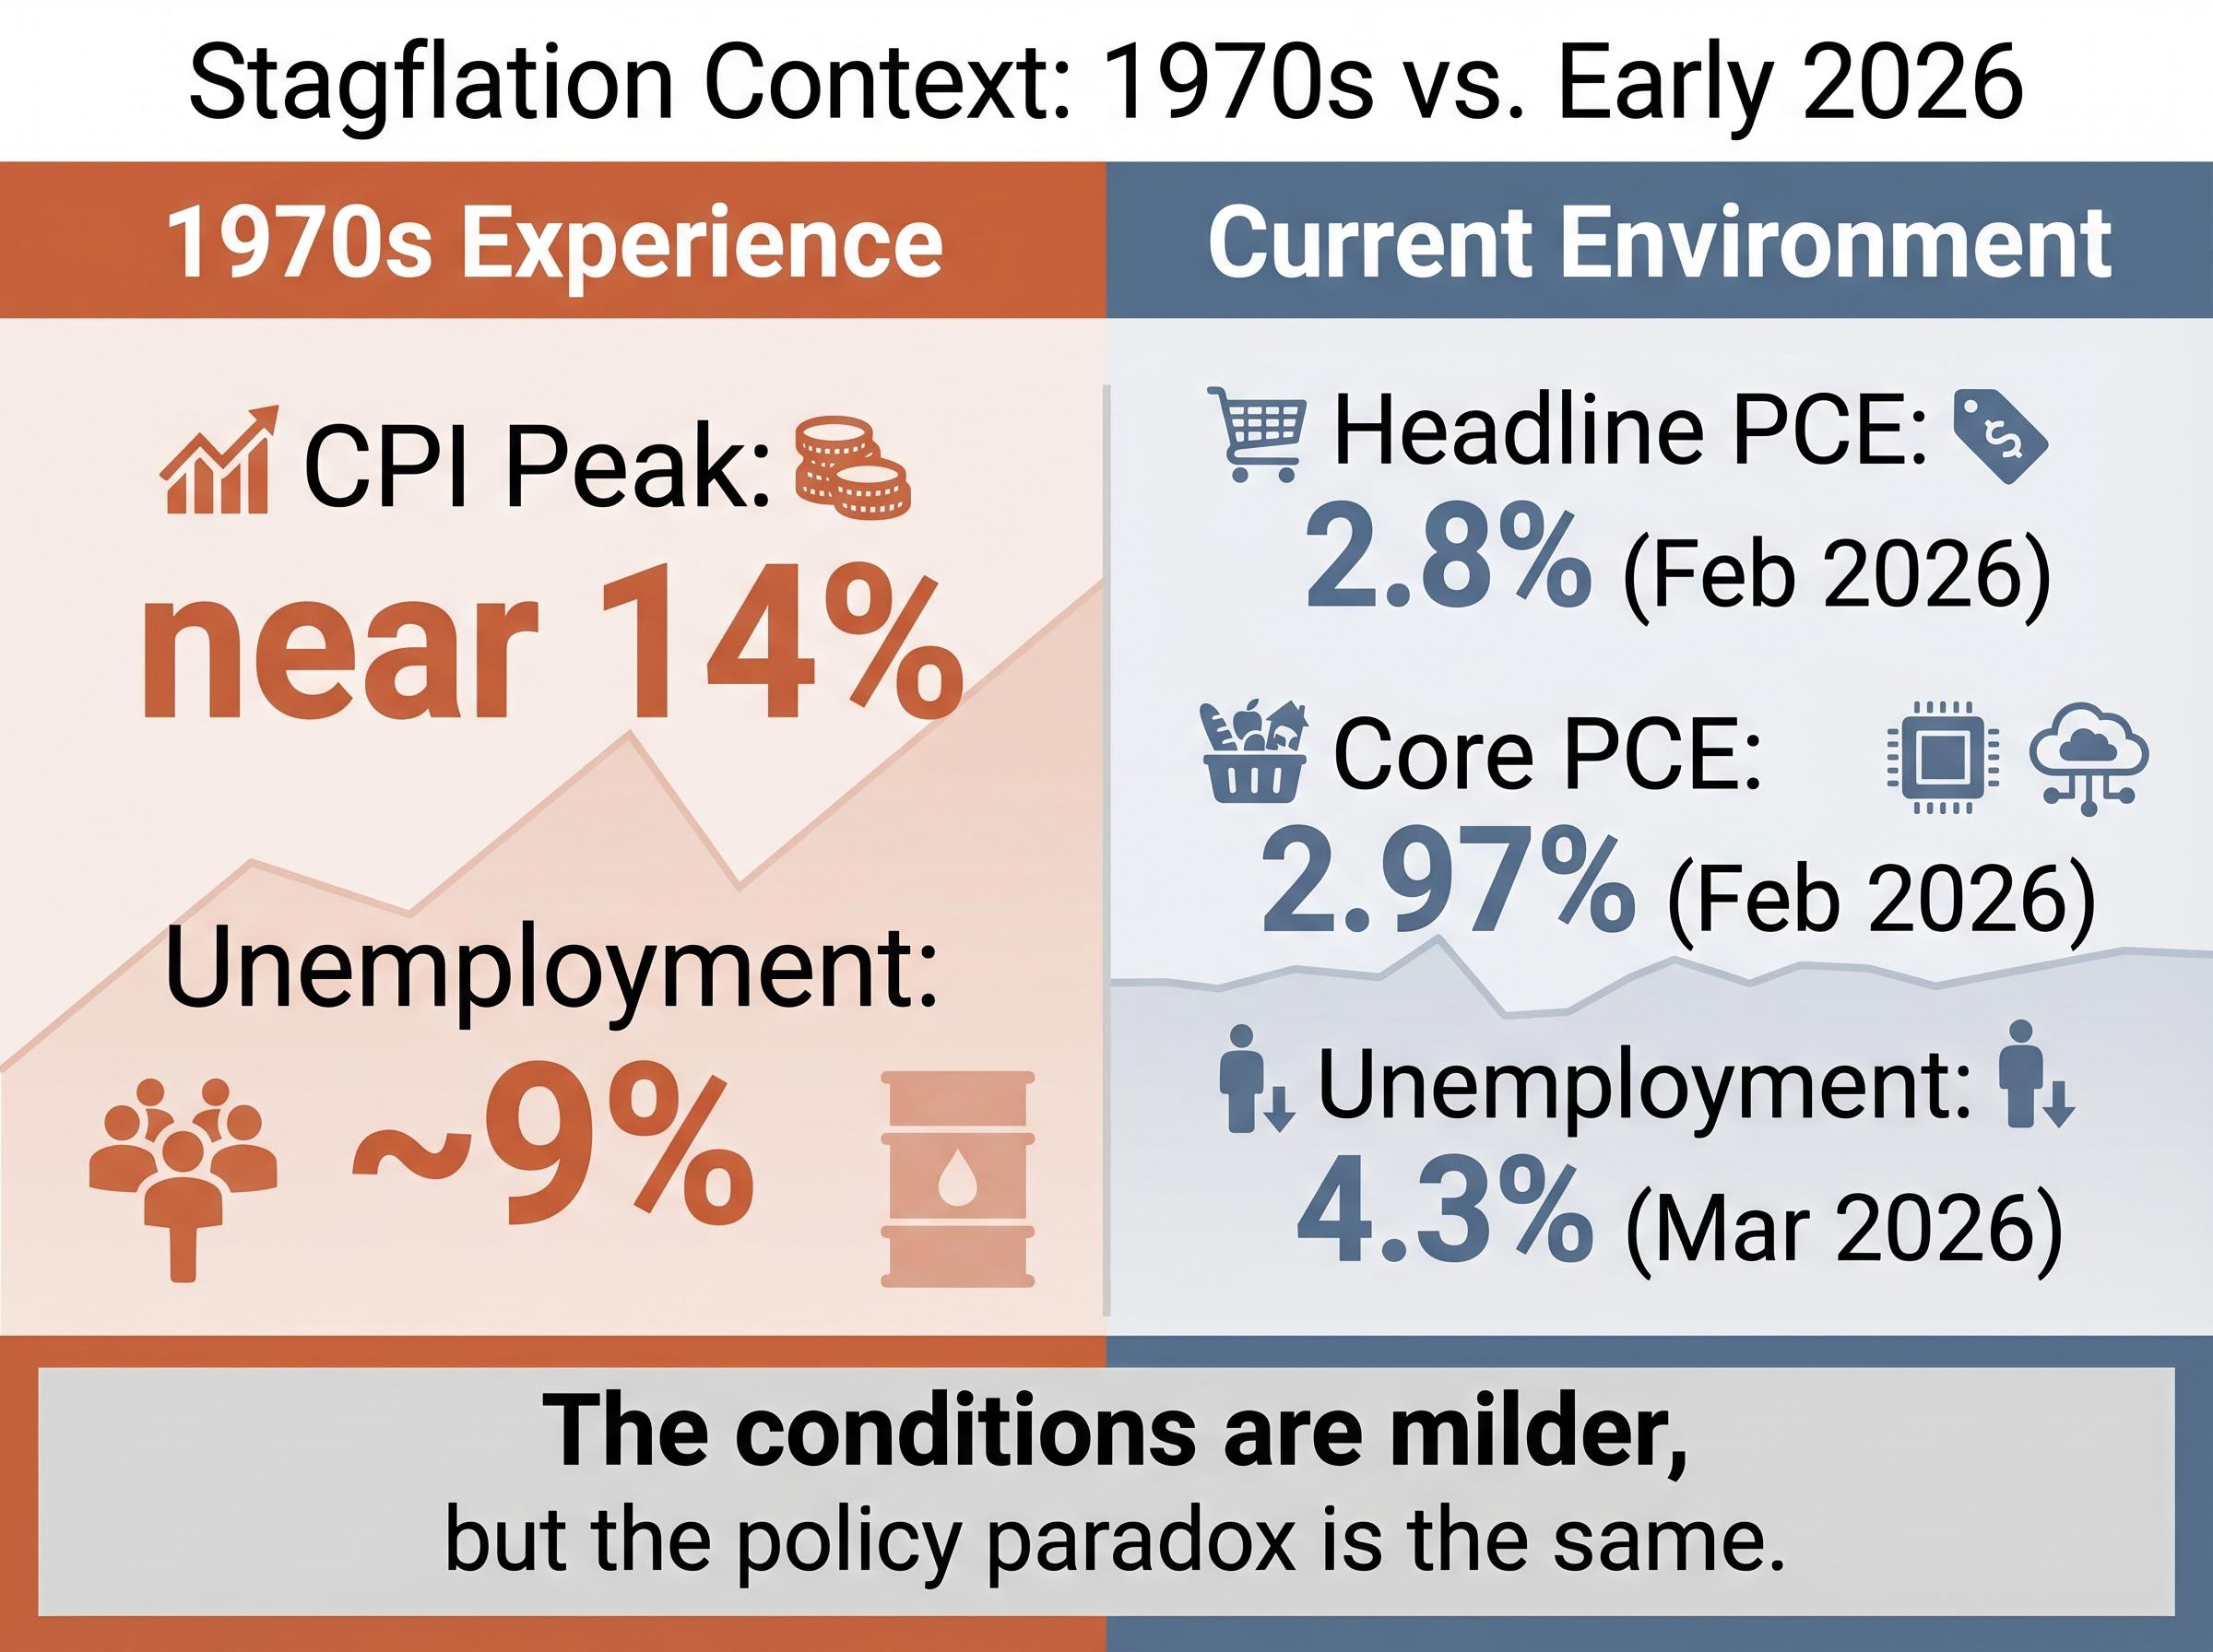
This is not a theoretical concern. The United States experienced stagflation during the 1970s, when the Consumer Price Index peaked near 14% and unemployment reached approximately 9%, according to Federal Reserve Economic Data (FRED). The current U.S. environment does not replicate those extremes. February 2026 headline PCE inflation sits at 2.8%, core PCE at 2.97%, and unemployment at 4.3% as of March 2026. The conditions are milder, but the policy paradox is the same.
The Iran conflict broke out in late February 2026. Within weeks, Middle East oil exports suffered a disruption that the International Energy Agency described, in a 12 March 2026 report, as the largest in the history of the global oil market. At peak impact, the IEA estimated that 7.5-10 million barrels per day were removed from global supply.
The economic damage follows a traceable sequence:
WTI crude oil was trading at approximately $96.33 per barrel as of 27 April 2026, representing a rise exceeding 40% from pre-conflict levels. Partial market stabilisation has occurred since the initial shock, but the price remains well above the range that underpinned early-2026 economic forecasts.
Mohamed El-Erian has described the mechanism as a “direct price shock” compounded by a “secondary adverse demand shock,” with additional risk of financial instability spillover.
That secondary demand shock is where the stagflation risk lives. Energy costs function as a tax on households. When petrol and utility bills rise sharply, consumers pull back spending elsewhere. That pullback drags growth lower even as the inflationary pressure from energy costs persists, producing exactly the combination of conditions that defines stagflation.
The binary price corridor facing energy markets is unusually wide: a confirmed diplomatic resolution points Brent toward $70-82 per barrel, while an escalation scenario or physical Strait closure risks a return to the $114.81 crisis peak recorded on 27 March 2026, and Russia’s unilateral output cuts of 300,000-400,000 barrels per day tighten supply further regardless of which path materialises.
The honest reading of U.S. economic data in late April 2026 is that hard numbers and sentiment indicators are telling different stories. Neither the optimistic nor the alarming interpretation captures the full picture.
| Indicator | Current Value | Date | Direction of Travel |
|---|---|---|---|
| WTI Crude Oil | ~$96.33/bbl | 27 April 2026 | Elevated; partially recovered from shock |
| Headline PCE (YoY) | 2.8% | February 2026 | Above target; modestly stable |
| Core PCE (YoY) | 2.97% | February 2026 | Down from 3.05% in January |
| Unemployment Rate | 4.3% | March 2026 | Down from 4.4% in February |
| UMich Consumer Sentiment | 49.8 | April 2026 | Record low |
On the surface, the hard data describes a slowing but not yet recessionary economy. Core PCE is trending lower. Unemployment ticked down. The IMF’s April 2026 World Economic Outlook forecasts U.S. GDP growth of 2.2% for the year, assuming limited conflict escalation. S&P Global’s Q2 outlook arrived at the same figure, though its framing was blunter: “curb your enthusiasm,” citing stagflation pressures.
The IMF April 2026 World Economic Outlook forecasts for U.S. growth carry an explicit caveat that the 2.2% projection assumes limited conflict escalation, with the report warning that a more severe or prolonged disruption to Middle East energy supply would push the economy toward the adverse stagflation path.
The consumer sentiment reading complicates that relative calm. A record low of 49.8 reflects a level of household pessimism that, historically, can become self-fulfilling. When consumers believe the economy is deteriorating, they reduce spending, and reduced spending makes the deterioration real.
Mark Zandi of Moody’s Analytics has argued that pre-war expectations for a GDP boost from deficit-financed stimulus and Fed rate cuts are no longer realistic, even if oil prices pull back quickly. The momentum and job creation that forecasters anticipated for 2026 are effectively off the table.
The gap between the moderate hard data and the collapsing sentiment is not a contradiction to be resolved. It is the uncertainty itself, the defining feature of the current environment.
The bullish Wall Street forecasts published at the start of 2026 rested on three assumptions: multiple Federal Reserve rate cuts, fiscal stimulus flowing into the economy, and stable energy prices. The Iran conflict has systematically dismantled all three.
Tom Graff, Chief Investment Officer at Facet, has noted that multiple leading Wall Street firms had incorporated anticipated Fed rate reductions into their equity forecasts for the year. That underpinning has been removed. Rate cuts that were expected to support equity valuations and stimulate borrowing are no longer a near-term probability.
AllianceBernstein, in an April 2026 CNBC appearance, characterised the situation directly: “Stagflation risk is rising but is not the base case yet.” The firm expects inflation to remain persistently above 2% while growth slows toward approximately 2%.
The Stanford Institute for Economic Policy Research (SIEPR) has flagged stagflation as a key watch item for 2026, particularly if energy prices remain elevated through the second half of the year.
The contrarian view deserves direct engagement. Core PCE is trending down, from 3.05% to 2.97%. Unemployment is stable at 4.3%. WTI at $96 is elevated but not at sustained extreme highs. These data points suggest the supply shock is not yet translating into 1970s-style deterioration, and some economists argue the stagflation narrative has outrun the evidence.
The range of outcomes breaks into two broad scenarios:
Recession probability estimates across major institutions span a wide range, from 15% at Morgan Stanley to 48.6% at Moody’s Analytics, with the divergence itself reflecting the core problem: no one can model the outcome reliably because it depends almost entirely on whether oil prices fall far enough, fast enough, to give the Fed room to move.
The question for investors is not whether stagflation will happen. It is which combination of factors would push the current moderate risk environment into a more severe outcome, and what the early warning signs look like.
The Federal Reserve operates under a dual mandate: price stability and maximum employment. In most economic environments, these two objectives align well enough that the Fed can pursue both simultaneously. The current environment puts them in direct conflict.
The Federal Reserve’s dual mandate framework for monetary policy requires the central bank to pursue both maximum employment and stable prices simultaneously, a structure that functions smoothly in most economic environments but creates an unresolvable policy conflict when inflation and unemployment rise together.
Inflation remains above the 2% target. The energy shock has not resolved. Core PCE at 2.97% gives the Fed no room to declare victory on prices. That argues for holding rates steady or raising them.
Growth is slowing. Consumer sentiment has collapsed to a record low. Mark Zandi’s assessment that GDP momentum is effectively off the table for 2026 argues for cutting rates to support the economy before conditions deteriorate further.
The two sides of the policy trap:
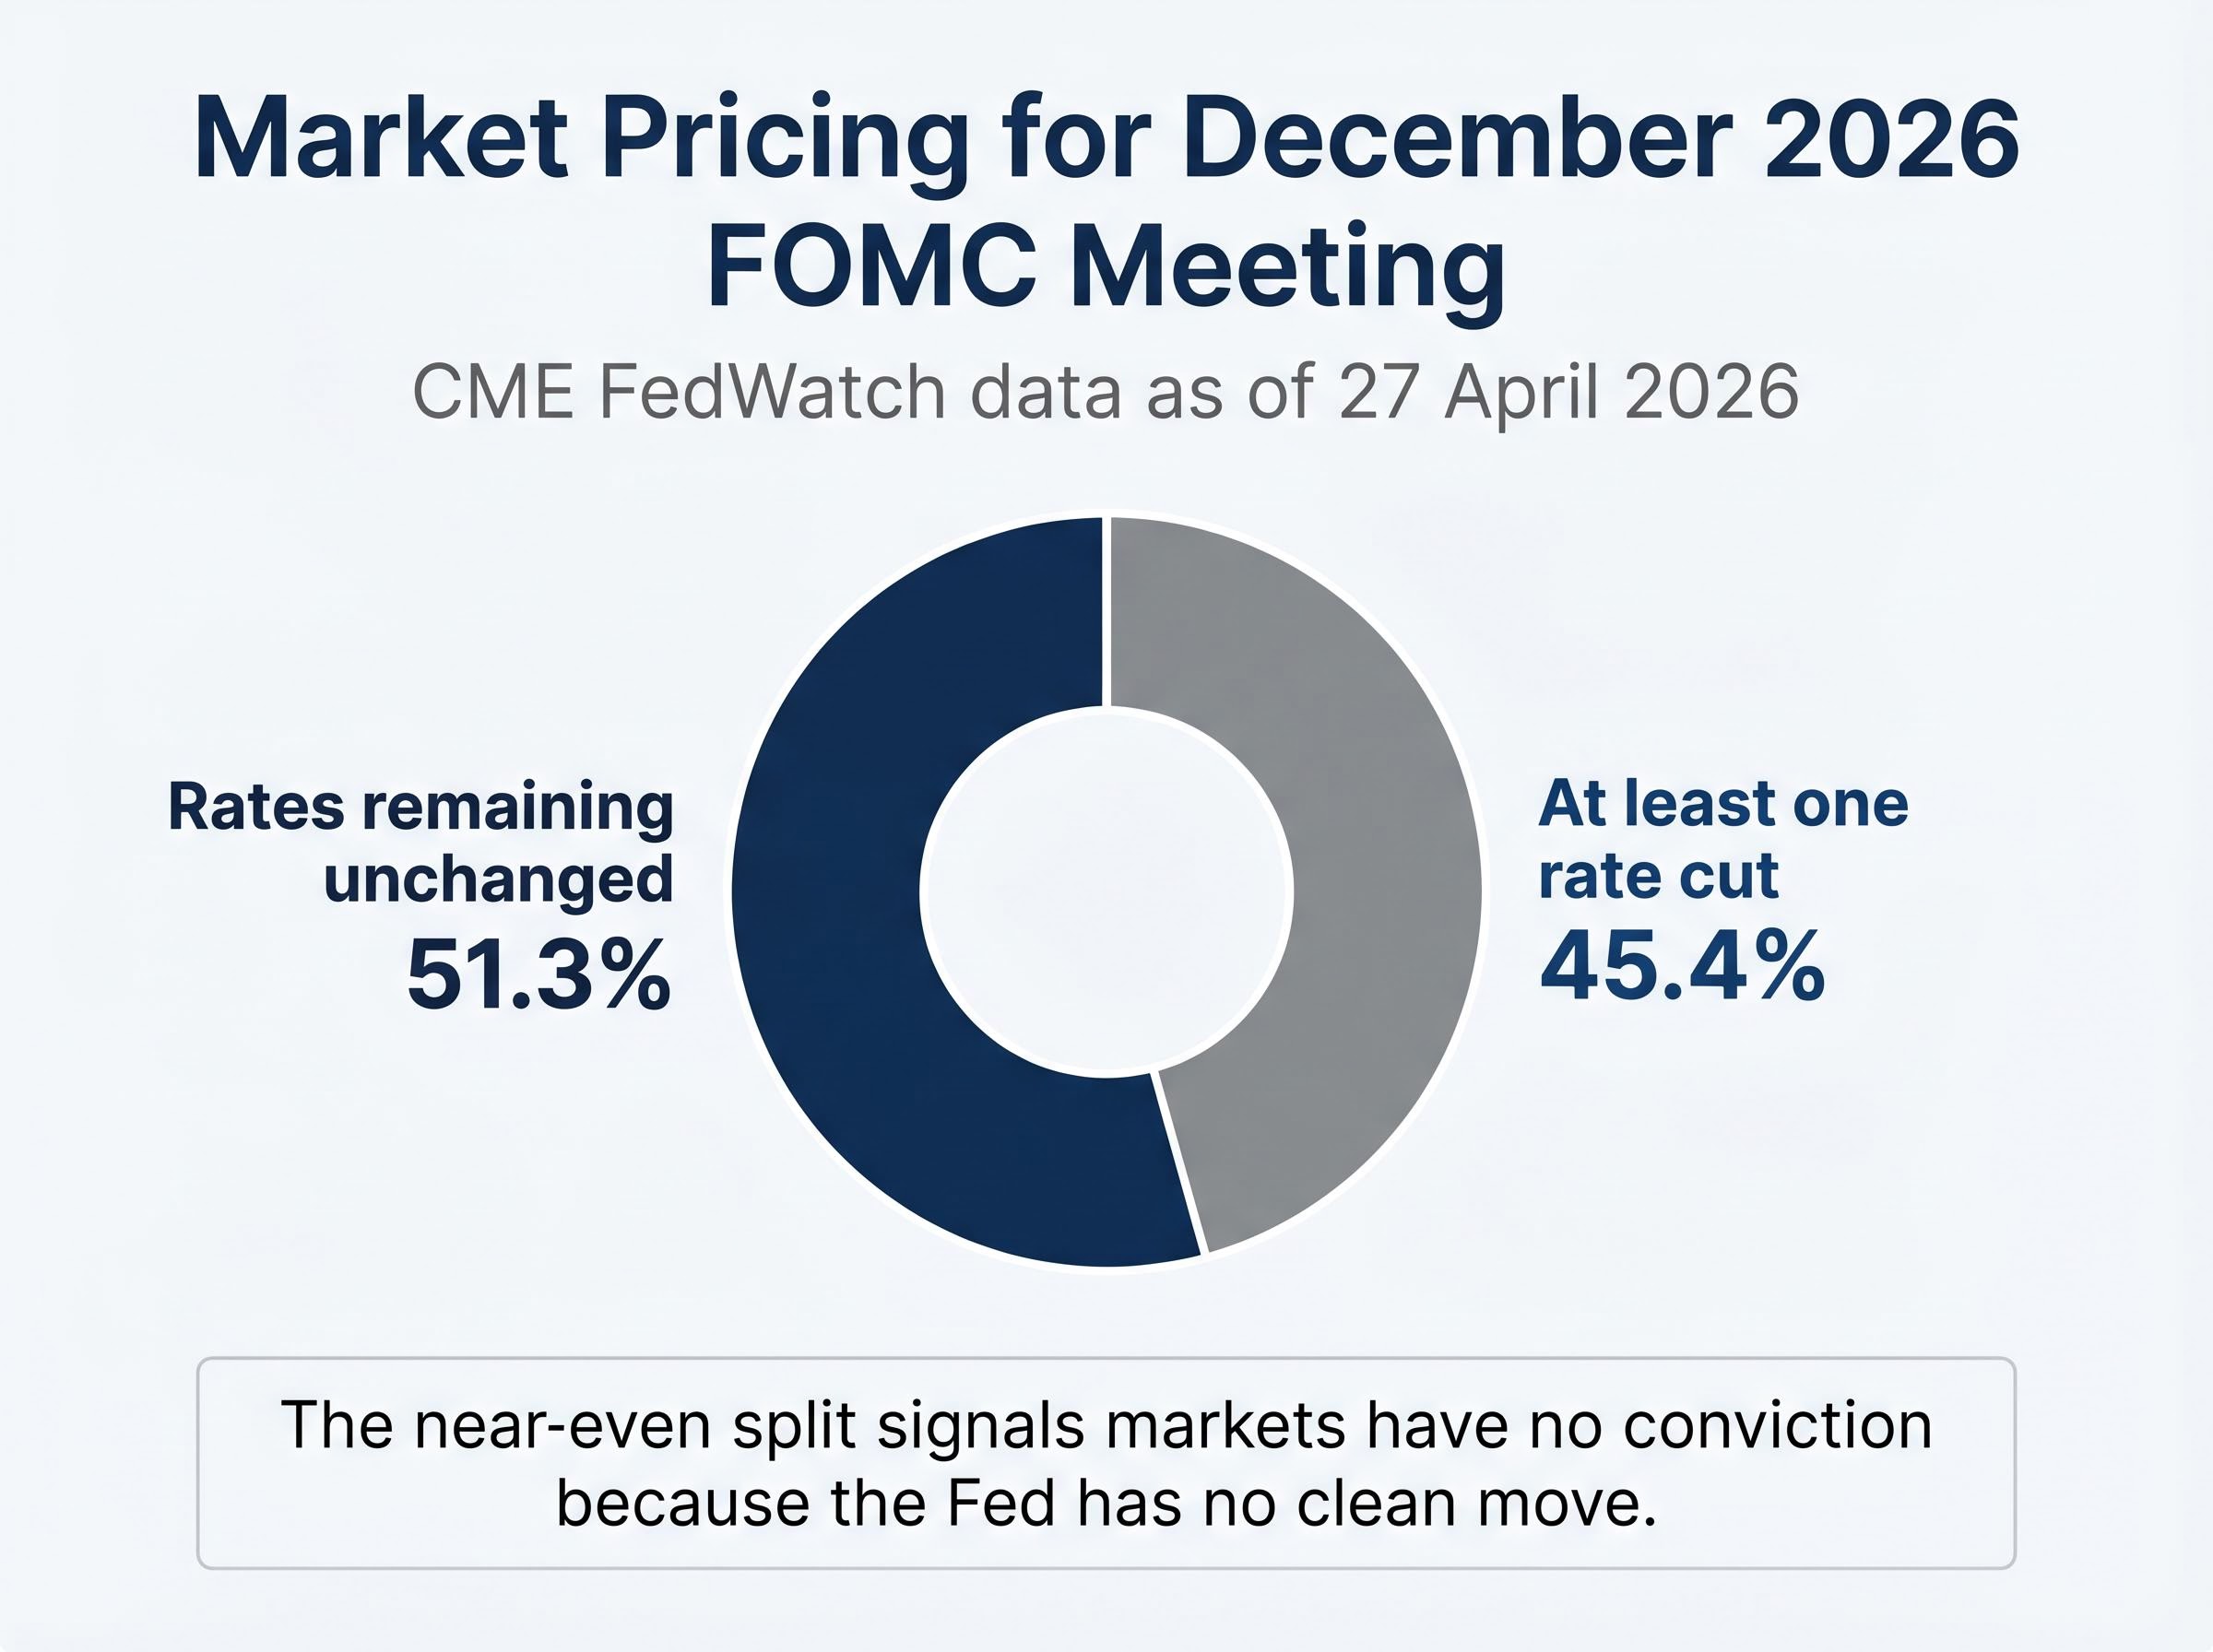
CME FedWatch data as of 27 April 2026 reflects this paralysis directly. Approximately 51.3% of market pricing points to rates remaining unchanged at the December 2026 FOMC meeting. Roughly 45.4% prices in at least one rate cut by year-end. That near-even split is itself the signal: markets have no conviction about the Fed’s next move because the Fed has no clean move to make.
Tom Graff has warned that Fed-related downside risk is not adequately reflected in current stock valuations. If economic data deteriorates while the Fed feels restricted from cutting, the situation could become problematic for equity markets that have priced in a more accommodative path.
Jerome Powell, in the 18 March 2026 FOMC statement, maintained focus on the 2% inflation target without signalling imminent rate cuts, while acknowledging the energy shock’s risks. Rate cut expectations have fallen from as many as three anticipated cuts for the remainder of 2026 to just one, or potentially none.
Kevin Warsh has been nominated as the next Federal Reserve Chair, though he has not yet been confirmed by the Senate. Powell has stated he will remain in the role until a successor is confirmed.
Warsh’s Congressional testimony signalled a preference for maintaining restrictive monetary policy, a stance more hawkish than many market observers had anticipated. That signal matters because it shifts the market’s working assumption about the Fed’s reaction function under future leadership. If Warsh takes the chair, the threshold for rate cuts may be higher than under Powell, even if economic conditions deteriorate.
The nomination itself is already a policy signal that economists and markets are pricing into rate expectations for late 2026 and beyond.
Stagflation risk in the U.S. is not a certainty. It is a genuine policy trap that has removed the options markets were counting on. Three forces are interlocking: the Iran supply shock that pushed energy costs sharply higher, the Fed’s paralysed dual mandate that prevents a clean response, and the collapse in growth expectations that Zandi, El-Erian, and institutional forecasters have described.
The hard data, moderating core PCE, stable unemployment, does not yet confirm the worst-case scenario. The honest position is elevated vigilance, not panic.
For investors tracking the rest of 2026, three indicators matter most: oil prices as a proxy for the supply shock’s persistence, monthly PCE releases as the clearest measure of inflation’s trajectory, and CME FedWatch rate expectations as a real-time gauge of whether the Fed’s paralysis is deepening or easing. The conflict’s trajectory remains the single most consequential variable.
For investors who want a structured framework for acting on the three indicators identified above, our comprehensive walkthrough of investing during market volatility in 2026 covers asset allocation shifts toward energy and safe-haven positions, the historical case against panic selling into downturns, and a monitoring framework built around Fed policy, energy data, and monthly inflation releases.
This article is for informational purposes only and should not be considered financial advice. Investors should conduct their own research and consult with financial professionals before making investment decisions. Financial projections referenced in this article are subject to market conditions and various risk factors. Past performance does not guarantee future results.
Stagflation is the simultaneous combination of stagnant economic growth, rising unemployment, and persistent inflation. It is so difficult to fight because the tools used to combat inflation (raising interest rates) worsen growth and employment, while the tools used to stimulate growth (cutting rates) worsen inflation, leaving central banks with no clean policy option.
The Iran conflict, which broke out in late February 2026, caused the largest oil supply disruption in global market history according to the IEA, removing an estimated 7.5-10 million barrels per day at peak impact. This pushed WTI crude above $96 per barrel, driving up energy costs and inflation while simultaneously dragging down consumer spending and economic growth.
The Fed faces a direct conflict in its dual mandate because inflation remains above its 2% target (core PCE at 2.97% as of February 2026), meaning premature rate cuts risk entrenching higher inflation, while slowing growth and record-low consumer sentiment argue for easing. CME FedWatch data as of late April 2026 shows markets are nearly evenly split between rates staying on hold and at least one cut by year-end, reflecting the Fed's paralysis.
The three most important indicators to watch are oil prices (as a measure of how persistent the supply shock is), monthly PCE releases (as the clearest gauge of inflation's trajectory), and CME FedWatch rate expectations (as a real-time signal of whether the Federal Reserve's policy paralysis is deepening or easing).
No, stagflation is not yet confirmed. Core PCE is trending downward, unemployment is stable at 4.3%, and the IMF forecasts U.S. GDP growth of 2.2% for 2026 under a limited-conflict scenario. However, AllianceBernstein and other institutions have flagged stagflation risk as rising, and the record-low consumer sentiment reading of 49.8 in April 2026 signals that conditions could deteriorate further.


